Figures
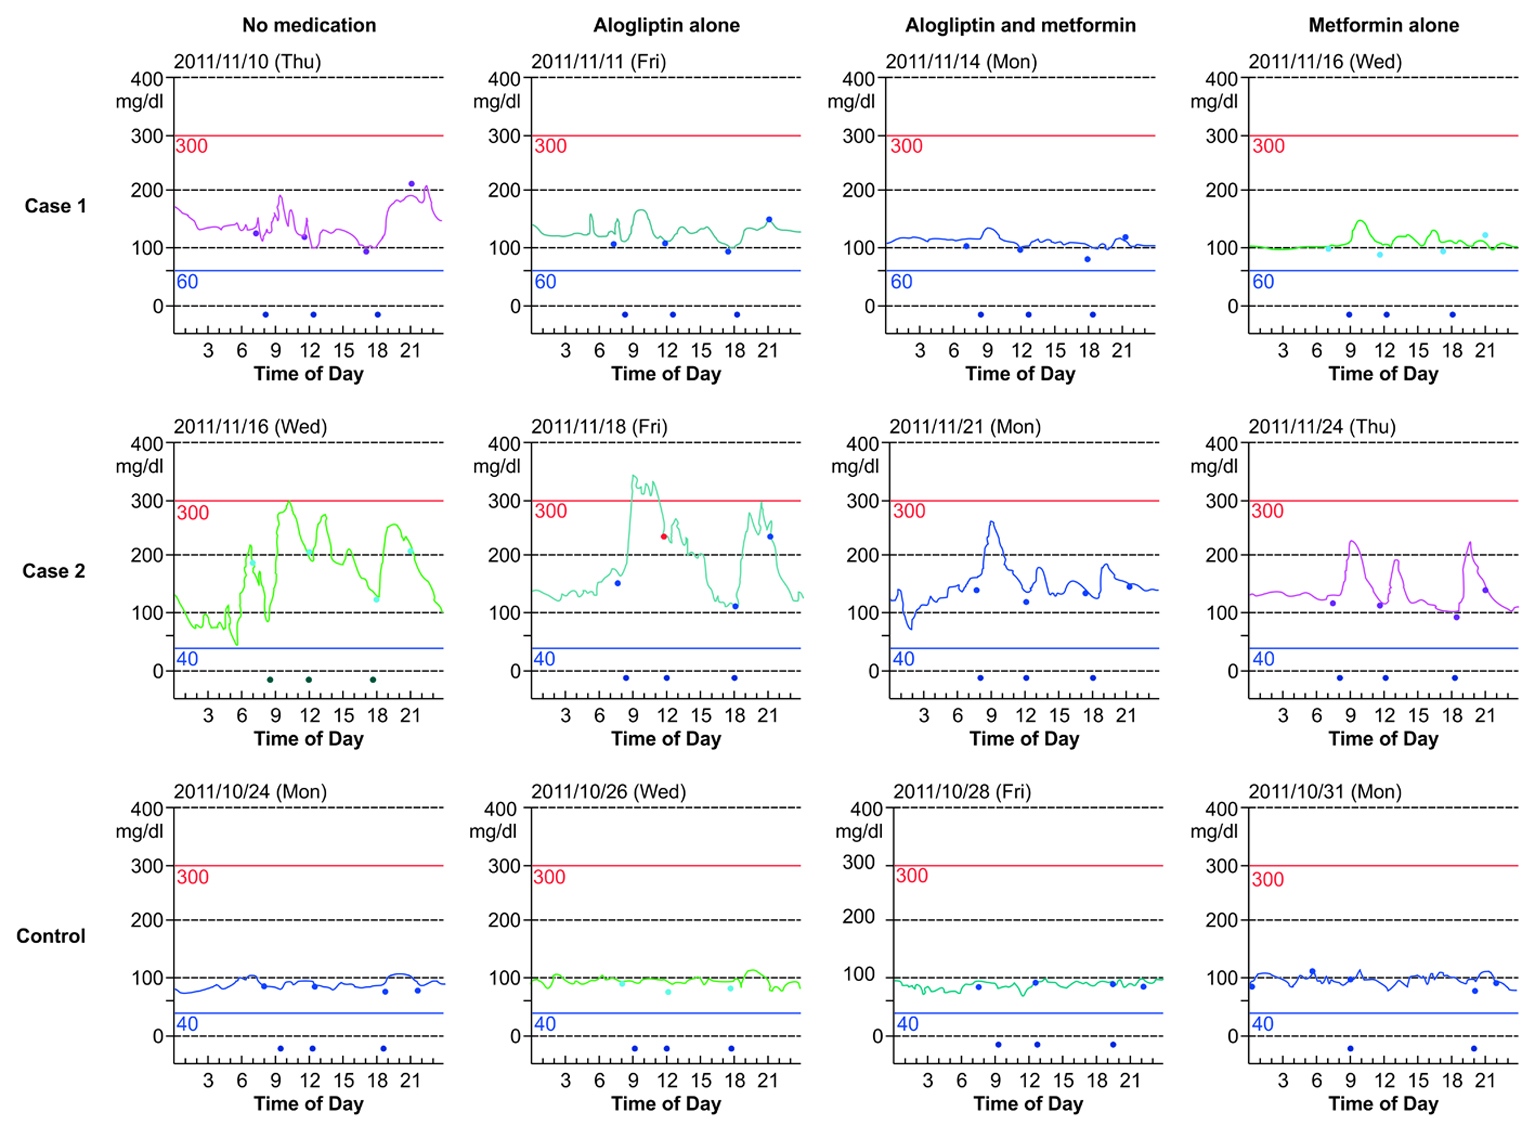
Figure 1. Continuous glucose monitoring (CGM) results. CGM results of patients with diabetes in cases 1 and 2 and that of the control subject obtained when no medication, alogliptin alone, alogliptin and metformin co-administration, and metformin alone were administered. The signs at the bottom of the figures indicate the time of the meals (In the figure for the control patient, the sign indicating lunch on the day when metformin alone was administered is missing). The signs on the lines of each figure indicate the times of calibration.
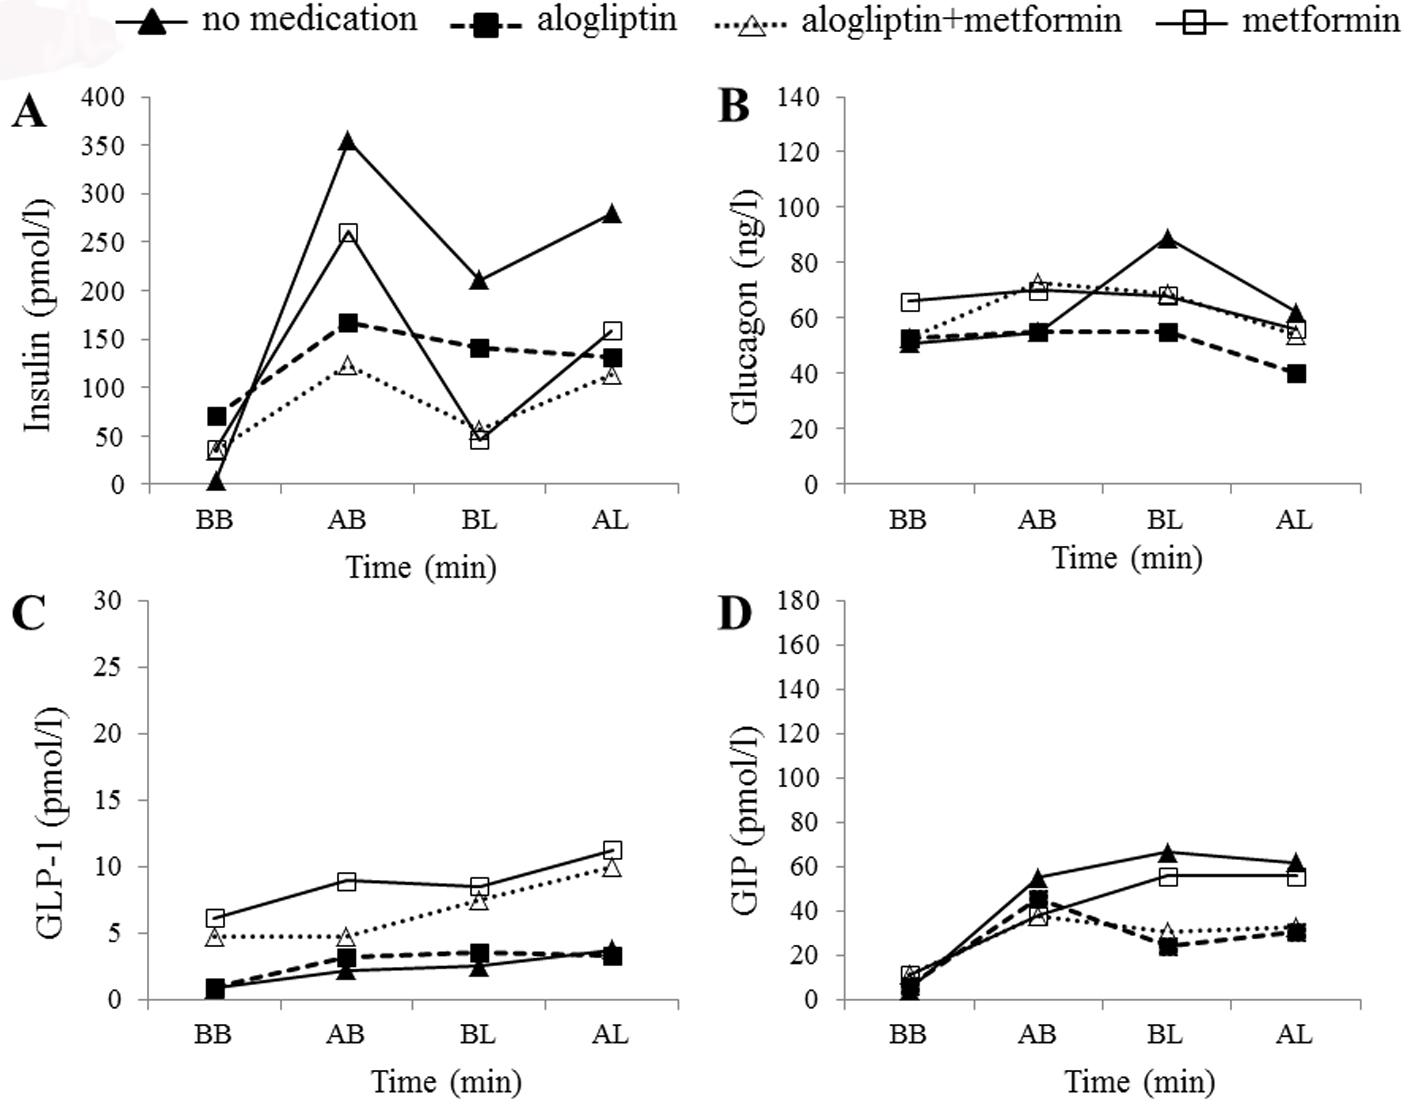
Figure 2. Hormonal changes in case 1. Time courses of plasma insulin (A), glucagon (B), active glucagon-like peptide-1 (GLP-1) (C), and total glucose-dependent insulinotropic peptide (GIP) (D) levels before breakfast (BB), 1 h after breakfast (AB), before lunch (BL), and 1 h after lunch (AL) in the patient in case 1. Filled triangles, filled squares, open triangles, and open squares indicate no medication, alogliptin alone, alogliptin and metformin co-administration, and metformin alone, respectively.
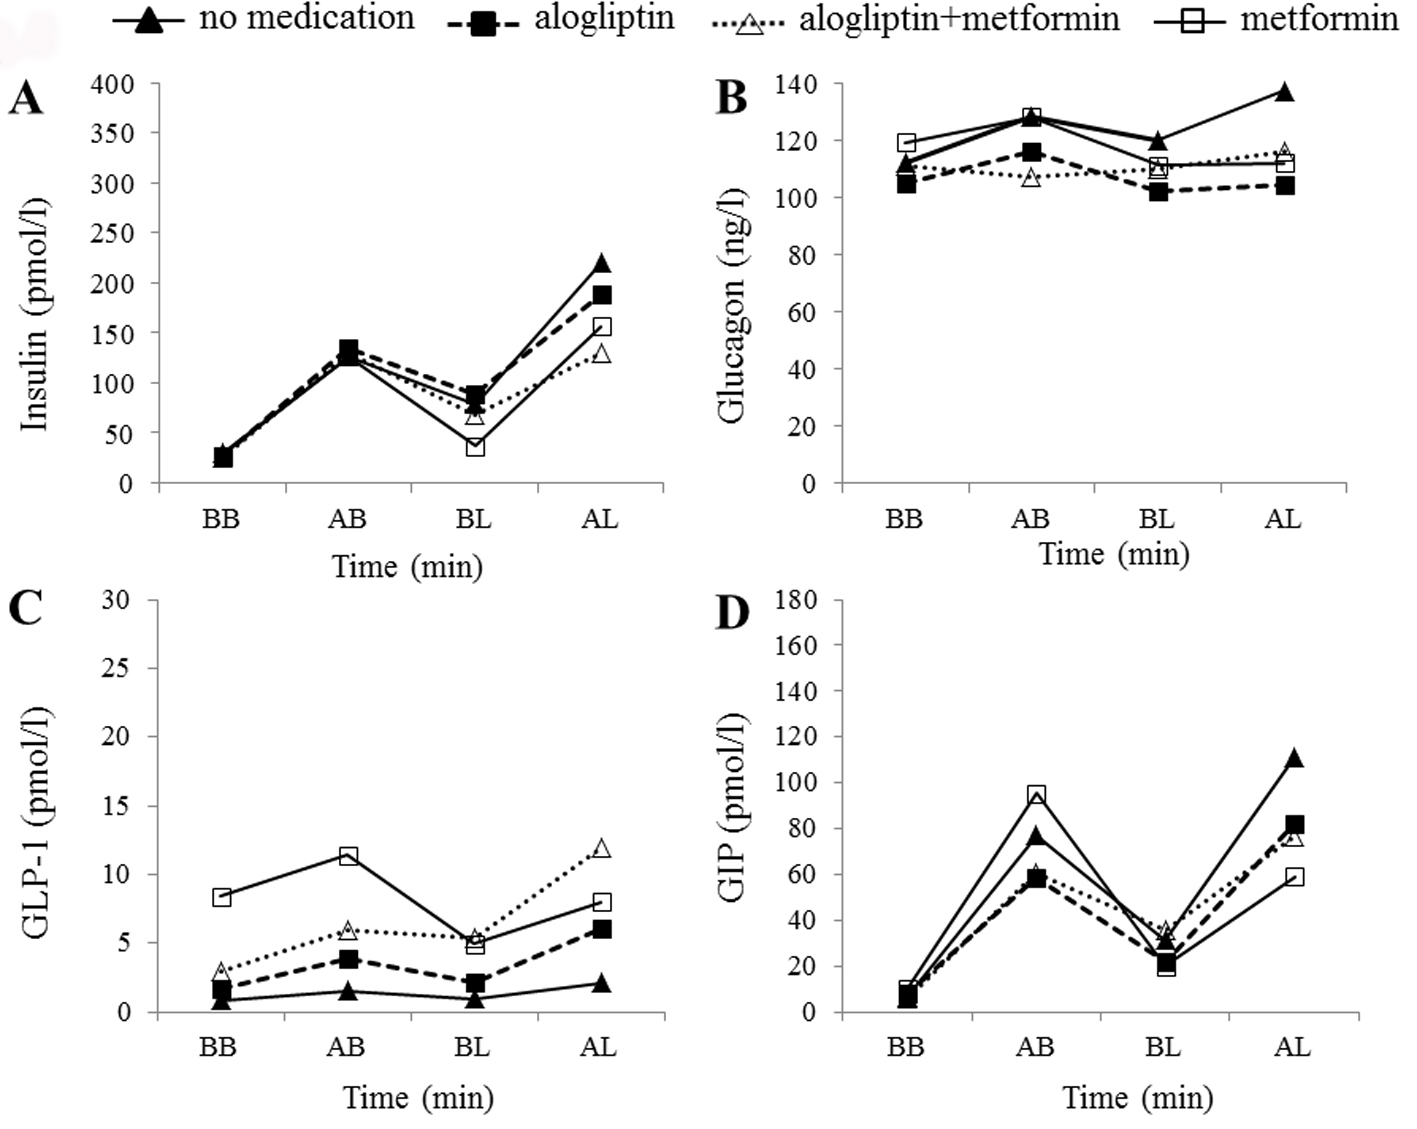
Figure 3. Hormonal changes in case 2. Time courses of plasma insulin (A), glucagon (B), active GLP-1 (C), and total GIP (D) levels before breakfast (BB), 1 h after breakfast (AB), before lunch (BL), and 1 h after lunch (AL) in the patient in case 2. Filled triangles, filled squares, open triangles, and open squares indicate no medication, alogliptin alone, alogliptin and metformin co-administration, and metformin alone, respectively.
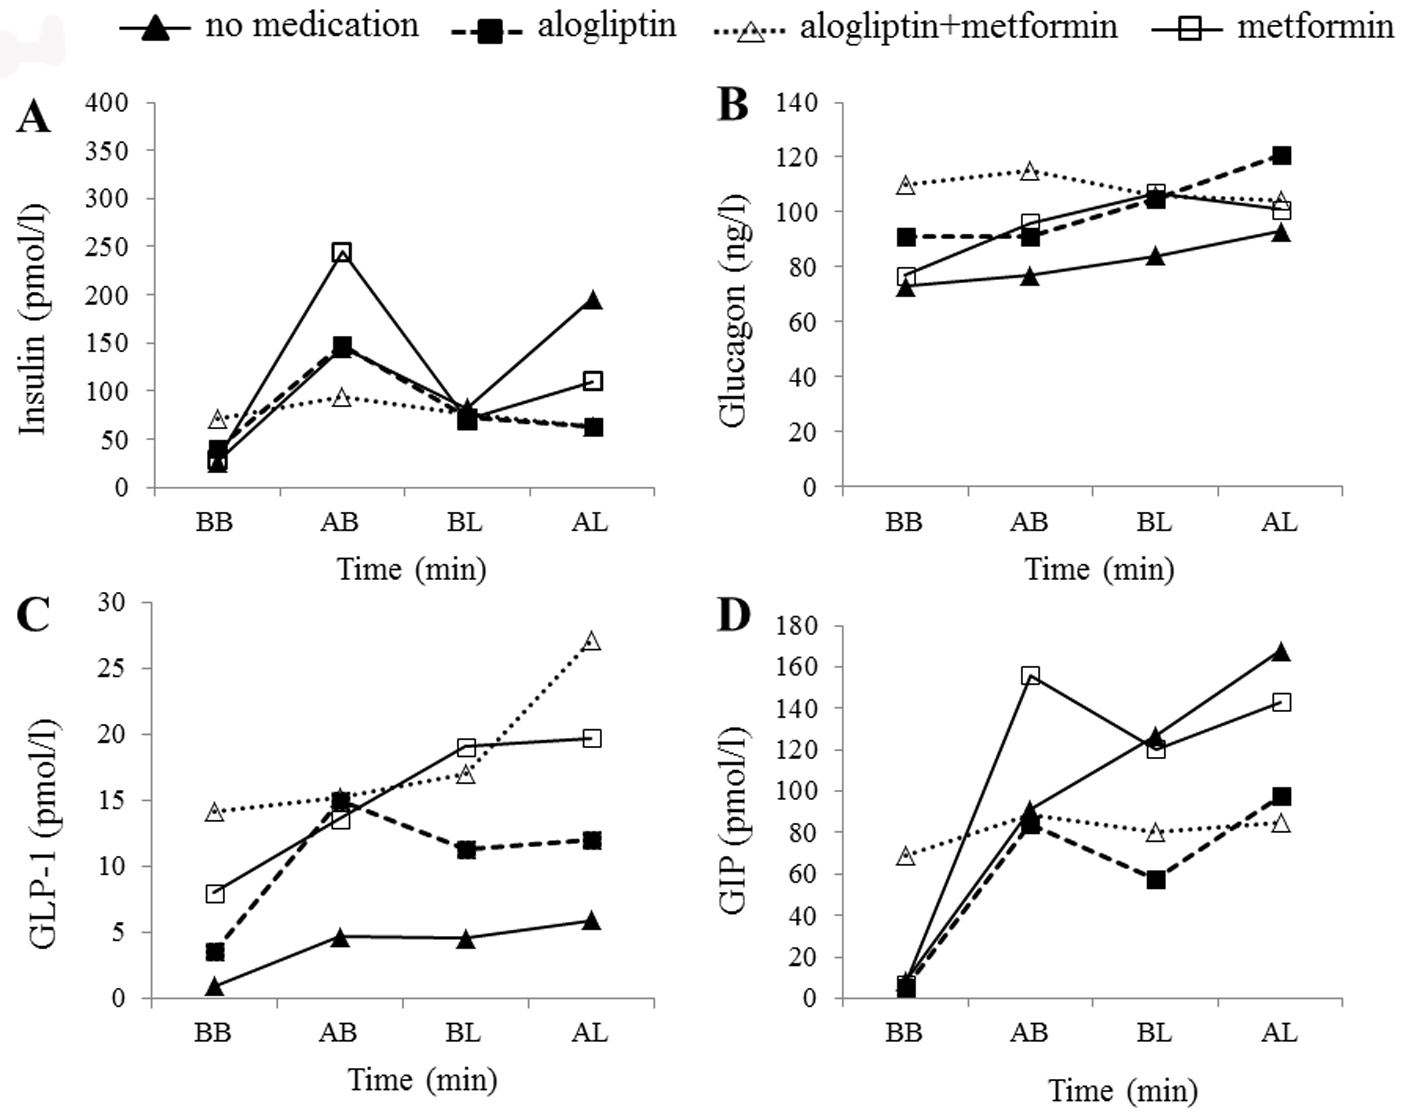
Figure 4. Hormonal changes in the control subject. Time courses of plasma insulin (A), glucagon (B), active GLP-1 (C), and total GIP (D) levels before breakfast (BB), 1 h after breakfast (AB), before lunch (BL), and 1 h after lunch (AL) in the control subject. Filled triangles, filled squares, open triangles, and open squares indicate no medication, alogliptin alone, alogliptin and metformin co-administration, and metformin alone, respectively.
Tables
Table 1. Subject Characteristics
| Case 1 | Case 2 | Control |
|---|
| BMI, body mass index; HbA1c, hemoglobin A1c. |
| Age (years) | 57 | 58 | 48 |
| Sex | Male | Male | Female |
| BMI (kg/m2) | 22.1 | 26.1 | 23.1 |
| Diabetes duration (years) | 5 | 5 | None |
| Treatment prior to study | Alogliptin | Metformin | None |
| HbA1c (%) | 7.3 | 7.4 | 5.7 |
Table 2. Twenty-Four-Hour Glucose Levels Measured by Continuous Glucose Monitoring
| Case 1 | Case 2 | Control |
|---|
| SD, standard deviation. |
| Glucose (mg/dL) (mean ± SD) | | | |
| No medication | 144 ± 26 | 170 ± 66 | 93 ± 9 |
| Alogliptin alone | 132 ± 14 | 190 ± 64 | 100 ± 7 |
| Alogliptin + metformin | 116 ± 7 | 151 ± 32 | 88 ± 7 |
| Metformin alone | 110 ± 11 | 136 ± 29 | 99 ± 9 |