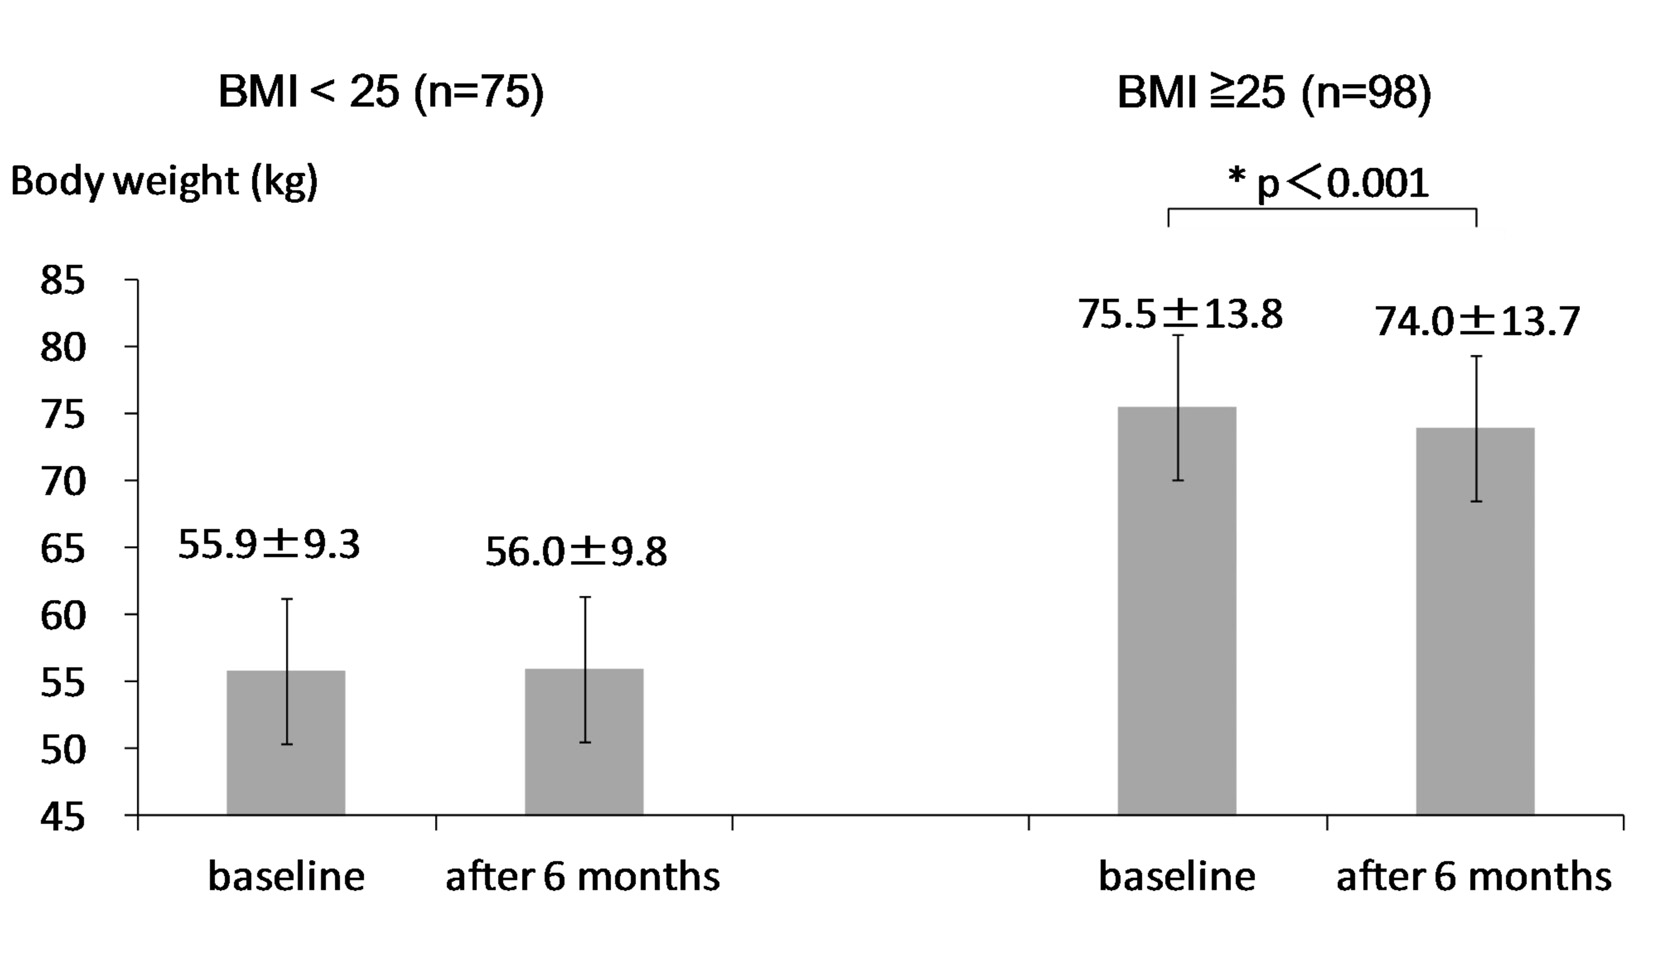
Figure 1. Change in body weight after the 6-month sitagliptin treatment in non-obese (BMI < 25) and obese groups (BMI ≥ 25). Presented boxes and bars indicate mean and SD, respectively. A statistical analysis was performed by the paired t-test.
| Journal of Endocrinology and Metabolism, ISSN 1923-2861 print, 1923-287X online, Open Access |
| Article copyright, the authors; Journal compilation copyright, J Endocrinol Metab and Elmer Press Inc |
| Journal website http://www.jofem.org |
Original Article
Volume 4, Number 5-6, December 2014, pages 136-142
Significant Differences in Effects of Sitagliptin Treatment on Body Weight and Lipid Metabolism Between Obese and Non-Obese Patients With Type 2 Diabetes
Figures
Tables
| BMI ≥ 25 (n = 98) | BMI < 25 (n = 75) | P-value | |
|---|---|---|---|
| BMI: body mass index; BP: blood pressure; eGFR: estimated glomerular filtration rate; HDL-C: high-density lipoprotein-cholesterol; LDL-C: low-density lipoprotein-cholesterol; TG: triglyceride. | |||
| Age (years) | 59.1 (14.5) | 69.6 (12.0) | < 0.001 |
| Sex (male/female) | 43/55 | 44/31 | 0.054 |
| Body height (cm) | 160.9 (9.3) | 159.9 (8.4) | 0.461 |
| Body weight (kg) | 76.1 (13.9) | 56.1 (9.3) | < 0.001 |
| BMI (kg/m2) | 29.4 (4.6) | 21.8 (2.3) | < 0.001 |
| Systolic BP (mm Hg) | 129 (14) | 126 (16) | 0.146 |
| Diastolic BP (mm Hg) | 72 (11) | 68 (12) | < 0.05 |
| Plasma glucose (mg/dL) | 191.6 (71.7) | 180.9 (65.2) | 0.323 |
| HbA1c (%) | 7.8 (1.5) | 7.6 (1.3) | 0.344 |
| LDL-C (mg/dL) | 111.7 (29.9) | 98.4 (23.1) | < 0.05 |
| TG (mg/dL) | 202.5 (130.5) | 130.7 (84.3) | < 0.001 |
| HDL-C (mg/dL) | 48.8 (12.1) | 53.7 (16.2) | < 0.05 |
| eGFR (mL/min/1.73 m2) | 82.6 (25.0) | 72.3 (19.7) | < 0.01 |
| BMI ≥ 25 (n = 98) | BMI < 25 (n = 75) | |
|---|---|---|
| No other drugs | 23 (23.5%) | 10 (13.3%) |
| Sulfonylurea | 28 (28.6%) | 34 (45.3%) |
| Biguanide | 52 (53.1%) | 32 (42.7%) |
| Thiazolidinedione | 40 (40.8%) | 26 (34.7%) |
| α-glucosidase inhibitor | 35 (35.7%) | 25 (33.3%) |
| Glinide | 15 (15.3%) | 7 (9.3%) |
| Values after 6 months | Changes from baseline | P-value | |
|---|---|---|---|
| BMI: body mass index; BP: blood pressure; eGFR: estimated glomerular filtration rate; PG: plasma glucose. | |||
| BMI < 25 (n = 75) | |||
| Systolic BP (mm Hg) | 124.1 (13.3) | -1.2 (19.8) | 0.631 |
| Diastolic BP (mm Hg) | 70.4 (10.2) | +3.1 (12.8) | 0.062 |
| PG (mg/dL) | 170.7 (67.6) | -6.8 (74.9) | 0.472 |
| eGFR (mL/min/1.73 m2) | 71.2 (18.3) | -0.9 (9.4) | 0.459 |
| BMI ≥ 25 (n = 98) | |||
| Systolic BP (mm Hg) | 126.0 (13.2) | -3.0 (15.3) | 0.082 |
| Diastolic BP (mm Hg) | 71.2 (11.9) | -1.0 (11.5) | 0.460 |
| PG (mg/dL) | 178.6 (64.3) | -12.2 (61.0) | 0.462 |
| eGFR (mL/min/1.73 m2) | 80.2 (27.5) | -2.6 (14.0) | 0.079 |