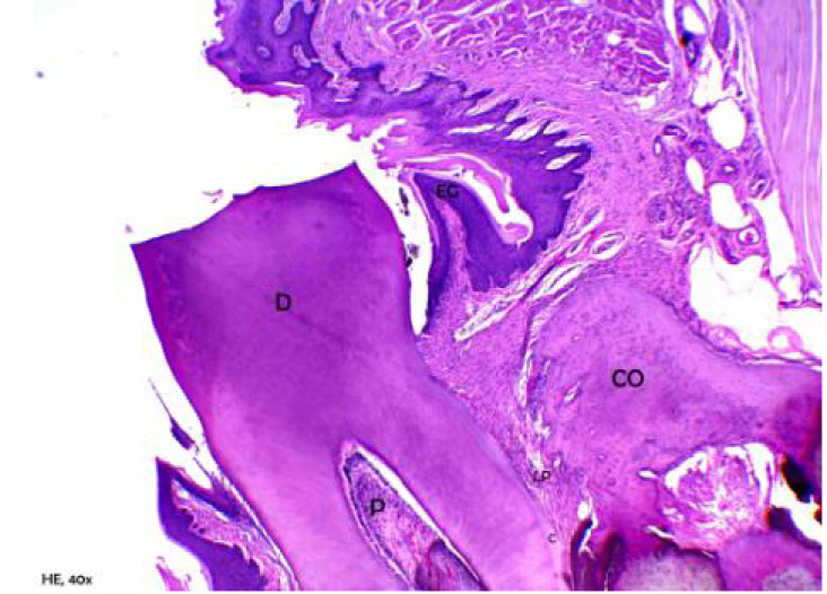
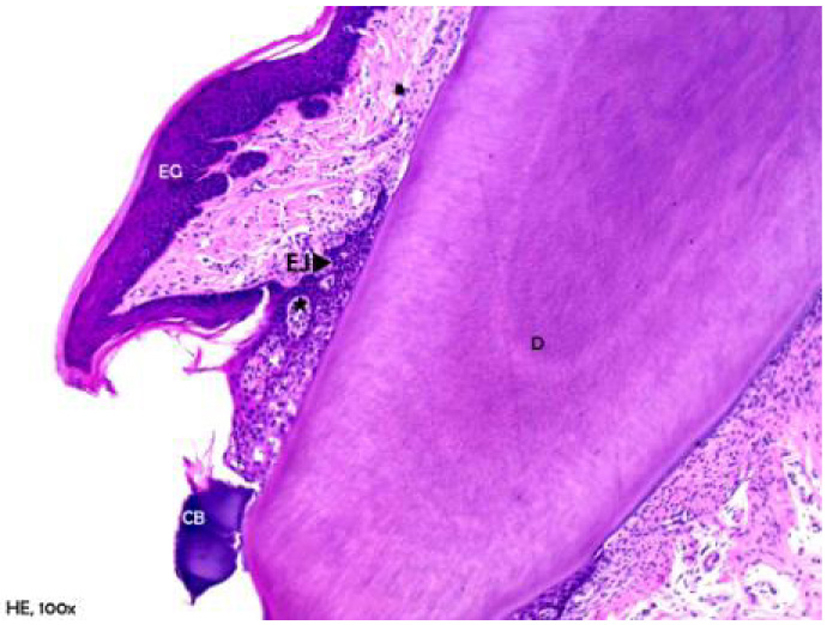
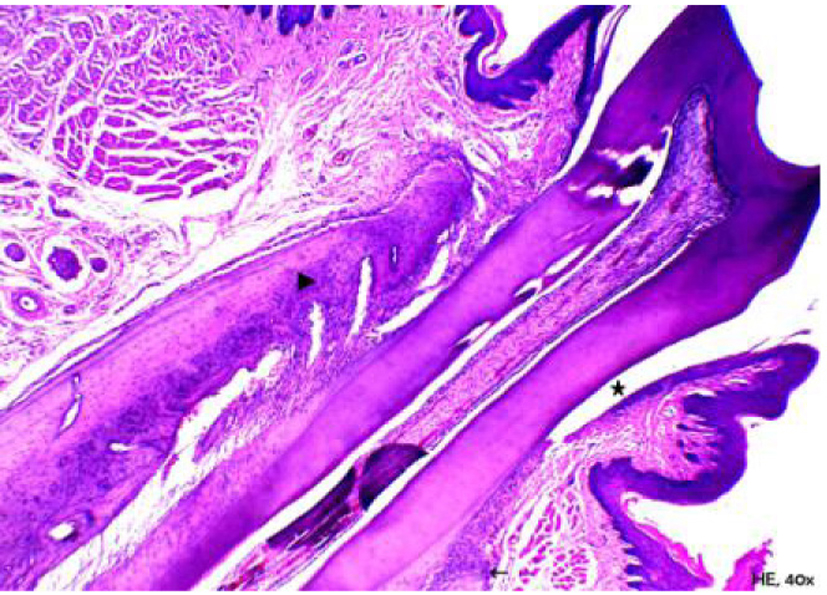
Figure 1. Representative photomicrography of an animal from control group. D: dentin; P: pulp; EG: gingival epithelium; CO: crest bone; LP: periodontal ligament; C (hematoxylin and eosin, × 40).
| Journal of Endocrinology and Metabolism, ISSN 1923-2861 print, 1923-287X online, Open Access |
| Article copyright, the authors; Journal compilation copyright, J Endocrinol Metab and Elmer Press Inc |
| Journal website http://www.jofem.org |
Original Article
Volume 5, Number 1-2, April 2015, pages 172-178
Evaluation of Bone Tissue After Cafeteria-Diet-Induced Obesity and Periodontitis in Rats
Figures
Tables
| Energy value (kJ/100 g) | Carbohydrates (g/100 g) | Proteins (g/100 g) | Fat (g/100 g) | Sodium (mg/100 g) | |
|---|---|---|---|---|---|
| Cheetos Snack (Pepsico, Brazil) | 1,948 | 72 | 6.4 | 17.2 | 676 |
| Bacon snack/Trofeu (Santa Helena, Brazil) | 2,200 | 56 | 8.8 | 30 | 1,040 |
| Cornstarch cookie (Zadimel, Brazil) | 1,793 | 73 | 8 | 10.7 | 300 |
| Chocolate cake (Renata, Brazil) | 1,798 | 55 | 5 | 21.7 | 141.7 |
| Soda/coke (Coca-cola, Brazil) | 178 | 11 | 0 | 0 | 5 |
| Soda/Guarana (Antarctica, Brazil) | 168 | 10 | 0 | 0 | 5.5 |
| Italian salami (Sadia, Brazil) | 1,822 | 2 | 22 | 38 | 1,140 |
| Sausage (Sadia, Brazil) | 1,554 | 1.4 | 16 | 34 | 1,342 |
| Bisnaguinha (bread) (Nutrella, Brazil) | 1,328 | 54 | 11.2 | 6.2 | 300 |
| Chocolate Waffer (Bauducco, Brazil) | 2,176 | 63 | 5 | 27 | 113 |
| Bologna (Frimesa, Brazil) | 845 | 2 | 12 | 16 | 1,545 |
| Marshmallow (Fini, Brazil) | 1,423 | 80 | 5 | 0 | 46 |
| Groups | Final weight (g) | Nasoanal length (cm) | Lee index (g/cm) |
|---|---|---|---|
| P < 0.01. Different letters indicate that the results are statistically different between groups, in the same parameter of evaluation. The values represent mean ± standard deviation. | |||
| CONTROL | 472 ± 1.0A | 24.0 ± 1.0A | 320.7 ± 15.0A |
| LIG | 460 ± 2.0A | 24.0 ± 1.0A | 316.9 ± 10.0B |
| OBESE | 630 ± 5.5B | 25.5 ± 1.0AB | 336.0 ± 13.0C |
| OBESE + LIG | 618 ± 2.5B | 26.4 ± 1.0B | 322.0 ± 11.0D |
| Groups | Retroperitoneal fat | Periepidimal fat | ||
|---|---|---|---|---|
| Weights (g) | Weight percentage (%) | Weights (g) | Weight percentage (%) | |
| P < 0.01. Different letters indicate that the results are statistically different between groups, in the same parameter of evaluation. The values represent mean ± standard deviation. | ||||
| CONTROL | 5.8 ± 1.0A | 1.2 ± 0.2A | 7.4 ± 1.4A | 1.6 ± 0.3A |
| LIG | 6.0 ± 1.0A | 1.3 ± 0.2A | 7.2 ± 1.0A | 1.6 ± 0.2A |
| OBESE | 30.6 ± 4.0B | 4.8 ± 0.5B | 14.3 ± 2.9B | 2.3 ± 0.4B |
| OBESE + LIG | 26.0 ± 4.0B | 4.2 ± 0.7B | 14.4 ± 1.8B | 2.3 ± 0.2B |
| Groups | Mean |
|---|---|
| P < 0.01. Different letters indicate that the results are statistically different between groups, in the same parameter of evaluation. The values represent mean ± standard deviation. | |
| CONTROL | 51.27 ± 1.59A |
| LIG | 45.98 ± 1.05B |
| OBESE | 48.78 ± 0.89C |
| OBESE + LIG | 37.24 ± 0.90D |
| Groups | Mean (µm) |
|---|---|
| P < 0.01. Different letters indicate that the results are statistically different between groups, in the same parameter of evaluation. The values represent mean ± standard deviation. | |
| CONTROL | 336.85 ± 10.84A |
| LIG | 776.19 ± 34.44B |
| OBESE | 542.29 ± 12.84C |
| OBESE + LIG | 822.12 ± 24.96D |