Journal of Endocrinology and Metabolism, ISSN 1923-2861 print, 1923-287X online, Open Access
Article copyright, the authors; Journal compilation copyright, J Endocrinol Metab and Elmer Press Inc
Journal website http://www.jofem.org

Original Article

Volume 4, Number 5-6, December 2014, pages 121-135


Associations Between Liver Function, Bone Turnover Biomarkers and Adipokines in Older Patients With Hip Fracture

Figure

Figure 1.
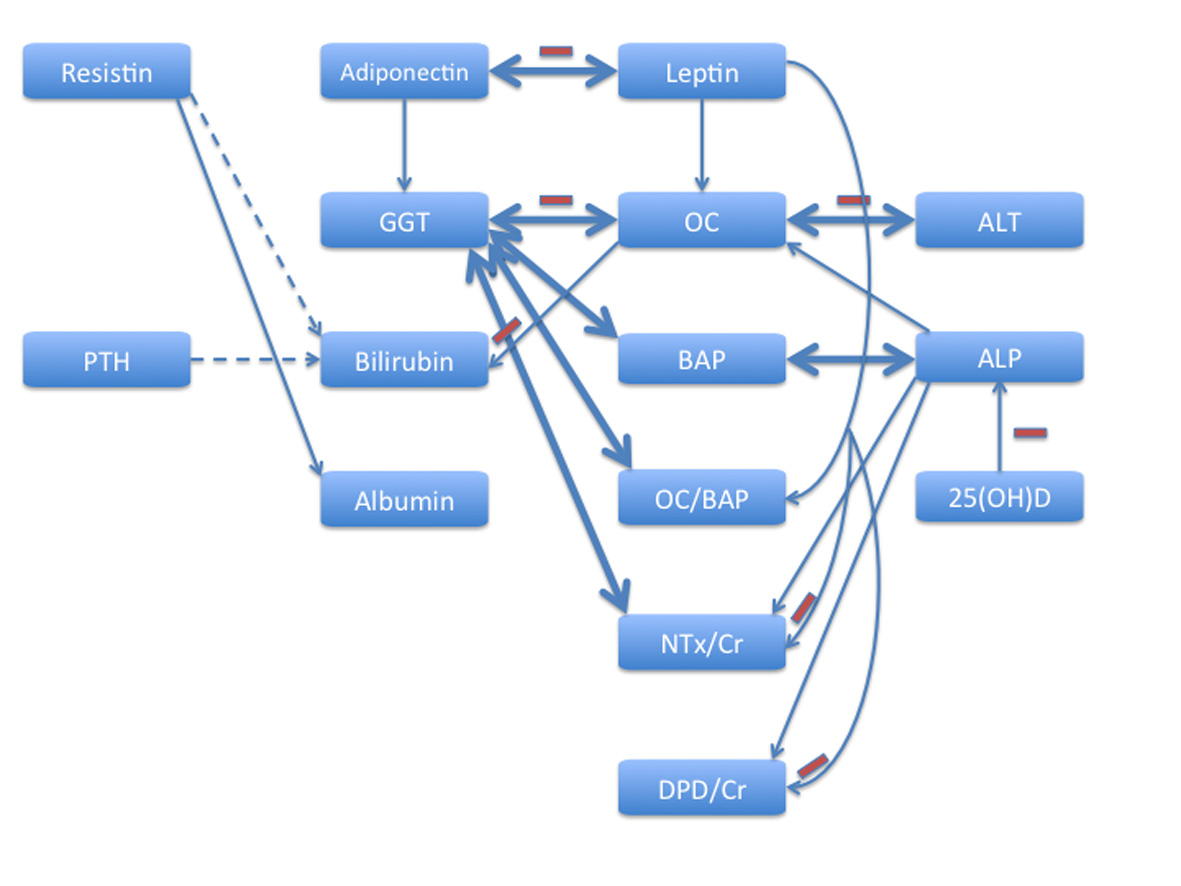
Figure 1. Links between liver markers, indices of bone metabolism and adipokines in older patients with hip fracture. GGT: gamma-glutamyltransferase; ALT: alanine aminotransferase; ALP: alkaline phosphatase; OC: osteocalcin; BAP: bone specific alkaline phosphatase; NTx/Cr: cross-linked N-telopeptide of type 1 collagen corrected for urinary creatinine concentration; DPD/Cr: deoxypyridinoline corrected for urinary creatinine concentration; PTH: parathyroid hormone; Hb: hemoglobin. Bidirectional links are shown in bold arrows; -- indicates inhibitory effect. The interactions between GGT and OC, BAP, and NTx/Cr, as well as between ALT and OC, and between ALP and BAP are bidirectional: the activity of hepatic enzymes contributes to synthesis and release of molecules reflecting bone formation and bone resorption, and these, in turn, influence the circulating levels of liver enzymes. ALP activity correlates with levels of serum OC and urinary resorption markers. There is a strong reciprocal association between adiponectin and leptin. Adiponectin is positively associated with GGT activity, while leptin is positively associated with OC and OC/BAP ratio and inversely with both resorption markers; therefore, adiponectin and leptin may exert opposite effects on bone metabolism; resistin is associated with serum albumin concentration. In multiple logistic regression analyses adjusted for age, sex and confounding laboratory (but not clinical) variables both resistin and PTH were independently associated with bilirubin levels (shown in dashed lines). All other data are based on fully adjusted model. Of note, in malnourished patients circulating adiponectin and OC levels are positively associated, while adiponectin does not correlate with GGT activity (not shown).

Tables

Table 1. Demographic, Clinical and Laboratory Characteristics of the Studied Patients With Hip Fracture (n = 294)
 
Clinical characteristicLaboratory characteristic
CAD: coronary artery disease; TIA: transient ischemic attack; DM: diabetes mellitus; CKD: chronic kidney disease; COPD: chronic obstructive pulmonary disease; ALT: alanine aminotransferase; GGT: gamma-glutamyltransferase; ALP: alkaline phosphatase; 25(OH)D: 25-hydroxyvitamin D; PTH: parathyroid hormone; TSH: thyroid-stimulating hormone; T4: thyroxin; eGFR: estimated glomerular filtration rate; SHPT: secondary hyperparathyroidism (PTH > 6.8 pmol/L); NTx/Cr: cross-linked N-telopeptide of type 1 collagen corrected for urinary creatinine concentration; DPD/Cr: deoxypyridinoline corrected for urinary creatinine concentration. *Malnutrition was defined as serum leptin concentration < 4 ng/mL in males and < 6.5 ng/mL in females. **Vitamin D insufficiency was defined as 25(OH)D < 50 nmol/L.
Age, years (mean ± SD)82.2 ± 7.9ALT, U/L23.0 ± 42.6
Females, %72.1GGT, U/L54.1 ± 95.6
Cervical/trochanteric fracture, n152/142ALP, U/L105.4 ± 80.1
Hypertension, %54.0Albumin, g/L37.1 ± 6.3
CAD, %21.2Bilirubin, µmol/L12.4 ± 7.4
Atrial fibrillation, %13.2OC, ng/mL17.2 ± 15.2
History of stroke or TIA, %21.7BAP, U/L26.4 ± 14.2
Type 2 DM, %18.8NTx/Cr, nmol/µmol159.4 ± 169.0
Dementia, %27.8DPD/Cr, nmol/µmol12.6 ± 7.2
Parkinson’s disease, %4.425(OH)D, nmol/L37.3 ± 18.0
COPD, %11.8PTH, pmol/L6.9 ± 5.6
CKD stage ≥ 3, %42.6Adiponectin, ng/mL17.5 ± 7.4
Malnutrition*, %33.8Leptin, ng/mL18.5 ± 23.2
Alcohol (≥ 3 times a week), %9.5Resistin, ng/mL18.7 ± 10.5
Ex-smokers, %10.0Hb, g/L124.9 ± 17.1
Current smokers, %5.4TSH, mU/L1.55 ± 2.17
Vitamin D insufficiency**, %79.7T4, pmol/L15.9 ± 3.54
SHPT, %38.2eGFR, mL/min/1.73 m265.1 ± 23.7


Table 2. Correlation of Serum Liver Markers With Indices of Bone-Mineral Metabolism, Leptin, Adiponectin, and Resistin Levels, Thyroid Markers and Hemoglobin
 
GGTALTALPAlbuminBilirubin
Pearson’s correlation coefficients for log-transformed variables after adjustment for age and sex shown. GGT: gamma-glutamyltransferase; ALT: alanine aminotransferase; ALP: alkaline phosphatase; eGFR: estimated glomerular filtration rate; OC: osteocalcin; BAP: bone specific alkaline phosphatase; DPD/Cr: deoxypyridinoline corrected for urinary creatinine concentration; NTx/Cr: cross-linked N-telopeptide of type 1 collagen corrected for urinary creatinine concentration; 25(OH)D: 25-hydroxyvitamin D; PTH: parathyroid hormone; TSH: thyroid-stimulating hormone; T4: thyroxin; Cac: calcium corrected for albumin; PO4: phosphate; Mg: magnesium. *P < 0.05; **P < 0.001; ***P < 0.001.
OC-0.182**-0.158**0.104-0.034-0.147*
BAP0.307***0.0500.462***0.0140.005
OC/BAP-0.350***-0.178**-0.183**-0.035-0.137*
DPD/Cr0.018-0.0710.191**-0.037-0.021
NTx/Cr-0.134*-0.0410.150*-0.069-0.035
25(OH)D0.014-0.022-0.165**0.012-0.021
PTH0.0530.0580.1110.0360.139*
Cac-0.0020.0860.133*-0.111-0.039
PO4-0.016-0.0490.0920.058-0.075
Mg-0.087-0.0680.0170.105-0.065
Leptin-0.082-0.025-0.0450.108-0.029
Adiponectin0.146*0.0870.0590.0100.128*
Resistin0.0880.0010.0540.124*0.153*
L/A-0.116-0.070-0.0440.109-0.055
L/R-0.109-0.038-0.0540.059-0.077
A/R0.0220.053-0.011-0.090-0.034
TSH0.132*0.057-0.037-0.0140.043
T4-0.186**0.121*-0.144*0.0270.007
Hb-0.146*0.071-0.129*0.281***0.047


Table 3. Multiple Linear Regression Analyses for Liver Markers in Older Patients With Hip Fracture
 
Log GGTLog ALTLog ALPLog albuminLog bilirubin
ABABABABAB
β (P value)β (P value)β (P value)β (P value)β (P value)β (P value)β (P value)β (P value)β (P value)β (P value)
Parameters identified as significant and independent predictors of GGT, ALT, albumin and bilirubin are shown. β: β-standardized regression coefficient; GGT: gamma-glutamyltransferase; ALT: alanine aminotransferase; ALP: alkaline phosphatase; OC: osteocalcin; BAP: bone specific alkaline phosphatase; DPD/Cr: deoxypyridinoline corrected for urinary creatinine concentration; NTx/Cr: cross-linked N-telopeptide of type 1 collagen corrected for urinary creatinine concentration; 25(OH)D: 25-hydroxyvitamin D; PTH: parathyroid hormone; CAD: coronary artery disease; AF: atrial fibrillation; PD: Parkinson’s disease; R2: adjusted R-squared. A, model 1: adjusted for age, sex, OC, BAP, NTx/Cr, DPD/Cr, 25(OH)D, PTH, leptin, adiponectin, resistin, TSH, T4 and hemoglobin. B, model 2: further adjusted for alcohol use ≥ 3 drinks/week (yes/no), presence of CAD (yes/no), hypertension (yes/no), AF (yes/no), type 2 diabetes mellitus (yes/no), PD (yes/no) and chronic kidney disease (estimated glomerular filtration rate < 60 mL/min/1.73 m2, yes/no).
Age-0.012 (0.017)
Sex (m)0.264 (0.027)0.180 (0.026)
Log OC-0.219 (0.011)-0.176 (0.029)-0.145 (0.016)-0.155 (0.006)-0.109 (0.025)
Log BAP0.595 (< 0.001)0.570 (< 0.001)0.490 (< 0.001)0.496 (< 0.001)
Log NTx/Cr-0.185 (0.002)-0.172 (0.005)
Log 25(OH)D-0.134 (0.015)-0.131 (0.017)
Log PTH0.103 (0.038)
Log Hb-0.897 (0.013)0.393 (< 0.001)0.390 (< 0.001)
Log adiponectin0.228 (0.037)0.215 (0.050)0.130 (0.054)
Log resistin0.043 (0.026)0.439 (0.023)0.119 (0.038)
Alcohol +0.883 (< 0.001)
CAD0.309 (0.023)
AF0.405 (< 0.001)
PD-0.516 (0.007)
R20.25000.27010.04970.07840.23800.23340.11040.11770.06780.1328


Table 4. Multiple Linear Regression Analyses for Bone Turnover Markers in Older Patients With Hip Fracture
 
Log OCLog BAPLog NTx/CrLog DPD/CrOC/BAP ratio
β (P value)β (P value)β (P value)β (P value)β (P value)
Parameters identified as significant and independent predictors of each bone turnover marker are shown. Adjusted for age, sex, GGT, ALT, ALP, albumin, bilirubin, 25(OH)D, PTH, leptin, adiponectin and resistin (all variables were log-transformed). β: β-standardized regression coefficient; GGT: gamma-glutamyltransferase; ALT: alanine aminotransferase; ALP: alkaline phosphatase; OC: osteocalcin; BAP: bone specific alkaline phosphatase; NTx/Cr: cross-linked N-telopeptide of type 1 collagen corrected for urinary creatinine concentration; DPD/Cr: deoxypyridinoline corrected for urinary creatinine concentration.
Age0.017 (0.001)0.033 (< 0.001)
Log GGT-0.141 (0.012)0.111 (0.003)-0.315 (< 0.001)-0.113 (0.043)
Log ALT-0.132 (0.049)
Log ALP0.175 (0.038)0.246 (< 0.001)0.362 (0.008)0.208 (0.008)
Log leptin0.084 (0.014)-0.118 (0.027)-0.069 (0.075)0.013 (0.032)
R20.14980.20430.22250.13500.1155


Table 5. Serum Gamma-Glutamyltransferase Activity (GGT > 20 U/L) as a Predictor of Abnormal Bone Formation Markers in Older Patients With Hip Fracture
 
AdjustmentsOC < 14 ng/mLBAP > 43 U/LOC/BAP ratio < 0.6
OR95% CIP valueOR95% CIP valueOR95% CIP value
GGT: gamma-glutamyltransferase (> 20 U/L, above the level in the first tertile); OC: osteocalcin; BAP: bone specific alkaline phosphatase; CAD: coronary artery disease; DM: diabetes mellitus. *Three or more times a week. +Adjustments for all covariates in the above model. **Adipokines: adiponectin, leptin, resistin.
Unadjusted2.261.32 - 3.870.0034.761.03 - 30.330.0442.621.52 - 4.540.001
+Age, sex2.061.23 - 3.460.0064.420.99 - 19.680.0512.681.58 - 4.54< 0.001
+Alcohol use*2.071.22 - 3.500.0074.881.10 - 21.750.0382.811.64 - 4.82< 0.001
+CAD2.101.23 - 3.570.0065.051.38 - 22.660.0352.791.65 - 4.79< 0.001
+DM2.071.22 - 3.530.0074.811.06 - 21.730.0412.701.57 - 4.66< 0.001
+Adipokines**2.201.22 - 3.940.0087.550.99 - 60.320.0532.291.28 - 4.120.005