Figures
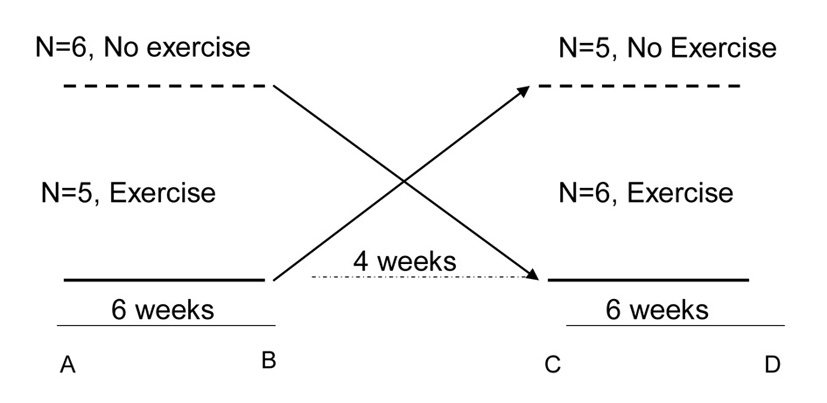
Figure 1. Flow chart of the study of 11 subjects with pre-diabetes. Dashed line: no exercise; solid line: exercise. A to B and C to D, are intervention periods (exercise or no exercise as the case may be) each of 6 weeks with 4 weeks of wash-out (between C to D). Six subjects started in no exercise phase and crossed over to exercise phase and five subjects started in exercise phase and crossed over to no exercise phase with 4 weeks of was-out in between. A, B, C and D were the measurement points for all outcome measures.
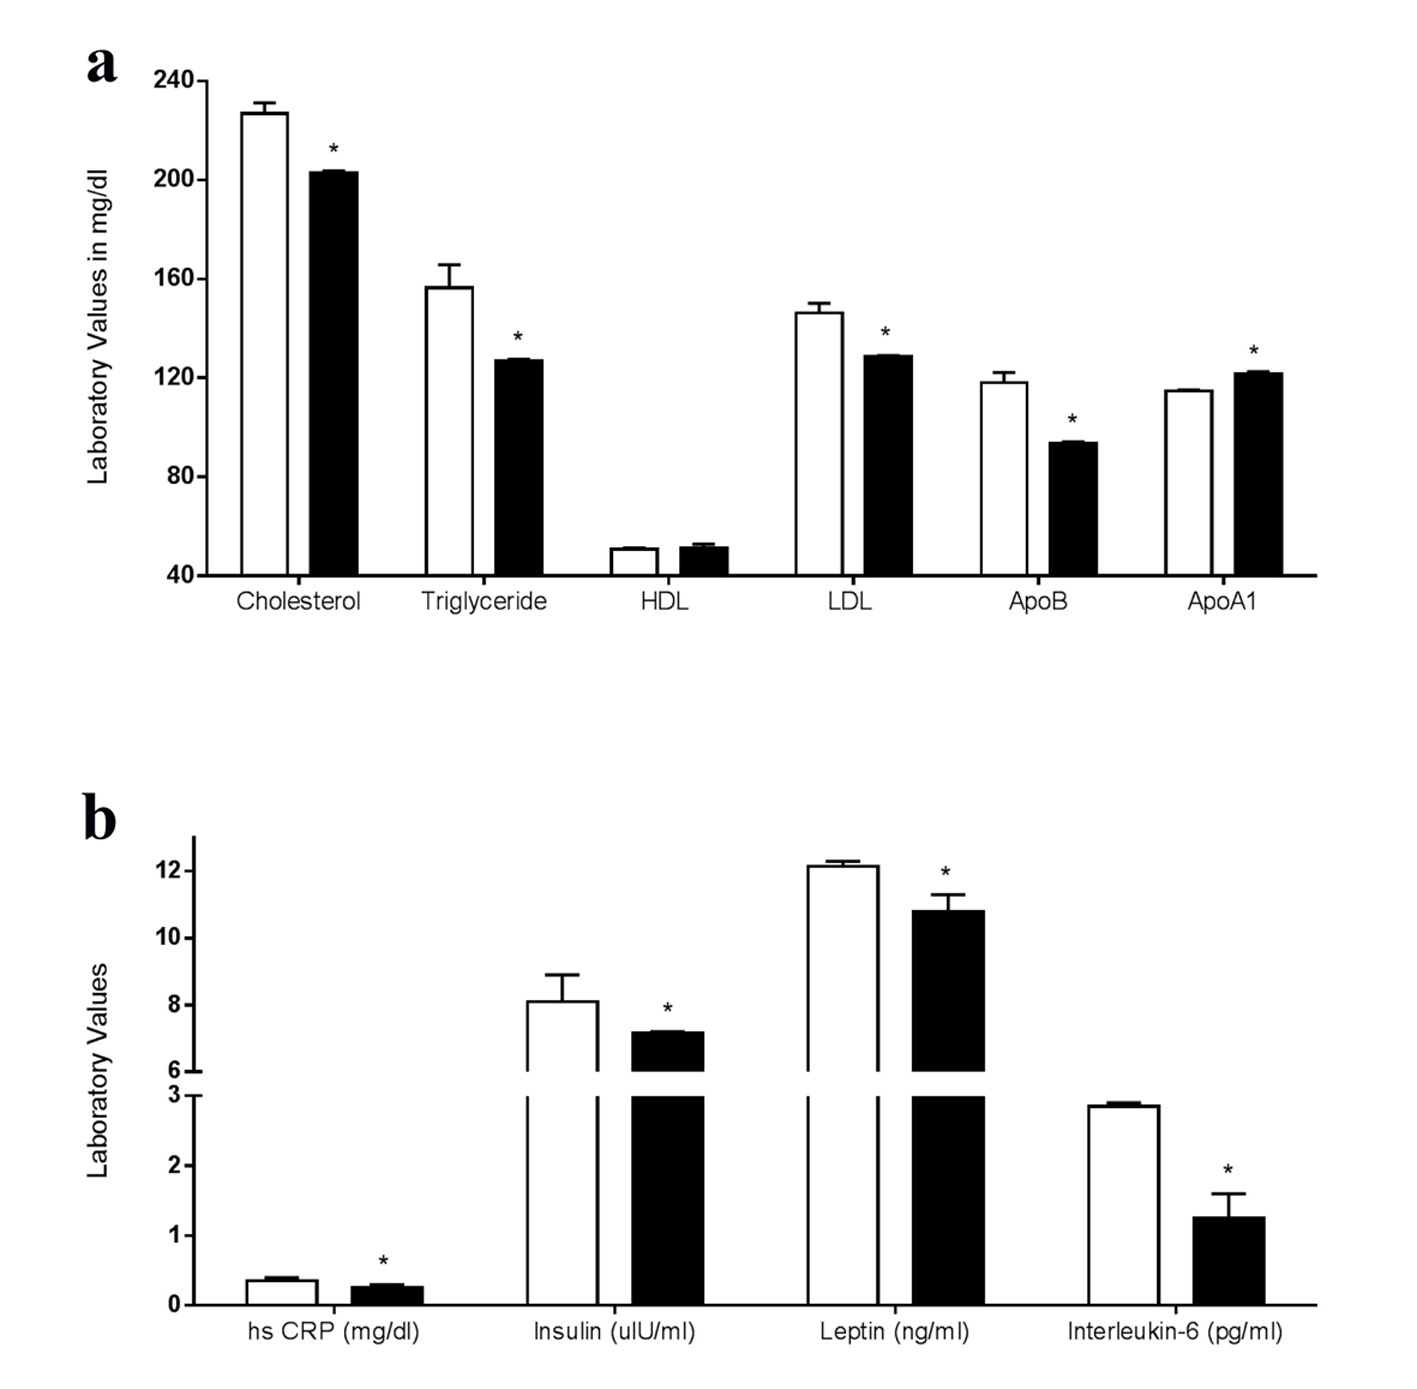
Figure 2. (a) Blood biochemistry and fasting lipid profile of subjects in the non-exercise phase (white bars) and post-exercise phase (black bars). *P < 0.05. (b) Blood biochemistry showing inflammatory markers, fasting insulin and fasting leptin of subjects in the non-exercise phase (white bars) and post-exercise phase (black bars). *P < 0.05.
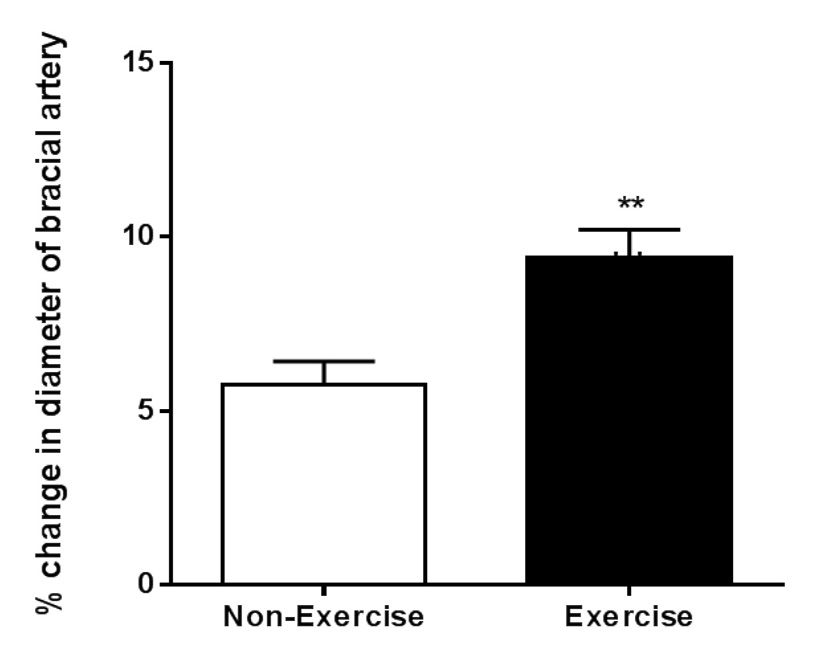
Figure 3. Brachial artery flow mediated dilatation in the non-dominant arm during the non- exercise (white bar) and post exercise (black bar) phase. **P = 0.0013.
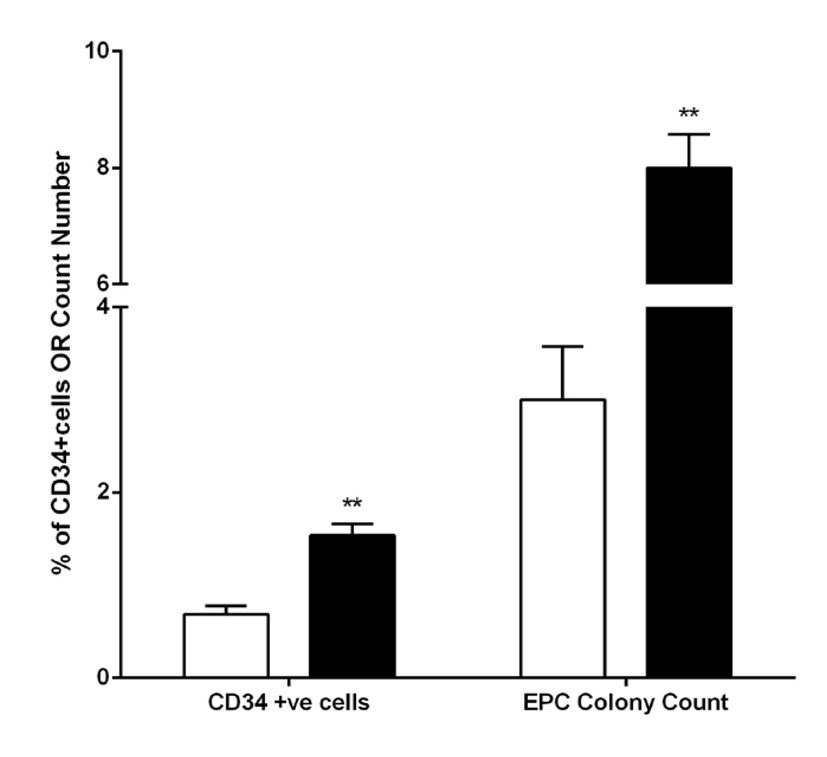
Figure 4. CD34+ cell number and CFU-Hill colony counts in the sedentary phase (white bars) and post exercise phase (black bars). **P < 0.005.
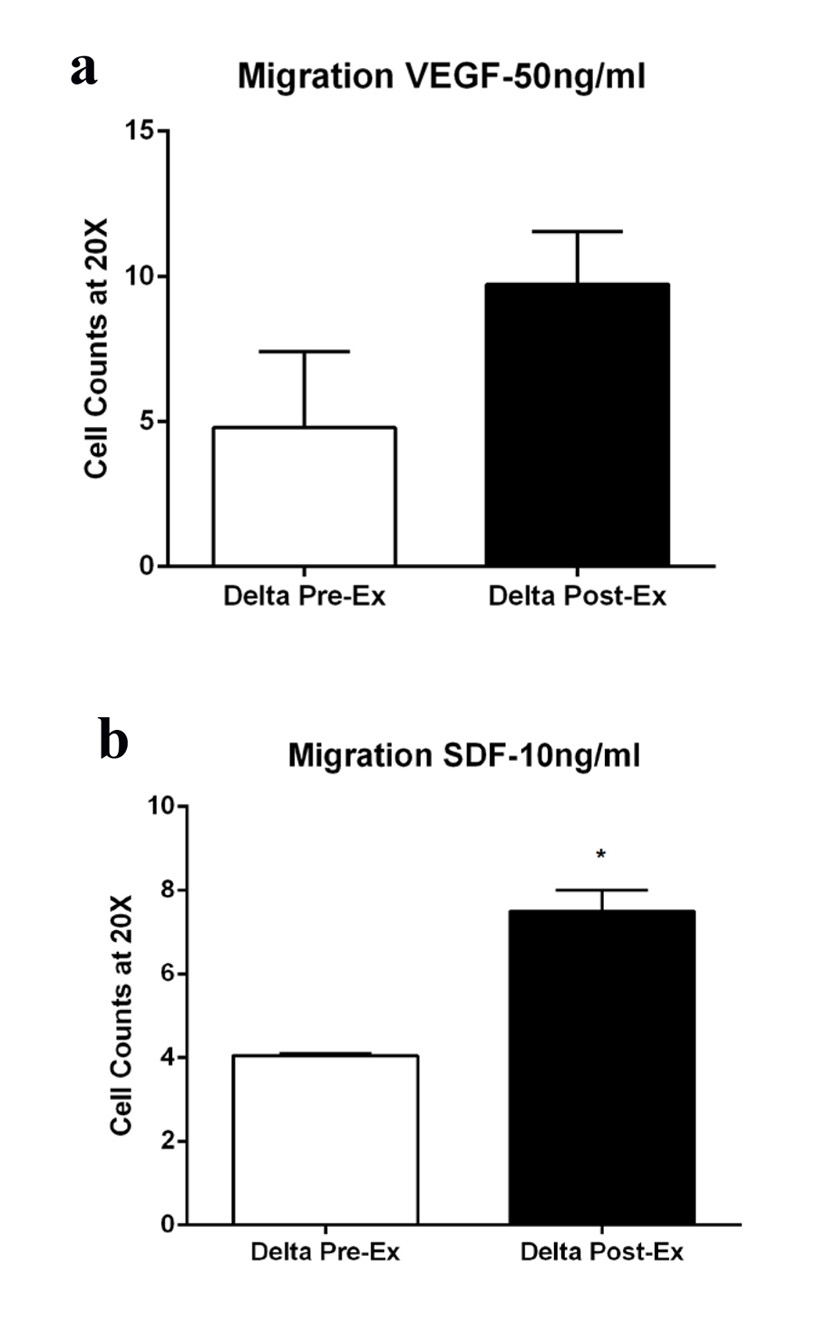
Figure 5. Migration of CD34+ cells in response to (a) VEGF-A (50 ng/mL), P = 0.1841 and (b) SDF-1 alpha (10 ng/mL), P = 0.0206 before (white bars) and after (black bars) exercise. Migration assay using VEGF-A as a chemotactic factor did not reach statistical significance.
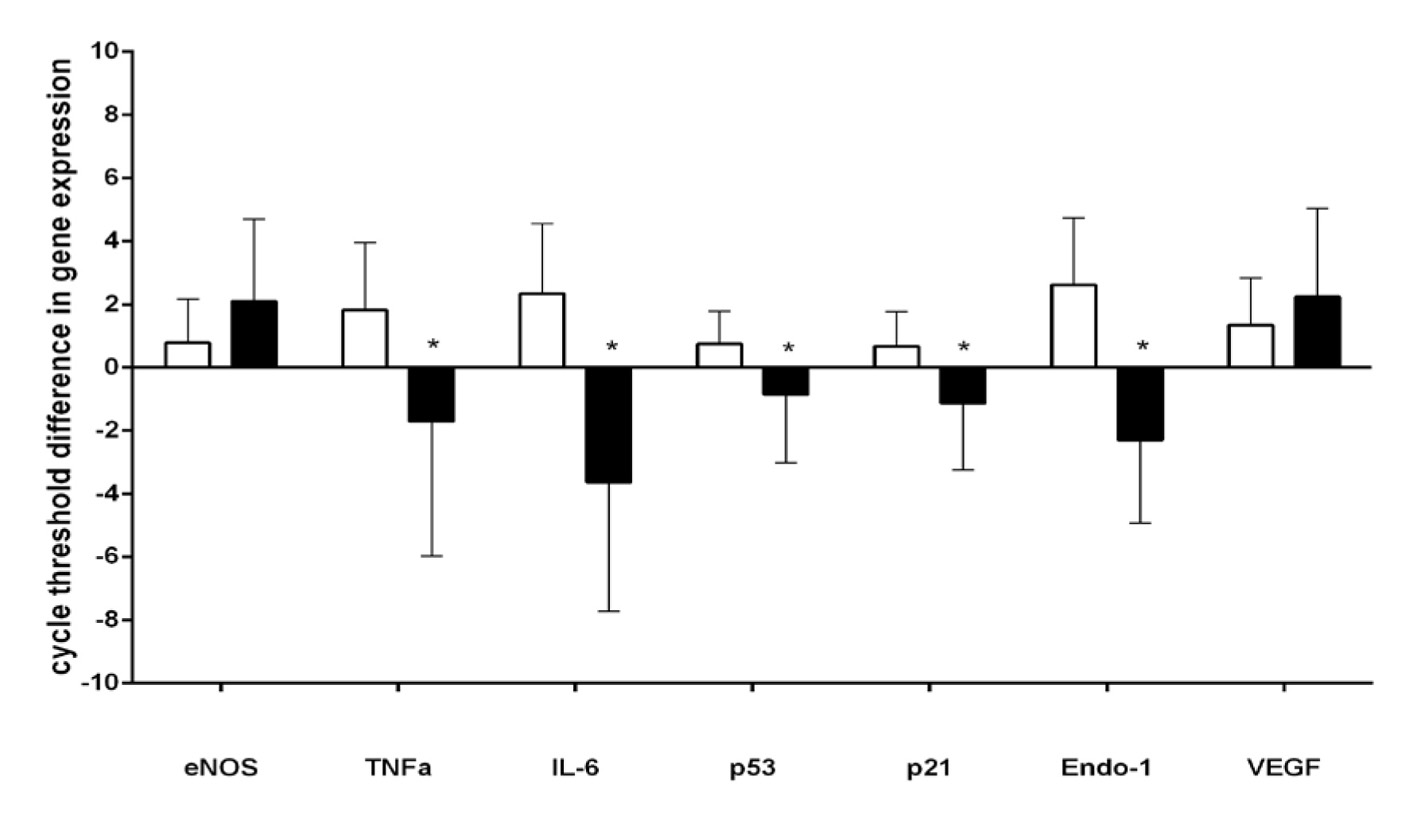
Figure 6. CD34+ gene expression before (white bars) and after (black bars) exercise. *P < 0.05.
Tables
Table 1. Patient Characteristics (n = 11)
| No exercise (mean ± SEM) | Exercise (mean ± SEM) |
|---|
| Age | 54 ± 8 | 55 ± 8 |
| BMI | 29.4 ± 5.0 | 29.3 ± 5.2 |
| BMR | 6,520.0 ± 887.8 | 6,518.7 ± 885.2 |
| Fat % | 36.4 ± 10.7 | 36.6 ± 10.9 |
| Fat mass | 68.9 ± 28.1 | 68.2 ± 28.9 |
| Fat free mass | 113.4 ± 19.6 | 113.8 ± 19.6 |
| HbA1C (%) | 5.9 ± 0.3 | 5.8 ± 0.2 |
| SBP | 128.5 ± 10.4 | 127.7 ± 10.6 |
| DBP | 76.5 ± 6.9 | 75.8 ± 9.1 |
Table 2. Physical Activity (n = 11)
| Phase | No exercise (mean ± SEM) | Exercise (mean ± SEM) | P-value |
|---|
| Physical activity (min/day) measured via actigraph, cut points from Freedson et al [19]. MVPA: moderate to vigorous physical activity. |
| Sedentary | 520 ± 16 | 496 ± 17 | 0.003 |
| Light | 230 ± 14 | 236 ± 13 | 0.19 |
| Lifestyle | 78 ± 9 | 87 ± 9 | 0.06 |
| Moderate | 22 ± 5 | 26 ± 5 | 0.22 |
| Vigorous | 0.3 ± 0.2 | 0.3 ± 0.3 | 0.88 |
| MVPA | 22 ± 5 | 27 ± 5 | 0.22 |
| All activity | 330 ± 23 | 350 ± 21 | 0.02 |