| Upregulated transcripts | | | | |
| MYO10 | Myosin X | 2.3 | 1.1 × 10⁻⁴ | 3.8 × 10⁻² |
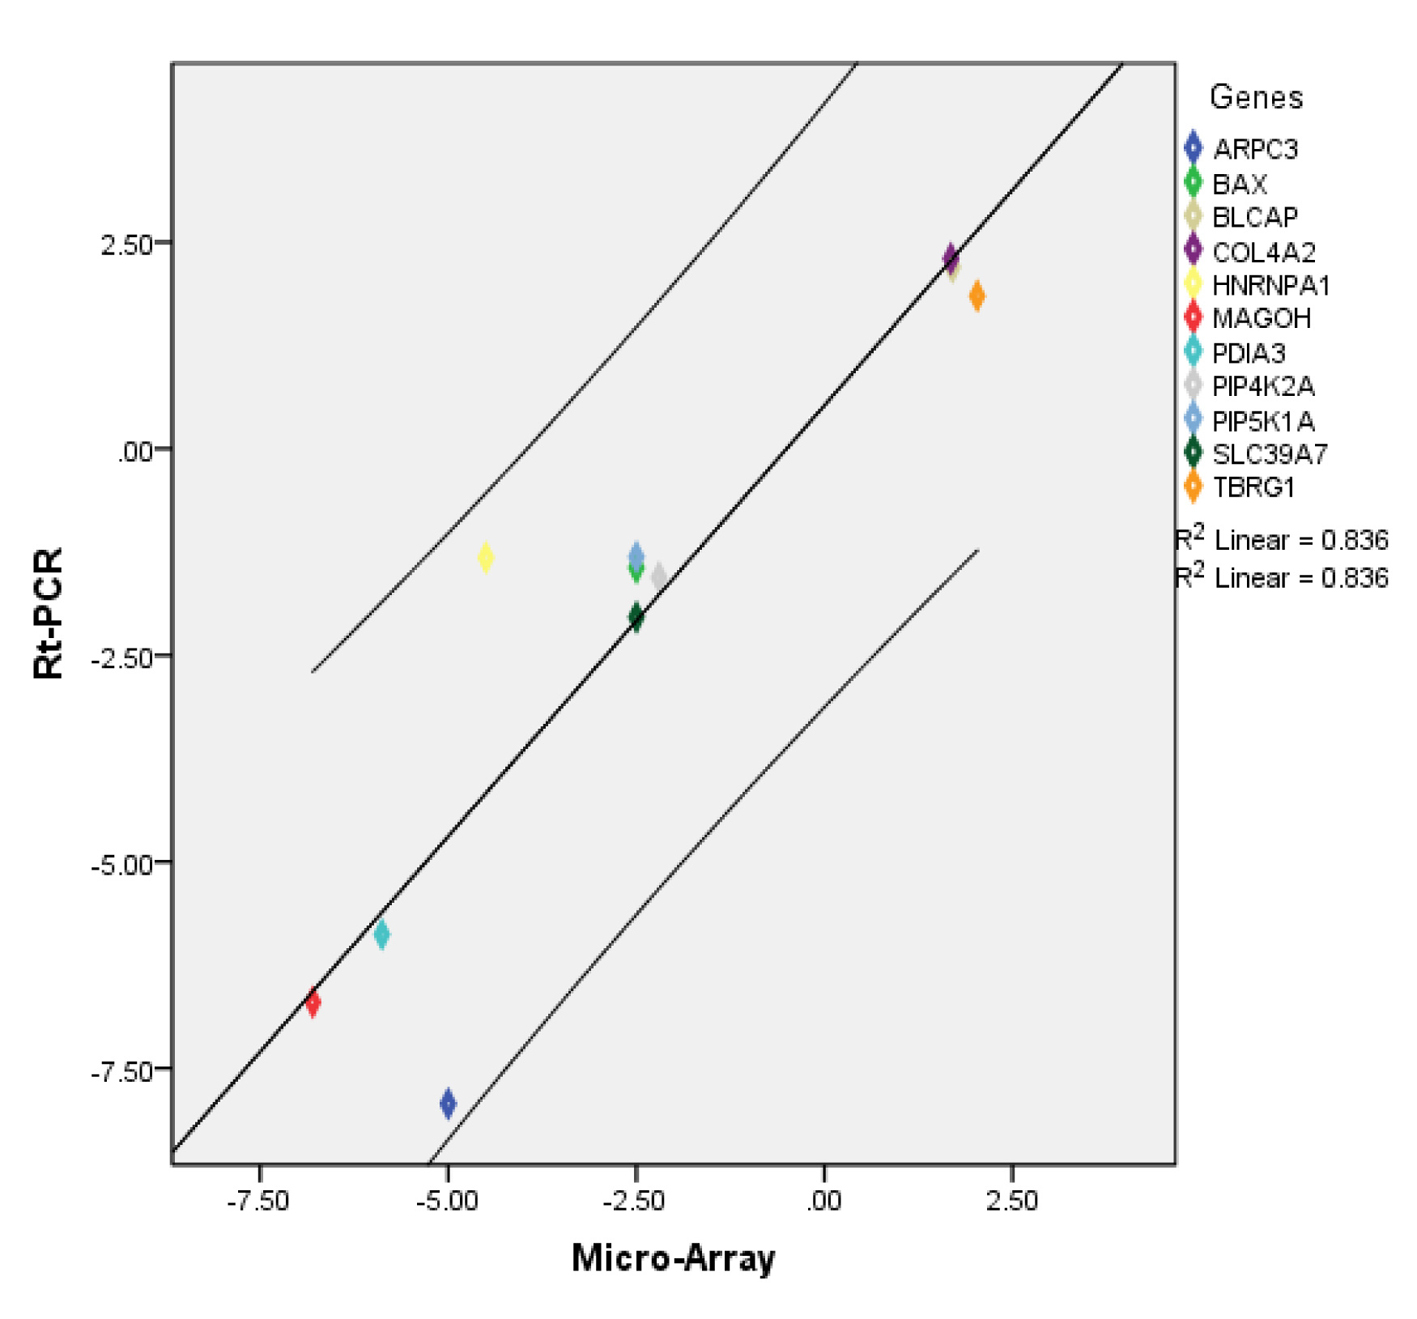
| TBRG1 | Transforming growth factor beta regulator 1 | 2.0 | 1.8 × 10⁻⁴ | 4.9 × 10⁻² |
| Downregulated transcripts | | | | |
| MALAT1 | Metastasis associated lung adenocarcinoma transcript 1 (non-protein coding) | -9.8 | 1.4 × 10⁻⁷ | 4.9 × 10⁻⁴ |
| MAGOH | Proliferation-associated (Drosophila) | -6.8 | 3.6 × 10⁻⁵ | 1.9 × 10⁻² |
| NR1D2 | Nuclear receptor subfamily 1, group D, member 2 | -6.5 | 1.1 × 10⁻⁵ | 9.3 × 10⁻³ |
| HIRA | Histone cell cycle regulator | -6.5 | 3.0 × 10⁻⁸ | 1.8 × 10⁻⁴ |
| PDIA3 | Protein disulfide isomerase family A, member 3 | -5.8 | 1.5 × 10⁻⁷ | 4.9 × 10⁻⁴ |
| ARPC3 | Actin related protein 2/3 complex, subunit 3, 21 kDa | -5.0 | 1.0 × 10⁻⁸ | 1.6 × 10⁻⁴ |
| HNRNPA1 | Heterogeneous nuclear ribonucleoprotein A1 | -4.5 | 1.1 × 10⁻⁴ | 3.8 × 10⁻² |
| HIVEP2 | Human immunodeficiency virus type I enhancer binding protein 2 | -4.4 | 3.7 × 10⁻⁵ | 1.9 × 10⁻² |
| NBPF10 | Neuroblastoma breakpoint family member 21-like | -4.4 | 2.4 × 10⁻⁶ | 3.4 × 10⁻³ |
| NUCKS1 | Nuclear casein kinase and cyclin-dependent kinase substrate 1 | -4.1 | 5.7 × 10⁻⁵ | 2.6 × 10⁻² |