Journal of Endocrinology and Metabolism, ISSN 1923-2861 print, 1923-287X online, Open Access
Article copyright, the authors; Journal compilation copyright, J Endocrinol Metab and Elmer Press Inc
Journal website http://www.jofem.org

Original Article

Volume 5, Number 4, August 2015, pages 245-249


Effects of Sitagliptin on Pancreatic β Cell Function and Microangiopathy in Japanese Patients With Type 2 Diabetes Mellitus: Follow-Up for 4 Years

Figure

Figure 1.
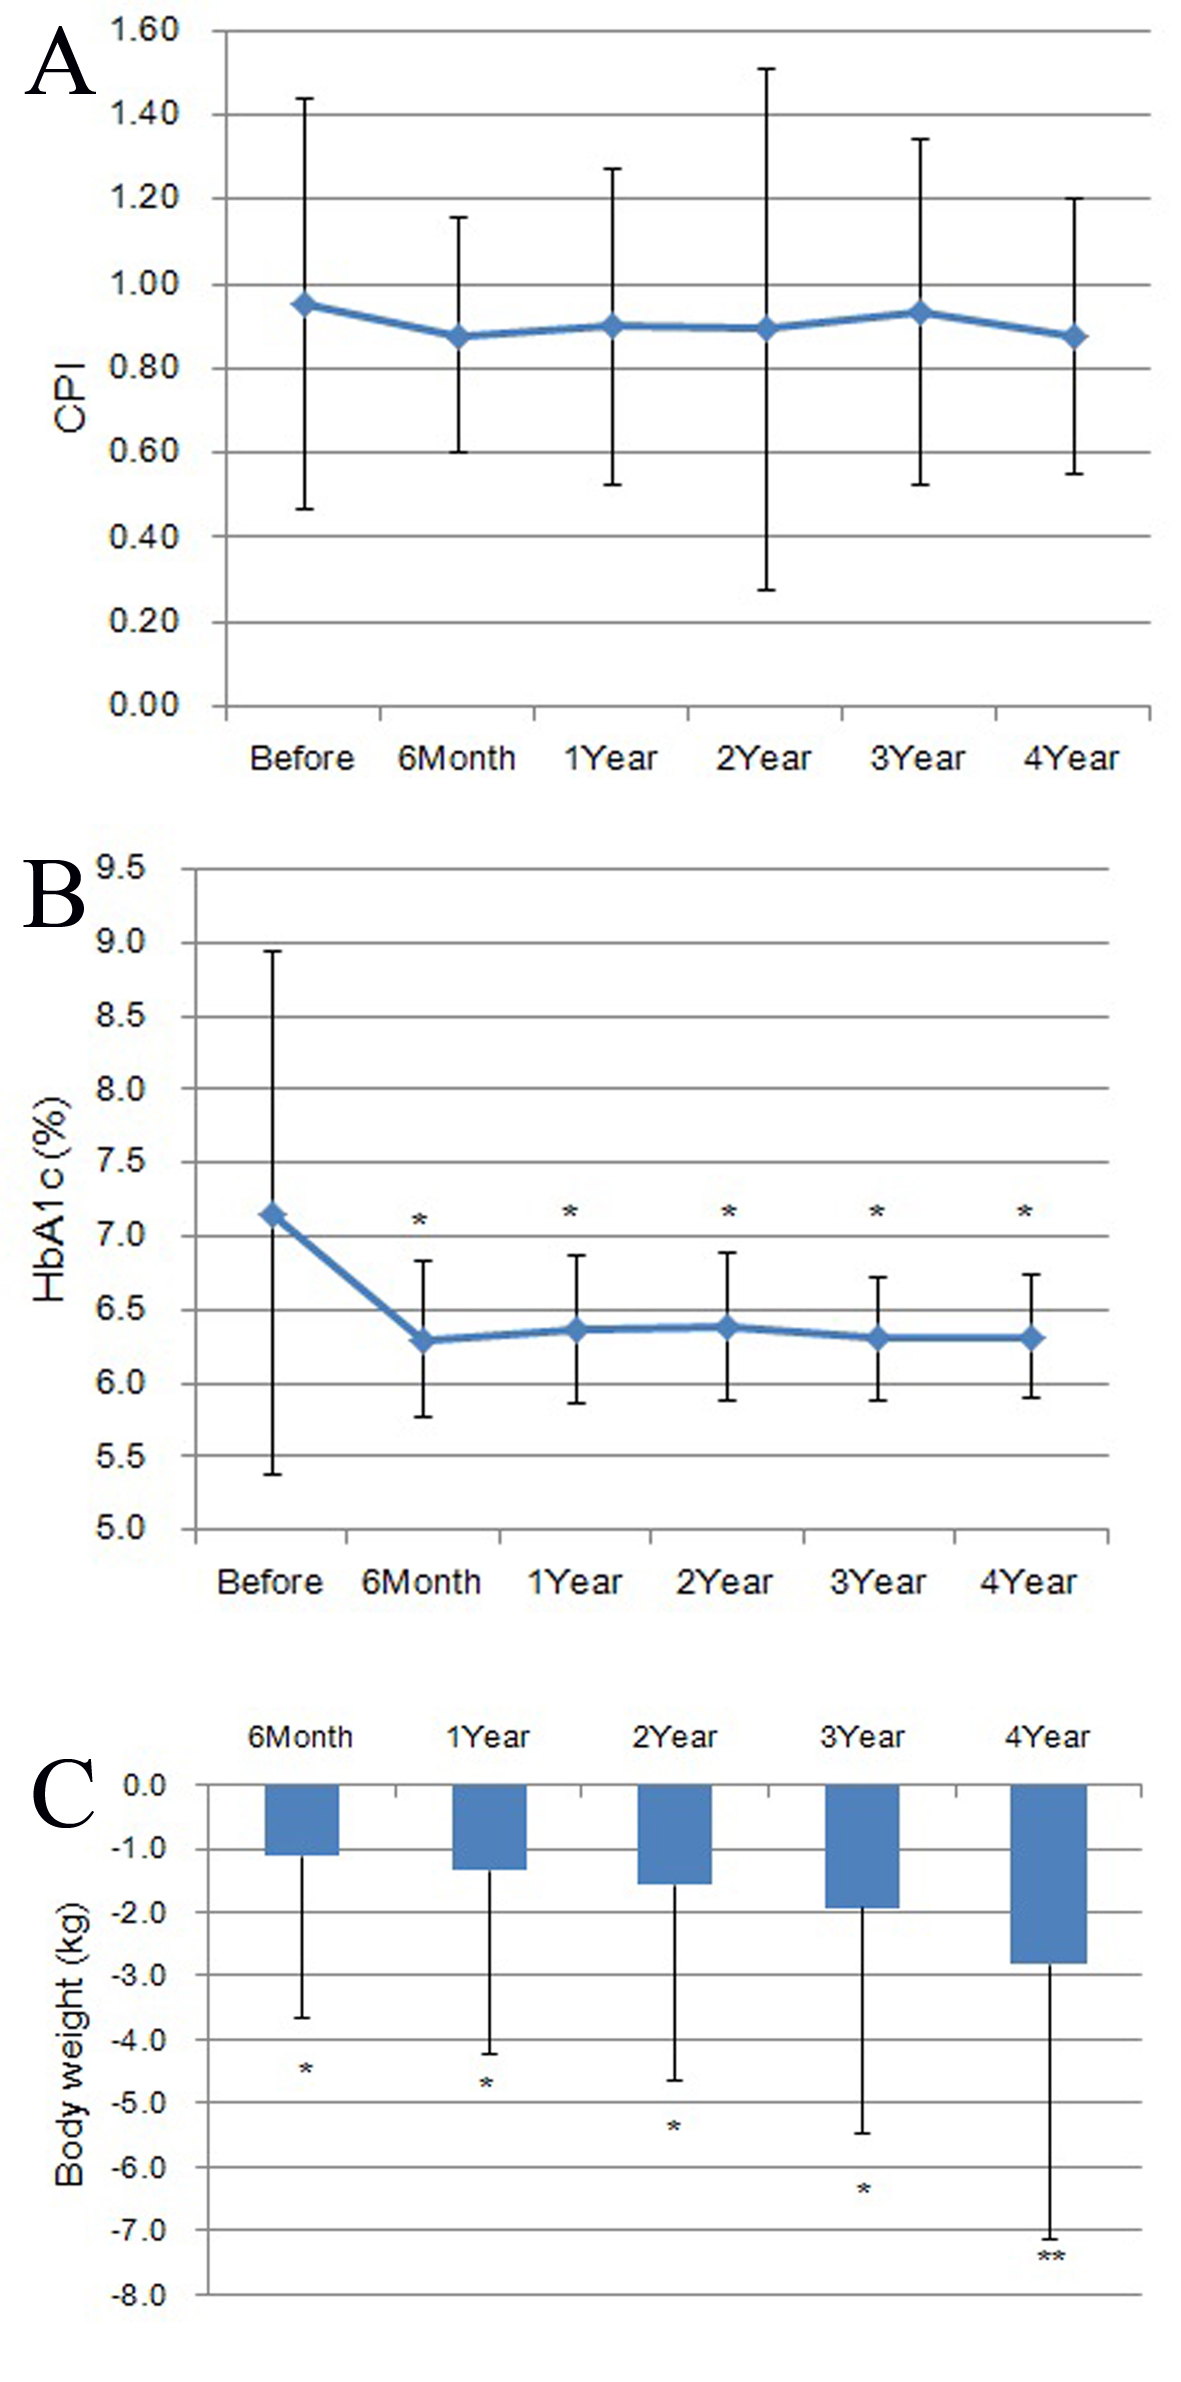
Figure 1. Changes in CPI (A), HbA1c (B), and body weight (C) during the treatment for 4 years. (A) CPI showed no significant change from the pre-treatment level at any point of time after the start of sitagliptin treatment. (B) HbA1c decreased significantly at 6 months and remained reduced thereafter until 4 years. (C) Body weight decreased significantly at 6 months and continued to decrease thereafter until 4 years.

Tables

Table 1. Baseline Characteristics
 
Characteristic
Data are means ± SD or n (%). NDR: no diabetic retinopathy; SDR: simple diabetic retinopathy; PPDR: pre-proliferative diabetic retinopathy; PDR: proliferative diabetic retinopathy. Stage 1: normoalbuminuria. Stage 2: microalbuminuria. Stage 3: macroalbuminuria. Stage 4: renal insufficiency.
Patients, n27
Age, years (mean ± SD)63.3 ± 9.2
Male, n (%)20 (74)
Duration of diabetes, n (%)
  < 5 years6 (16)
  5 - 9 years9 (33)
  10 - 19 years7 (26)
  ≥ 20 years3 (11)
  Unknown2 (7)
BMI, kg/m2 (mean ± SD)22.9 ± 3.0
HbA1c (%) (mean ± SD)7.2 ± 1.8
CPI (mean ± SD)0.95 ± 0.49
Diabetic retinopathy, n (%)
  NDR15 (56)
  SDR8 (30)
  PPDR2 (7)
  PDR0 (0)
  Unknown2 (7)
Diabetic nephropathy, n (%)
  Stage 119 (70)
  Stage 27 (26)
  Stage 31 (4)
  Stage 40 (0)
Diabetes treatment, n (%)
  None19 (70)
  Insulin3 (11)
  Sulfonylureas9 (33)
  Glinides13 (48)
  Biguanides7 (26)
  Thiazolidinediones8 (30)
  α-Glucosidase inhibitors14 (52)


Table 2. Changes in Retinopathy and Nephropathy After the 4-Year Treatment Period
 
n (%)
Data are n (%). Frequency of outcomes of retinopathy: no change > worse > improve (A). Frequency of outcomes of nephropathy: no change > improve > worse (B).
A. Retinopathy (n = 24)
  Improve1 (4)
  No change16 (67)
  Worse7 (29)
B. Nephropathy (n = 27)
  Improve4 (15)
  No change20 (74)
  Worse3 (11)