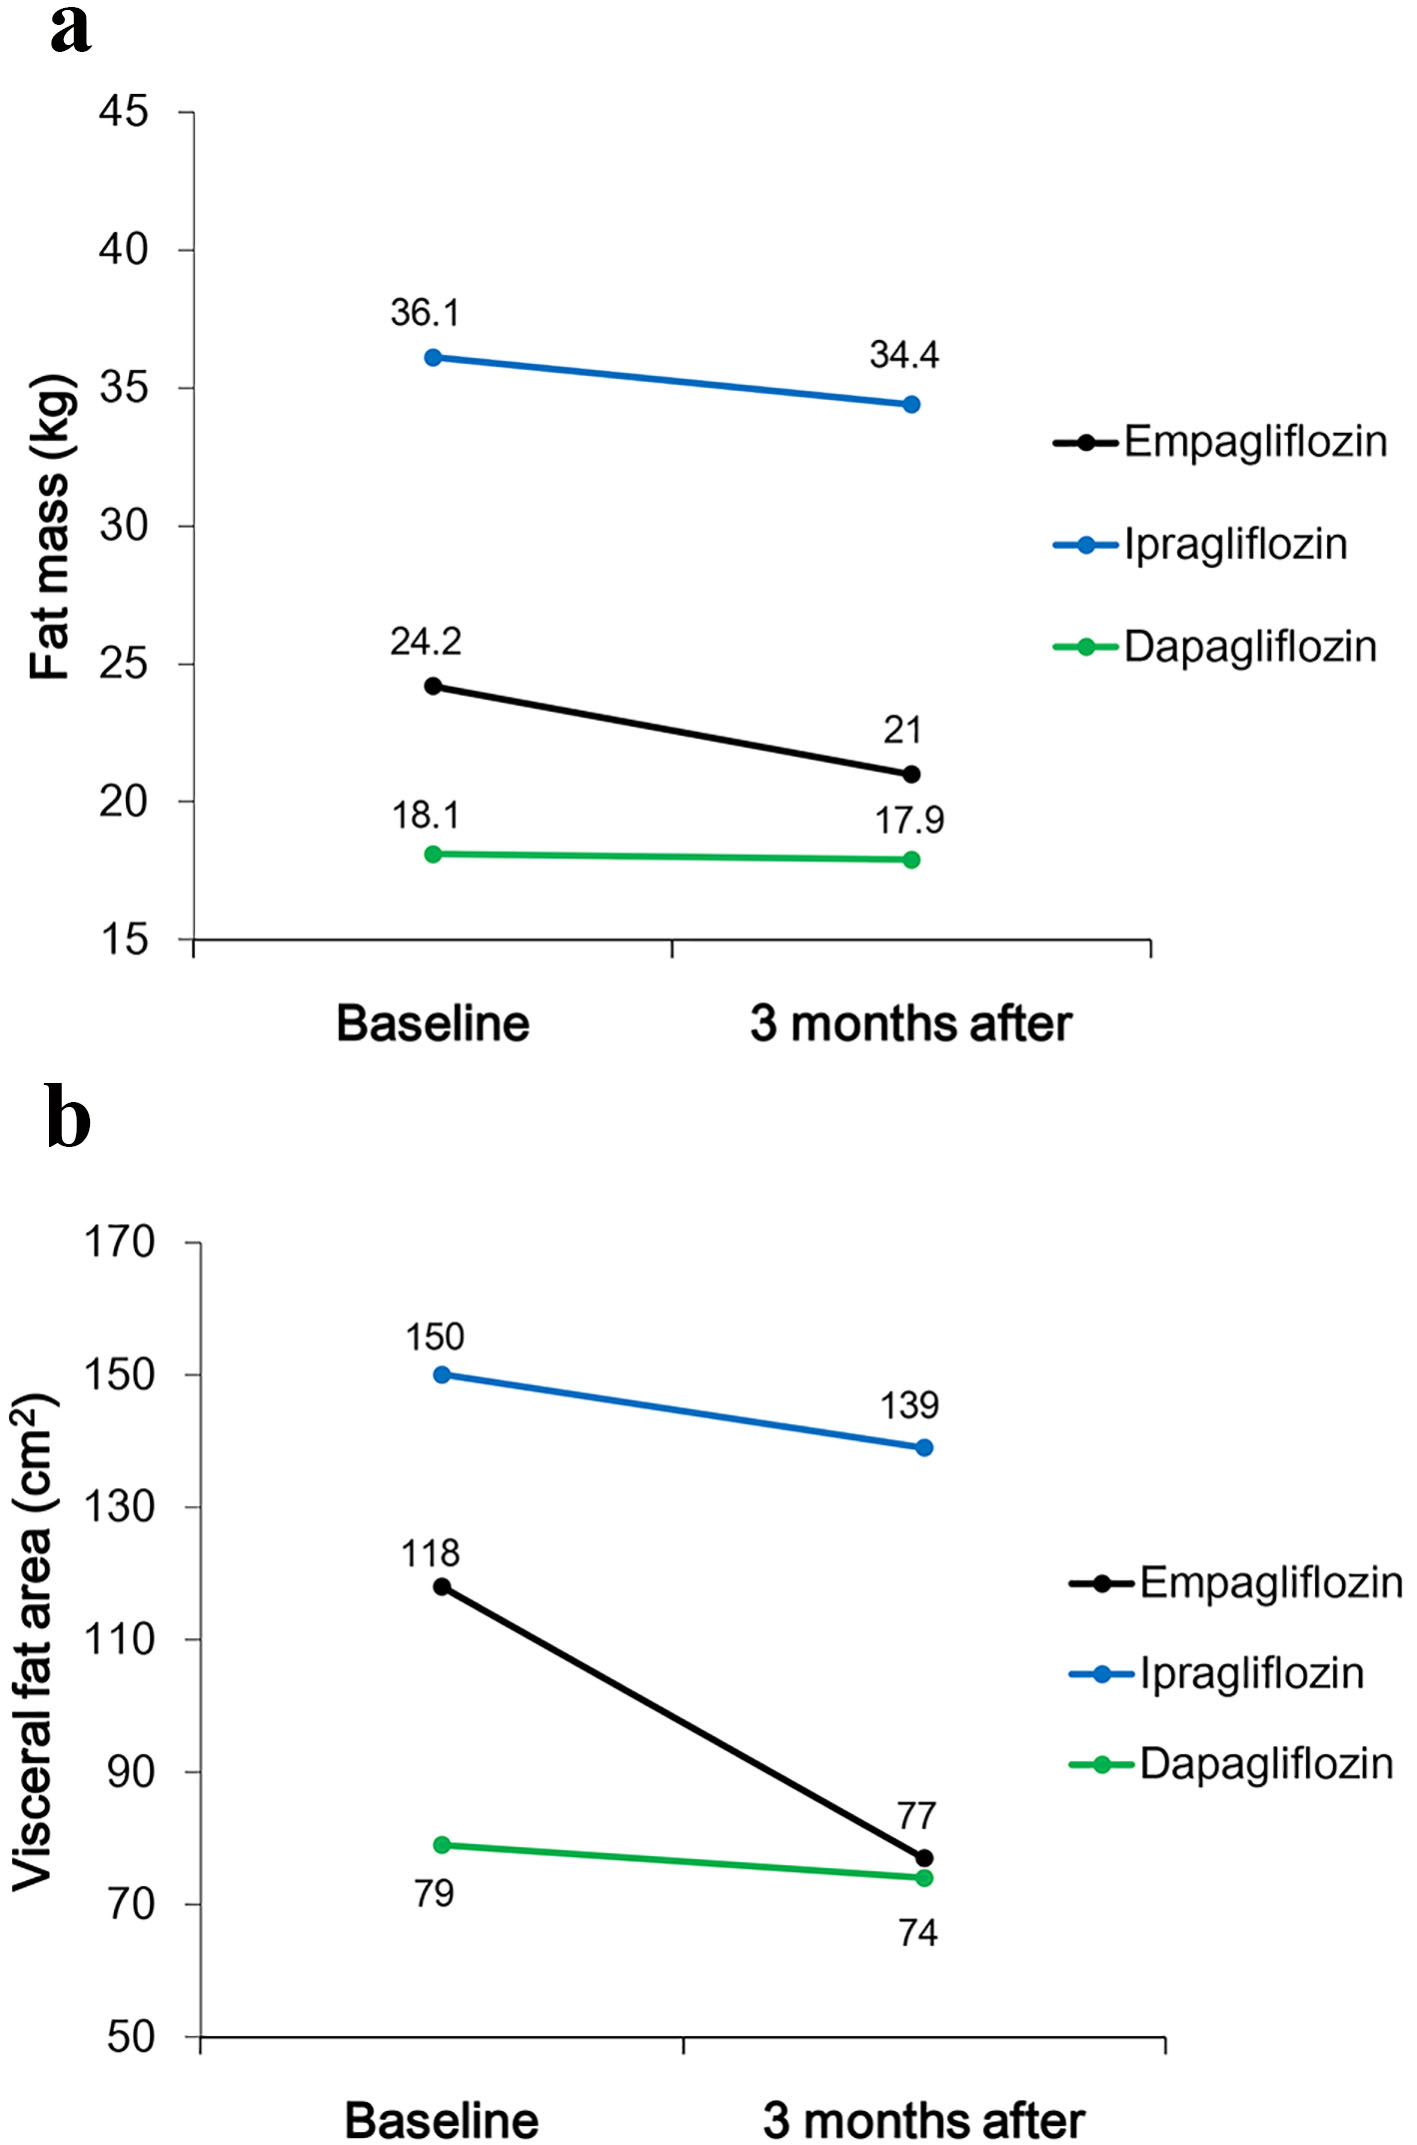
Figure 1. Changes in (a) fat mass and (b) visceral fat area (VFA) between baseline and 3 months after starting treatment with SGLT2 inhibitors.
| Journal of Endocrinology and Metabolism, ISSN 1923-2861 print, 1923-287X online, Open Access |
| Article copyright, the authors; Journal compilation copyright, J Endocrinol Metab and Elmer Press Inc |
| Journal website http://www.jofem.org |
Original Article
Volume 6, Number 1, February 2016, pages 12-17
Plasma B-Type Natriuretic Peptide Levels May Increase Because of Fat Mass Loss by Metformin or Sodium-Glucose Transporter 2 Inhibitors Treatment
Figure
Tables
| Baseline | After 3 months | After 6 months | P value (baseline vs. after 3 months) | P value (after 3 months vs. after 6 months) | P value (baseline vs. after 6 months) | |
|---|---|---|---|---|---|---|
| Data are expressed as mean ± SD. BNP: B-type natriuretic peptide; BMI: body mass index. | ||||||
| n (men/women) | 15 (7/8) | - | - | - | - | - |
| Age (years) | 54.9 ± 14 | - | - | - | - | - |
| Weight (kg) | 74.5 ± 15.6 | 68.6 ± 13.1 | 70.6 ± 14.6 | 0.068 | 0.114 | 0.043 |
| BMI (kg/m2) | 27.6 ± 6.2 | 26.4 ± 6 | 26.0 ± 5.7 | 0.068 | 0.144 | 0.043 |
| Plasma glucose (mg/dL) | 161.1 ± 59.4 | 133.9 ± 40.6 | 131.3 ± 44.7 | 0.074 | 0.754 | 0.078 |
| HbA1c (%) | 7.4 ± 1.2 | 6.7 ± 0.4 | 6.7 ± 0.5 | 0.001 | 0.886 | 0.004 |
| Plasma BNP (pg/mL) | 7.9 ± 7.9 | 17 ± 16.9 | 10.5 ± 8.5 | 0.012 | 0.272 | 0.109 |
| Serum insulin | 9.4 ± 5.2 | - | 6.6 ± 3.8 | - | - | 0.075 |
| Skeletal muscle mass (kg) | 26.7 ± 4.1 | 25.8 ± 4.3 | 26.7 ± 4.3 | 0.293 | 0.080 | 0.893 |
| Fat mass (kg) | 25.7 ± 10.3 | 23 ± 11.4 | 22.1 ± 11 | 0.046 | 0.144 | 0.043 |
| Baseline characteristics | |
|---|---|
| Data are expressed as number or mean ± SD. SGLT2: sodium-glucose transporter 2; DPP4: dipeptidyl peptidase 4. | |
| n | 7 |
| Sex (men/women) | 3/4 |
| Age (years) | 52.1 ± 10.8 |
| Duration of diabetes (years) | 5.6 ± 5.5 |
| Medication | |
| Metformin | 6 |
| Pioglitazone | 2 |
| DPP4 inhibitors | 3 |
| Sulfonylurea | 1 |
| Insulin | 1 |
| Baseline | After 3 months | P value | |
|---|---|---|---|
| Data are expressed as mean ± SD. BNP: B-type natriuretic peptide; BMI: body mass index. | |||
| n (men/women) | 7 (3/4) | - | - |
| Weight (kg) | 85.4 ± 20.1 | 83.7 ± 20.3 | 0.063 |
| BMI (kg/m2) | 32.3 ± 6.7 | 31.6 ± 6.6 | 0.063 |
| Plasma glucose (mg/dL) | 151.0 ± 64.5 | 124.7 ± 24.2 | 0.108 |
| HbA1c (%) | 7.9 ± 1.9 | 7.2 ± 1.1 | 0.018 |
| Plasma BNP (pg/mL) | 8.8 ± 7.2 | 15.5 ± 14.3 | 0.018 |
| Serum insulin | 14.0 ± 5.8 | 11.5 ± 3.3 | 0.080 |