Journal of Endocrinology and Metabolism, ISSN 1923-2861 print, 1923-287X online, Open Access
Article copyright, the authors; Journal compilation copyright, J Endocrinol Metab and Elmer Press Inc
Journal website http://www.jofem.org

Original Article

Volume 7, Number 6, December 2017, pages 172-177


The Impact of Vitamin D Status on Preoperative Ultrasound Findings and Parathyroidectomy Outcomes in Patients With Primary Hyperparathyroidism

Figure

Figure 1.
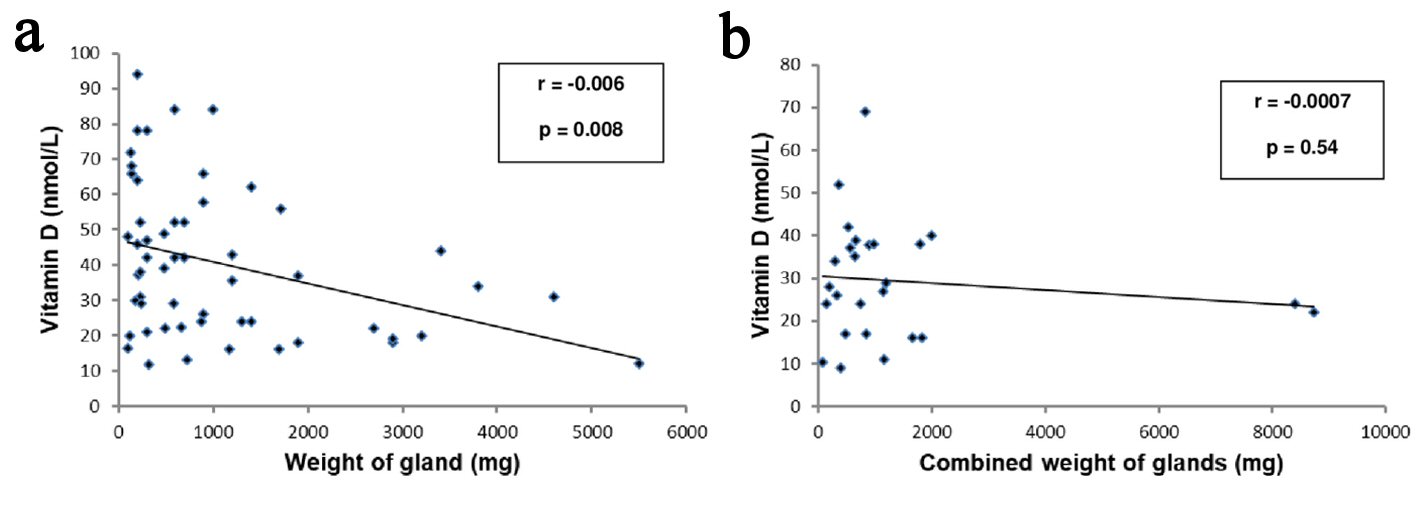
Figure 1. (a) Regression analysis with vitamin D as dependent variable with weight of parathyroid gland in patients with single gland disease. (b) Regression analysis with vitamin D as dependent variable with combined weight of parathyroid glands in patients with multiple gland disease.

Tables

Table 1. Patient Demographics and Biochemical Parameters Before and After Parathyroidectomy
 
VariablePre-operativePost-operativeP value
All data expressed as mean ± standard deviation.
Age (years)64.2 ± 11.7-
Sex (M/F)16/65-
Duration of stay (days)4.3 ± 2.9-
Parathormone (pmol/L)15.2 ± 10.95.6 ± 2.4< 0.00001
Calcium (mmol/L)2.8 ± 0.22.3 ± 0.2< 0.00001
Adjusted calcium (mmol/L)2.9 ± 0.22.4 ± 0.1< 0.00001
Phosphate (mmol/L)0.8 ± 0.21.1 ± 0.2< 0.00001
Alkaline phosphatase (U/L)105.9 ± 42.888.3 ± 29.5< 0.00001
Creatinine (µmol/L)74.2 ± 21.976.6 ± 24.30.01
eGFR (mL/min/1.73 m2)75.4 ± 13.476.2 ± 14.60.24
TSH (mU/L)1.8 ± 1.1-
FT4 (pmol/L)15.3 ± 2.6-
Vitamin D (nmol/L)36.9 ± 19.7-


Table 2. Characteristics of Gland Involvement by Ultrasonography as per Vitamin D Status
 
Vitamin D status (nmol/L)< 30 (deficient), n = 36≥ 30 and < 50 (insufficient), n = 27≥ 50 (sufficient), n = 18
Single gland disease (SGD)
  Right superior gland1 (2.8%)1 (3.7%)1 (5.5%)
  Left superior gland0 (0.0%)2 (7.4%)0 (0.0%)
  Right inferior gland7 (19.4%)4 (14.8%)8 (44.5%)
  Left inferior gland12 (33.4%)8 (29.6%)1 (5.5%)
  No gland involvement16 (44.4%)12 (44.5%)8 (44.5%)
Multiple gland disease (MGD)000


Table 3. Relationship Between Ultrasound Findings and Histology as per Vitamin D Status
 
Diagnosis testHistologySensitivitySpecificityPPVNPV
PositiveNegative
All value in brackets are expressed as percentages.
All patientsUSSPositive45 (55.5)0 (0)58.4%100%100%11.1%
Negative32 (39.5)4 (5.0)
Vitamin D
  DeficientUSSPositive20 (55.5)0 (0)57.1%100%100%6.2%
Negative15 (41.7)1 (2.8)
  InsufficientUSSPositive15 (55.5)0 (0)62.5%100%100%25.0%
Negative9 (33.3)3 (11.2)
  SufficientUSSPositive10 (55.5)0 (0)55.8%100%100%12.5%
Negative7 (38.9)1 (5.6)


Table 4. Post Parathyroidectomy Findings According to Vitamin D Status
 
Vitamin D status (nmol/L)< 30 (deficient), n = 36≥ 30 and < 50 (insufficient), n = 27≥ 50 (sufficient), n = 18P value
Single gland removed211816
  Weight of gland (g)1.42 ± 1.351.11 ± 1.390.58 ± 0.480.10
  Histology
  Benign adenoma15 (71.4%)14 (77.8%)14 (87.5%)
  Chief cell adenoma6 (28.6%)1 (5.5%)0 (0%)
  Others (normal, hyperplasia)0 (0%)3 (16.7%)2 (12.5%)
Multiple gland removed1592
  Combined weight of glands (g)1.81 ± 2.790.93 ± 0.580.59 ± 0.330.55
  Mean number of gland excised2.46 ± 1.002.55 ± 1.003.50 ± 0.700.28
  Histology
  Benign adenoma14 (93.3%)6 (66.7%)2 (100%)
  Chief cell adenoma0 (0%)0 (0%)0 (0%)
  Others (normal, hyperplasia)1 (6.7%)3 (33.3%)0 (0%)