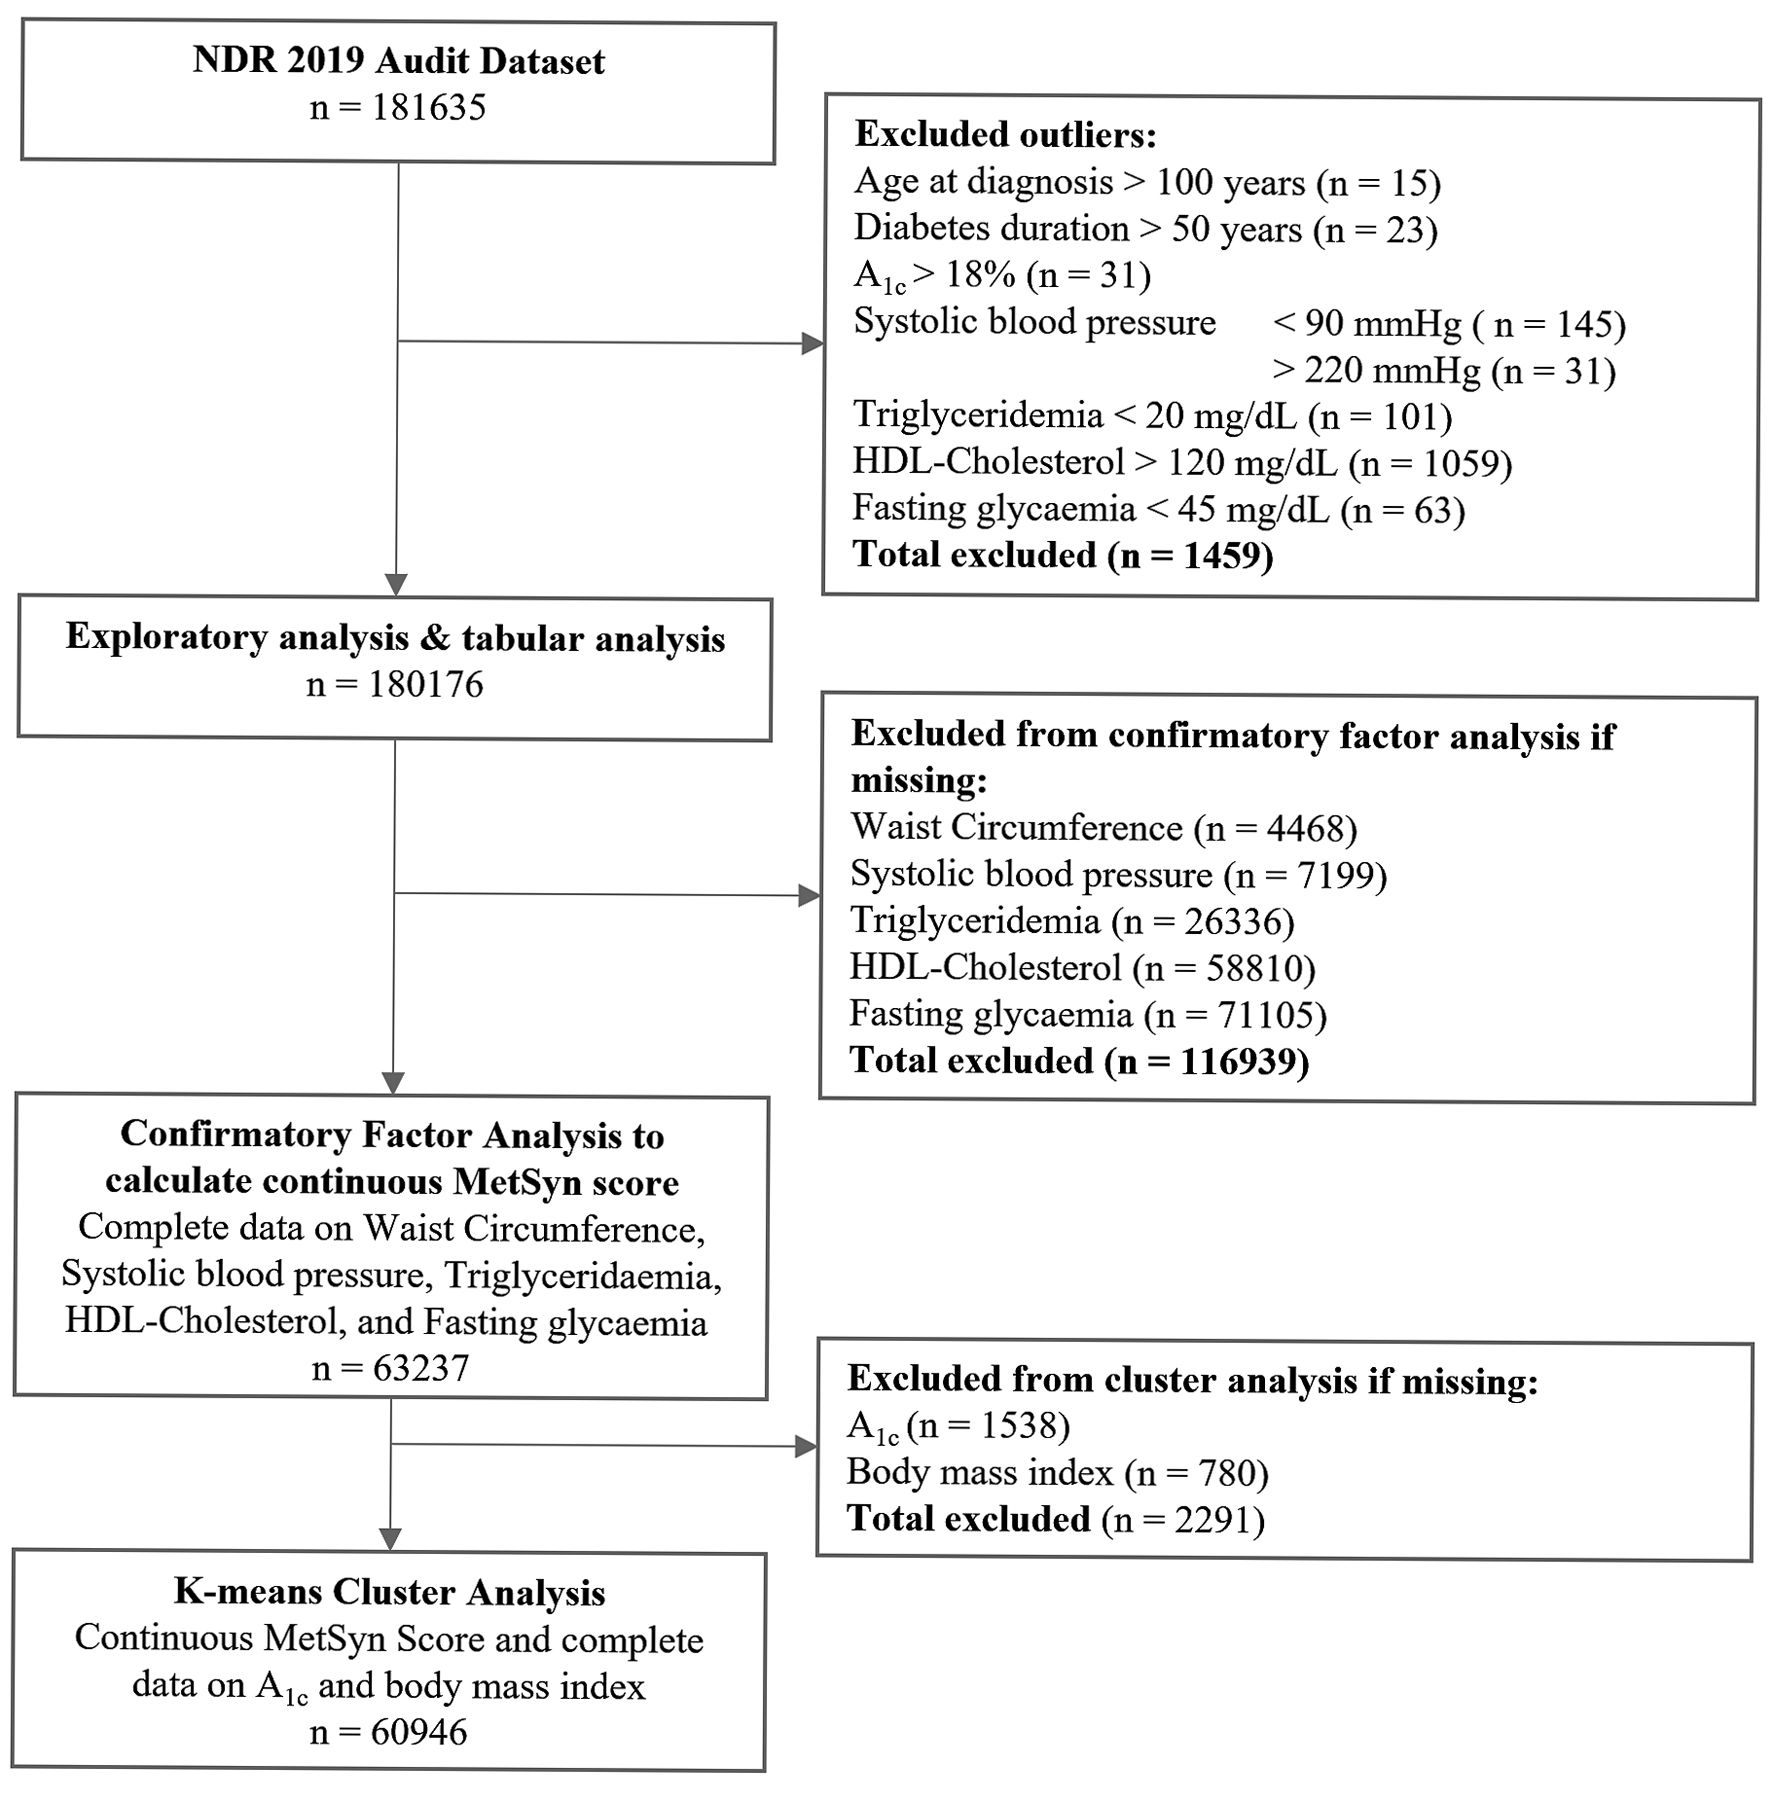
Figure 1. Study flow diagram.
| Journal of Endocrinology and Metabolism, ISSN 1923-2861 print, 1923-287X online, Open Access |
| Article copyright, the authors; Journal compilation copyright, J Endocrinol Metab and Elmer Press Inc |
| Journal website https://www.jofem.org |
Original Article
Volume 14, Number 1, February 2024, pages 1-12
Associations Between Type 2 Diabetes Subtypes and Complications: Analysis of the Malaysia National Diabetes Registry
Figures
Tables
| Subtype [3] | Label | Phenotypic features | Complication risk | Molecular profiles [5] |
|---|---|---|---|---|
| Adapted from Ahlqvist et al [3] and Slieker et al [5]. A1c: glycated hemoglobin; BMI: body mass index; DM: diabetes. | ||||
| SIRD | Severe insulin-resistant diabetes | Obesity with severe insulin resistance and lipotoxicity, older and middle age at DM onset | Higher risk of fatty liver and kidney complications | Liver |
| MARD | Mild age-related diabetes | Leaner BMI, older age at DM onset | Lower risk of end-stage complications | Adipose tissue |
| SIDD | Severe insulin-deficient diabetes | Leaner BMI, high A1c, younger age at DM onset, longer DM duration | Higher risk of microangiopathic complications | Pancreatic islet biology |
| MOD | Mild obesity-related diabetes | Severe obesity, metabolically healthier, younger age at DM onset, shorter DM duration | Lower risk of diabetes complications | Adipose tissue |
| Characteristics | Overall | Female | Male |
|---|---|---|---|
| aMetabolic syndrome was defined according to the Harmonized Metabolic Syndrome Definition guidelines [23] by meeting three or more criteria: 1) abdominal obesity was defined as waist circumference ≥ 80 cm in females and ≥ 90 cm in males; 2) hypertension was defined as blood pressure ≥ 130/85 mm Hg or previously diagnosed hypertension; 3) hypertriglyceridemia was defined as ≥ 1.7 mmol/L (150 mg/dL); 4) low high-density lipoprotein (HDL) cholesterol was defined as < 1.3 mmol/L (50 mg/dL) in females and < 1.0 mmol/L (40 mg/dL) in males; 5) all patients met criteria for impaired fasting glucose by virtue of type 2 diabetes diagnosis. bFasting glucose measurements may have been impacted by diabetes pharmacotherapy. A1c: glycated hemoglobin; BMI: body mass index; IQR: interquartile range; LDL: low-density lipoprotein; SD: standard deviation. | |||
| Total, n (%) | 60,946 | 37,832 (62.1) | 23,114 (37.9) |
| Age at the assessment, mean (SD), years | 61.1 (10.7) | 60.8 (10.8) | 61.5 (10.7) |
| Age at assessment (years), n (%) | |||
| < 40.0 years | 1,946 (3.2) | 1,240 (3.3) | 706 (3.1) |
| 40.0 - 49.9 years | 6,352 (10.4) | 4,034 (10.7) | 2,318 (10.0) |
| 50.0 - 59.9 years | 17,402 (28.6) | 11,253 (29.7) | 6,149 (26.6) |
| 60.0 - 69.9 years | 22,135 (36.3) | 13,502 (35.7) | 8,633 (37.3) |
| ≥ 70.0 years | 13,111 (21.5) | 7,803 (20.6) | 5,308 (23.0) |
| Age at diabetes diagnosis, mean (SD), years | 53.3 (10.6) | 52.8 (10.6) | 54.0 (10.5) |
| Age at diabetes diagnosis, n (%) | |||
| < 40 .0 years | 6,000 (9.8) | 3,944 (10.4) | 2,056 (8.9) |
| 40.0 - 49.9 years | 15,150 (24.9) | 9,863 (26.1) | 5,287 (22.9) |
| 50.0 - 59.9 years | 23,010 (37.8) | 14,262 (37.7) | 8,748 (37.8) |
| 60.0 - 69.9 years | 13,117 (21.5) | 7,634 (20.2) | 5,483 (23.7) |
| ≥ 70.0 years | 3,669 (6.0) | 2,129 (5.6) | 1,540 (6.7) |
| Diabetes duration, median (IQR), years | 6.8 (3.6 - 11.0) | 7.0 (3.8 - 11.4) | 6.3 (3.3 - 10.7) |
| Diabetes duration > 10 years, n (%) | 18,517 (30.4) | 12,098 (32.0) | 6,419 (27.8) |
| Ethnicity, n (%) | |||
| Malay | 38,887 (63.8) | 25,068 (66.3) | 13,819 (59.8) |
| Chinese | 10,156 (16.7) | 5,314 (14.0) | 4,842 (20.9) |
| Indian | 5,044 (8.3) | 3,084 (8.2) | 1,960 (8.5) |
| Other | 6,859 (11.3) | 4,366 (11.5) | 2,493 (10.8) |
| BMI, mean (SD), kg/m2 | 27.8 (5.2) | 28.0 (5.4) | 27.4 (4.8) |
| BMI, n (%) | |||
| Underweight (> 18.5) | 977 (1.6) | 663 (1.8) | 314 (1.4) |
| Normal (18.5 - 24.9) | 17,841 (29.3) | 10,788 (28.5) | 7,053 (30.5) |
| Overweight (25.0 - 29.9) | 23,972 (39.3) | 14,285 (37.8) | 9,687 (41.9) |
| Obese (≥ 30.0) | 18,156 (29.8) | 12,096 (32.0) | 6,060 (26.2) |
| Waist circumference, mean (SD), cm | 93.3 (11.9) | 92.2 (11.9) | 95.1 (11.7) |
| Abdominal obesity, n (%)a | |||
| No | 11,524 (18.9) | 4,556 (12.0) | 6,968 (30.1) |
| Yes | 49,422 (81.1) | 33,276 (88.0) | 16,146 (69.9) |
| Hypertension, n (%)a | |||
| No | 10,741 (17.7) | 6,221 (16.5) | 4,520 (19.6) |
| Yes | 49,991 (82.3) | 31,477 (83.5) | 18,514 (80.4) |
| Triglyceridemia, median (IQR), mmol/L | 1.40 (1.10 - 2.0) | 1.4 (1.1 - 2.0) | 1.4 (1.1 - 2.0) |
| Hypertriglyceridemia, n (%)a | |||
| No | 37,236 (61.1) | 23,332 (61.7) | 13,904 (60.2) |
| Yes | 23,710 (38.9) | 14,500 (38.3) | 9,210 (39.8) |
| HDL, mean (SD), mmol/L | 1.3 (0.4) | 1.3 (0.4) | 1.2 (0.3) |
| Low HDL, n (%)a | |||
| No | 33,710 (55.3) | 19,195 (50.7) | 14,515 (62.8) |
| Yes | 27,236 (44.7) | 18,637 (49.3) | 8,599 (37.2) |
| LDL, mean (SD), mmol/L | 2.91 (1.11) | 2.98 (1.13) | 2.80 (1.06) |
| Fasting serum glucose, mean (SD)b, mmol/L | 7.67 (2.87) | 7.72 (2.92) | 7.60 (2.80) |
| A1c, mean (SD), % | 7.9 (2.1) | 8.0 (2.1) | 7.8 (2.0) |
| Diabetes medications, n (%) | |||
| None | 1,770 (2.9) | 1,148 (3.0) | 622 (2.7) |
| Metformin | 52,850 (86.7) | 33,233 (87.8) | 19,617 (84.9) |
| Sulfonylurea | 29,083 (47.7) | 17,344 (45.8) | 11,739 (50.8) |
| Other oral | 1,357 (2.2) | 884 (2.3) | 473 (2.0) |
| Insulin | 18,826 (30.9) | 11,955 (31.6) | 6,871 (29.7) |
| Metabolic syndrome, n (%)a | |||
| No | 6,979 (11.5) | 2,939 (7.8) | 4,040 (17.5) |
| Yes | 53,967 (88.5) | 34,893 (92.2) | 19,074 (82.5) |
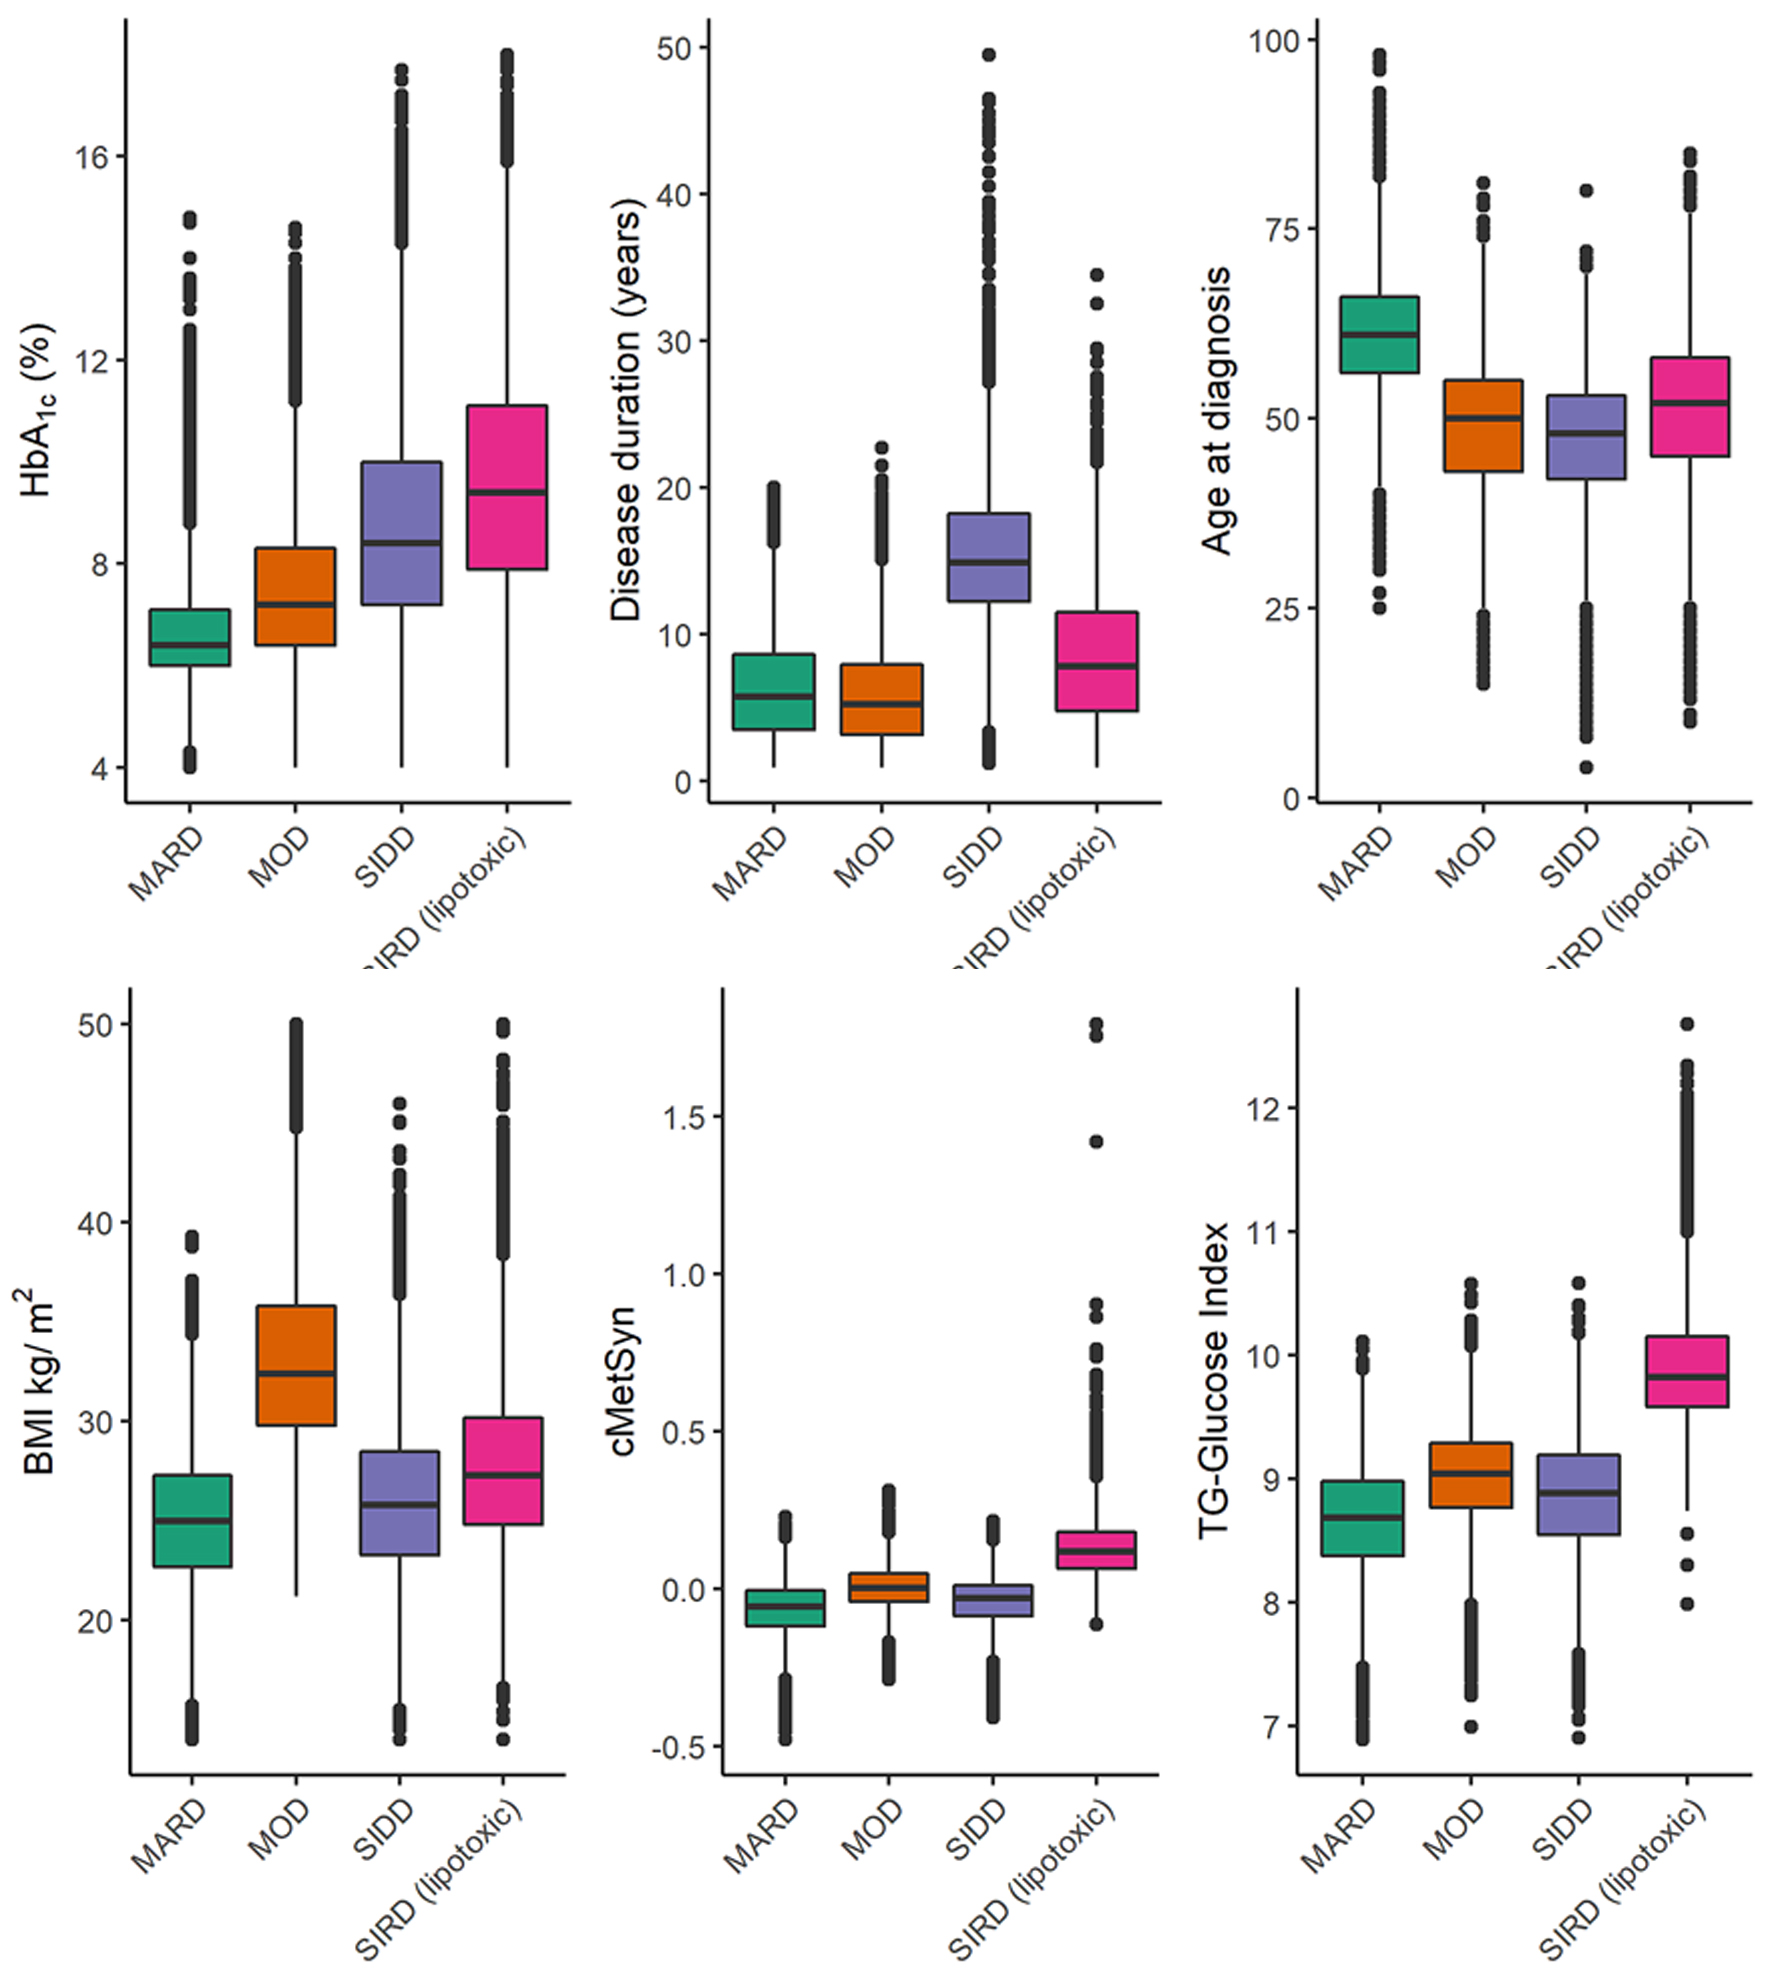
| Clusters | BMI (kg/m2) | Age at diagnosis (years) | Diabetes duration (years) | Insulin resistance, cMetSyn | Glycemia, A1c (%) | Lipotoxicity, triglyceride-glucose index | Proportion of cases | Jaccard index |
|---|---|---|---|---|---|---|---|---|
| A1c: glycated hemoglobin; BMI: body mass index; cMetSyn: continuous metabolic syndrome z-score; MARD: mild age-related diabetes; MOD: mild obesity-related diabetes; SIDD: severe insulin deficient diabetes; SIRD: severe insulin-resistant diabetes. | ||||||||
| SIRD | 27.7 | 51 | 7.8 | 0.132 | 9.6 | 9.9 | 22% | 0.92 |
| MARD | 25.0 | 61 | 5.8 | -0.064 | 6.7 | 8.7 | 35% | 0.93 |
| SIDD | 26.0 | 47 | 15.0 | -0.040 | 8.7 | 8.9 | 19% | 0.90 |
| MOD | 33.2 | 49 | 5.3 | 0.004 | 7.5 | 9.0 | 24% | 0.93 |
| Characteristics | MARD | SIDD | MOD | SIRD |
|---|---|---|---|---|
| aMetabolic syndrome was defined according to the Harmonized Metabolic Syndrome Definition guidelines [13] by meeting three or more criteria: 1) abdominal obesity was defined as waist circumference ≥ 80 cm in females and ≥ 90 cm in males; 2) hypertension was defined as blood pressure ≥ 130/85 mm Hg or previously diagnosed hypertension; 3) hypertriglyceridemia was defined as ≥ 1.7 mmol/L (150 mg/dL); 4) low high-density lipoprotein (HDL) cholesterol was defined as < 1.3 mmol/L (50 mg/dL) in females and < 1.0 mmol/L (40 mg/dL) in males; 5) all patients met criteria for impaired fasting glucose by virtue of type 2 diabetes diagnosis. A1c: glycated hemoglobin; BMI: body mass index; cMetSyn: continuous metabolic syndrome z-score; LDL: low-density lipoprotein; MARD: mild age-related diabetes; MOD: mild obesity-related diabetes; SD: standard deviation; SIDD: severe insulin deficient diabetes; SIRD: severe insulin-resistant diabetes. | ||||
| n (%) | 21,059 (35.6) | 11,751 (19.3) | 14,700 (24.1) | 13,436 (22.0) |
| Female, n (%) | 12,365 (58.8) | 7,558 (64.2) | 9,646 (65.6) | 8,263 (61.5) |
| Male, n (%) | 8,673 (41.2) | 4,215 (35.8) | 5,042 (34.4) | 5,176 (38.5) |
| Malay ethnicity, n (%) | 12,379 (58.8) | 7,362 (62.5) | 9,912 (67.5) | 9,234 (68.7) |
| Chinese ethnicity, n (%) | 4,694 (22.3) | 2,055 (17.5) | 1,394 (9.5) | 2,013 (15.0) |
| Indian ethnicity, n (%) | 1,376 (6.5) | 1,556 (13.2) | 1,276 (8.7) | 835 (6.2) |
| Other ethnicity, n (%) | 2,589 (12.3) | 800 (6.8) | 2,113 (14.4) | 1,357 (10.1) |
| Age at diabetes diagnosis (years), mean (SD) | 61.1 (8.2) | 47.2 (8.5) | 48.8 (9.0) | 51.2 (9.7) |
| Diabetes duration (years), mean (SD) | 5.76 (3.53) | 15.02 (5.37) | 5.27 (3.39) | 7.80 (4.54) |
| Diabetes duration > 10 years, n (%) | 2,911 (13.8) | 10,089 (85.9) | 1,494 (10.2) | 4,023 (29.9) |
| A1c (%), mean (SD) | 6.7 (1.1) | 8.8 (2.1) | 7.5 (1.5) | 9.6 (2.3) |
| No diabetes medications, n (%) | 1,075 (5.1) | 135 (1.1) | 383 (2.6) | 177 (1.3) |
| Oral diabetes medications, n (%) | 19,343 (91.9) | 10,328 (87.7) | 13,666 (93.0) | 12,053 (89.7) |
| Insulin pharmacotherapy, n (%) | 2,364 (11.2) | 6,559 (55.7) | 3,482 (23.7) | 6,421 (47.8) |
| LDL, mmol/L, mean (SD) | 2.76 (1.02) | 2.85 (1.07) | 2.95 (1.04) | 3.15 (1.29) |
| Triglyceride-glucose index, mean (SD) | 8.67 (0.43) | 8.86 (0.47) | 9.02 (0.40) | 9.90 (0.46) |
| BMI (kg/m2), mean (SD) | 24.96 (3.49) | 26.04 (3.94) | 33.17 (4.83) | 27.67 (4.32) |
| cMetSyn score, mean (SD) | -0.06 (0.08) | -0.04 (0.08) | 0.00 (0.07) | 0.13 (0.10) |
| Metabolic syndrome, n (%)a | 16,735 (79.5) | 9,954 (84.7) | 14,141 (96.2) | 13,137 (97.8) |
| Chronic kidney disease, stage 3a or worse, n (%) | 6,807 (32.7) | 4,696 (40.5) | 3,356 (23.1) | 5,056 (38.2) |
| Retinopathy, n (%) | 4,337 (21.0) | 3,556 (30.8) | 1,962 (13.6) | 2,844 (21.6) |
| Cerebrovascular disease, n (%) | 343 (1.7) | 237 (2.0) | 134 (0.9) | 211 (1.6) |
| Ischemic heart disease, n (%) | 1,228 (5.9) | 1,013 (8.7) | 555 (3.8) | 808 (6.1) |
| Diabetes foot ulcers, n (%) | 129 (0.6) | 232 (2.0) | 117 (0.8) | 206 (1.6) |
| Limb amputations, n (%) | 65 (0.3) | 112 (1.0) | 32 (0.2) | 79 (0.6) |
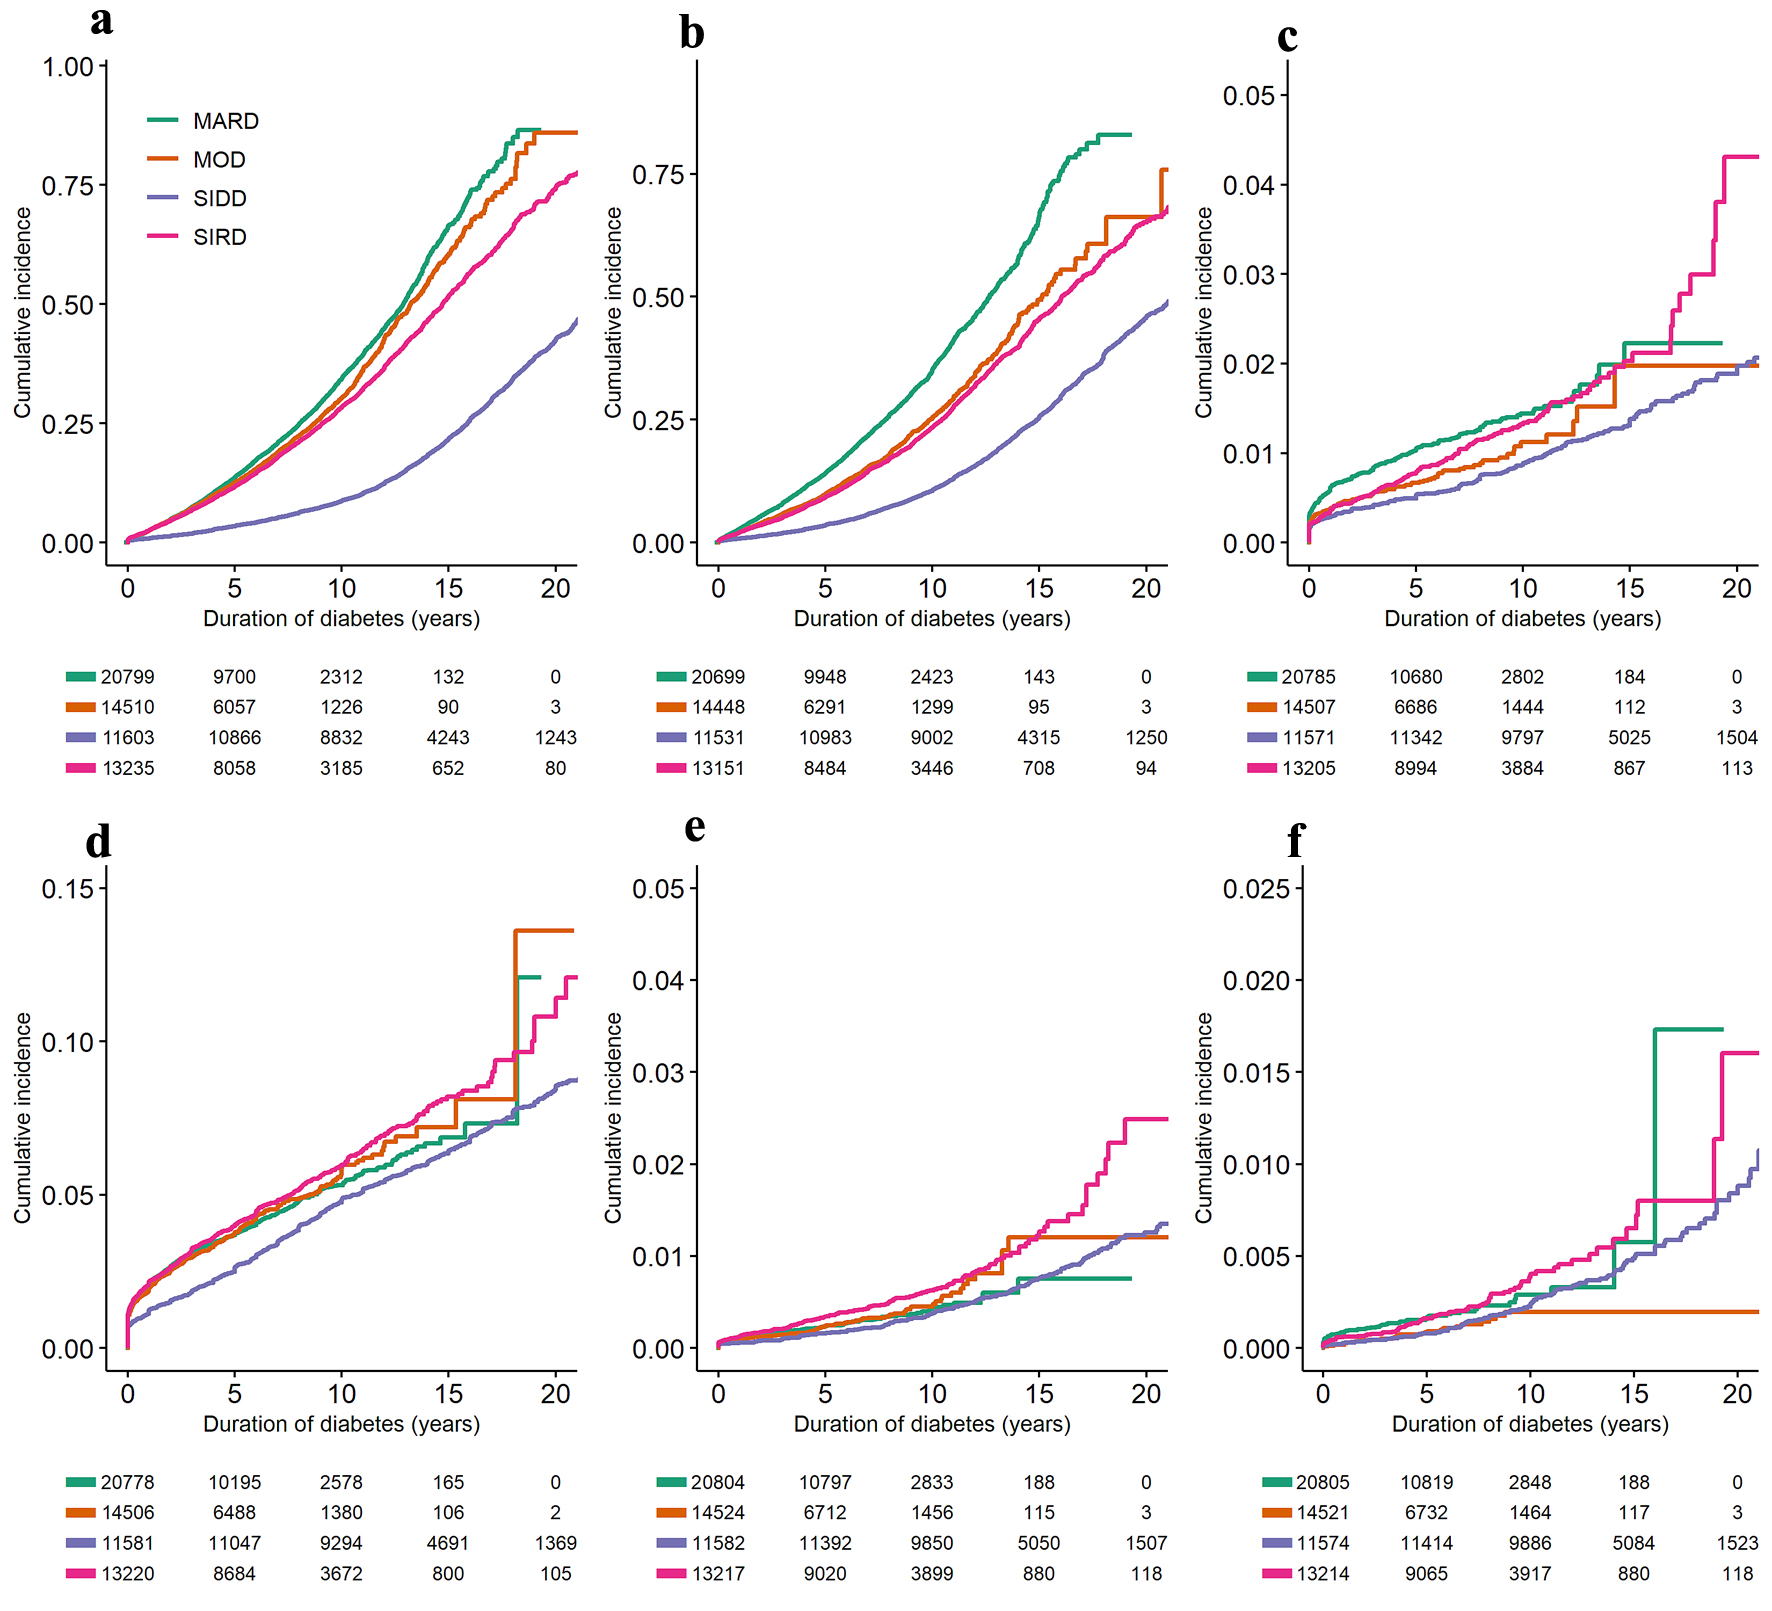
| Outcome | n | MOD vs. MARD | SIDD vs. MARD | SIRD vs. MARD |
|---|---|---|---|---|
| Cox regression models adjusted for age, sex, and ethnicity. *Statistically significant. MARD: mild age-related diabetes; MOD: mild obesity-related diabetes; SIDD: severe insulin deficient diabetes; SIRD: severe insulin-resistant diabetes. | ||||
| Chronic kidney disease, stage 3a or worse | 60,155 | 0.90 (0.86 - 0.95)* | 0.25 (0.24 - 0.26)* | 0.77 (0.74 - 0.80)* |
| Retinopathy | 59,832 | 0.68 (0.64 - 0.72)* | 0.28 (0.27 - 0.30)* | 0.59 (0.56 - 0.63)* |
| Cerebrovascular disease | 60,070 | 0.69 (0.55 - 0.86)* | 0.57 (0.47 - 0.69)* | 0.84 (0.70 - 1.01) |
| Ischemic heart disease | 60,087 | 1.02 (0.91 - 1.13) | 0.83 (0.76 - 0.91)* | 1.08 (0.98 - 1.18) |
| Diabetes foot ulcers | 60,129 | 1.07 (0.82 - 1.41) | 0.82 (0.64 - 1.04) | 1.43 (1.13 - 1.81)* |
| Limb amputations | 60,116 | 0.53 (0.34 - 0.84)* | 0.73 (0.51 - 1.04) | 1.03 (0.72 - 1.46) |