Journal of Endocrinology and Metabolism, ISSN 1923-2861 print, 1923-287X online, Open Access
Article copyright, the authors; Journal compilation copyright, J Endocrinol Metab and Elmer Press Inc
Journal website https://www.jofem.org

Original Article

Volume 13, Number 4, November 2023, pages 153-163


Improvement of Glycemic Control by Metformin Is Associated With Frequency of Defecation Before Treatment in Patients With Type 2 Diabetes Mellitus

Figures

Figure 1.
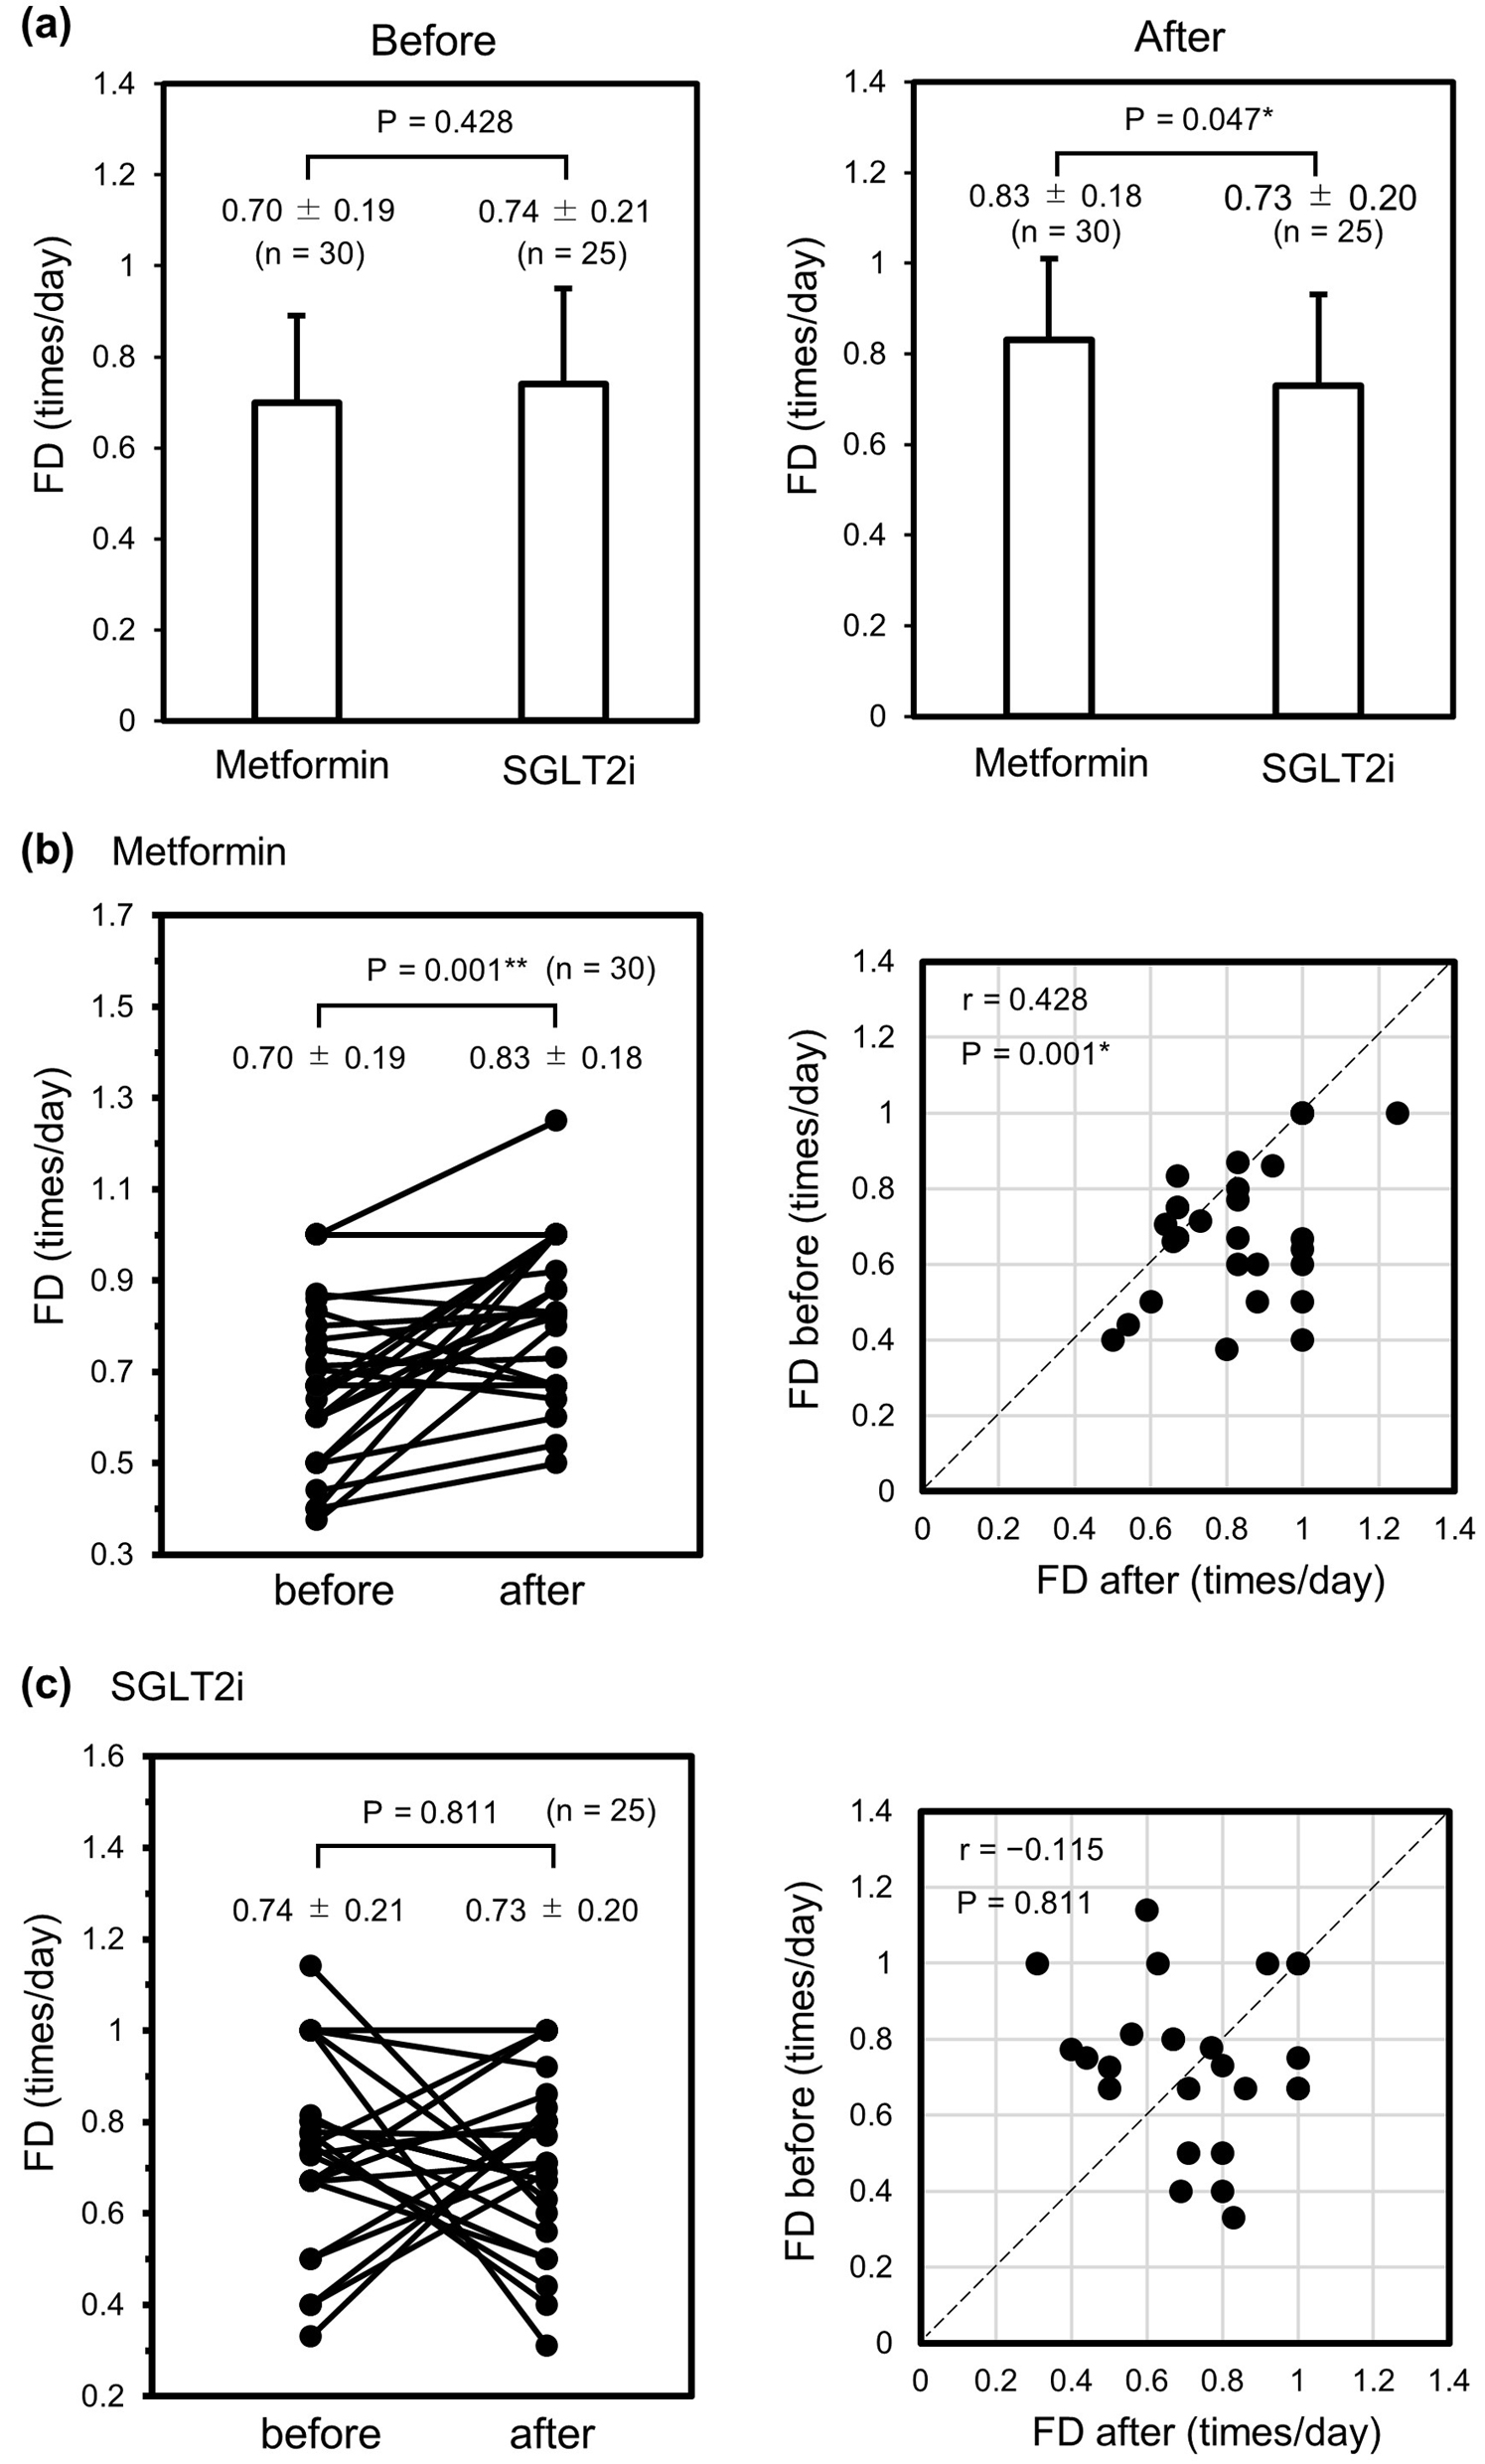
Figure 1. Changes in FD before and after administration of metformin or an SGLT2i during hospitalization. (a) Comparison of FD before (left panel) and after (right panel) initiation of metformin (n = 30) or an SGLT2i (n = 25). (b) Line (left) and dot plot (right) comparisons of FD among individuals in the metformin group. (c) Line (left) and dot plot (right) comparisons of FD among individuals in the SGLT2i group. Data were analyzed using the unpaired t-test in (a) and the paired t-test in (b) and (c). *P < 0.05. **P < 0.01. FD: frequency of defecation; SGLT2i: sodium-glucose cotransporter-2 inhibitor.
Figure 2.
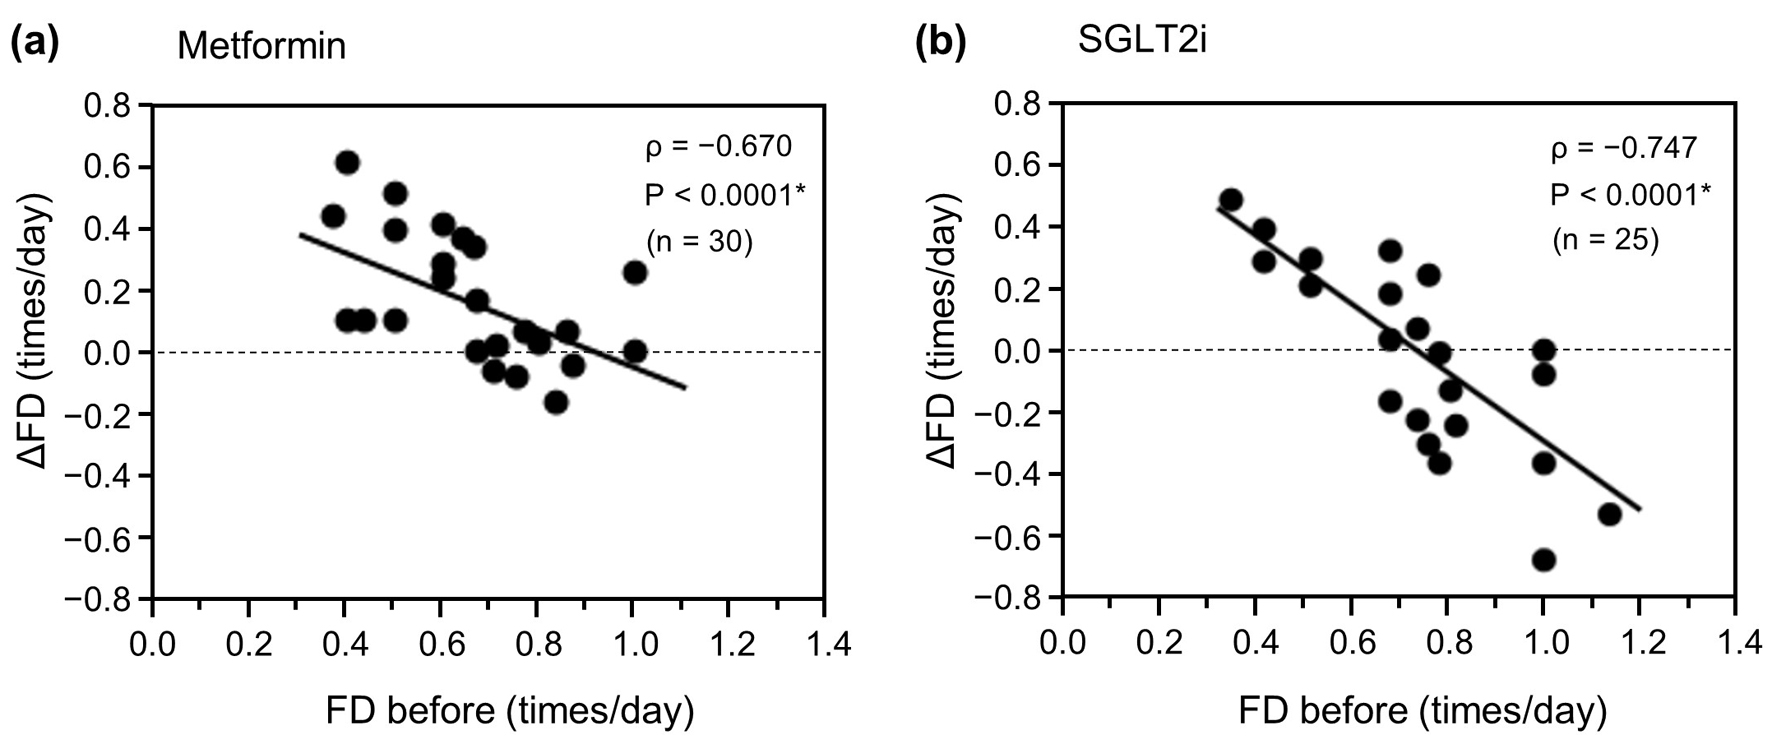
Figure 2. Relationship between ΔFD and FD before initiation of metformin or an SGLT2i. (a) Metformin group (n = 30). (b) SGLT2i group (n = 25). Data were analyzed using Spearman’s correlation analysis. *P < 0.01. ΔFD: change in FD; FD: frequency of defecation; SGLT2i: sodium-glucose cotransporter-2 inhibitor.
Figure 3.
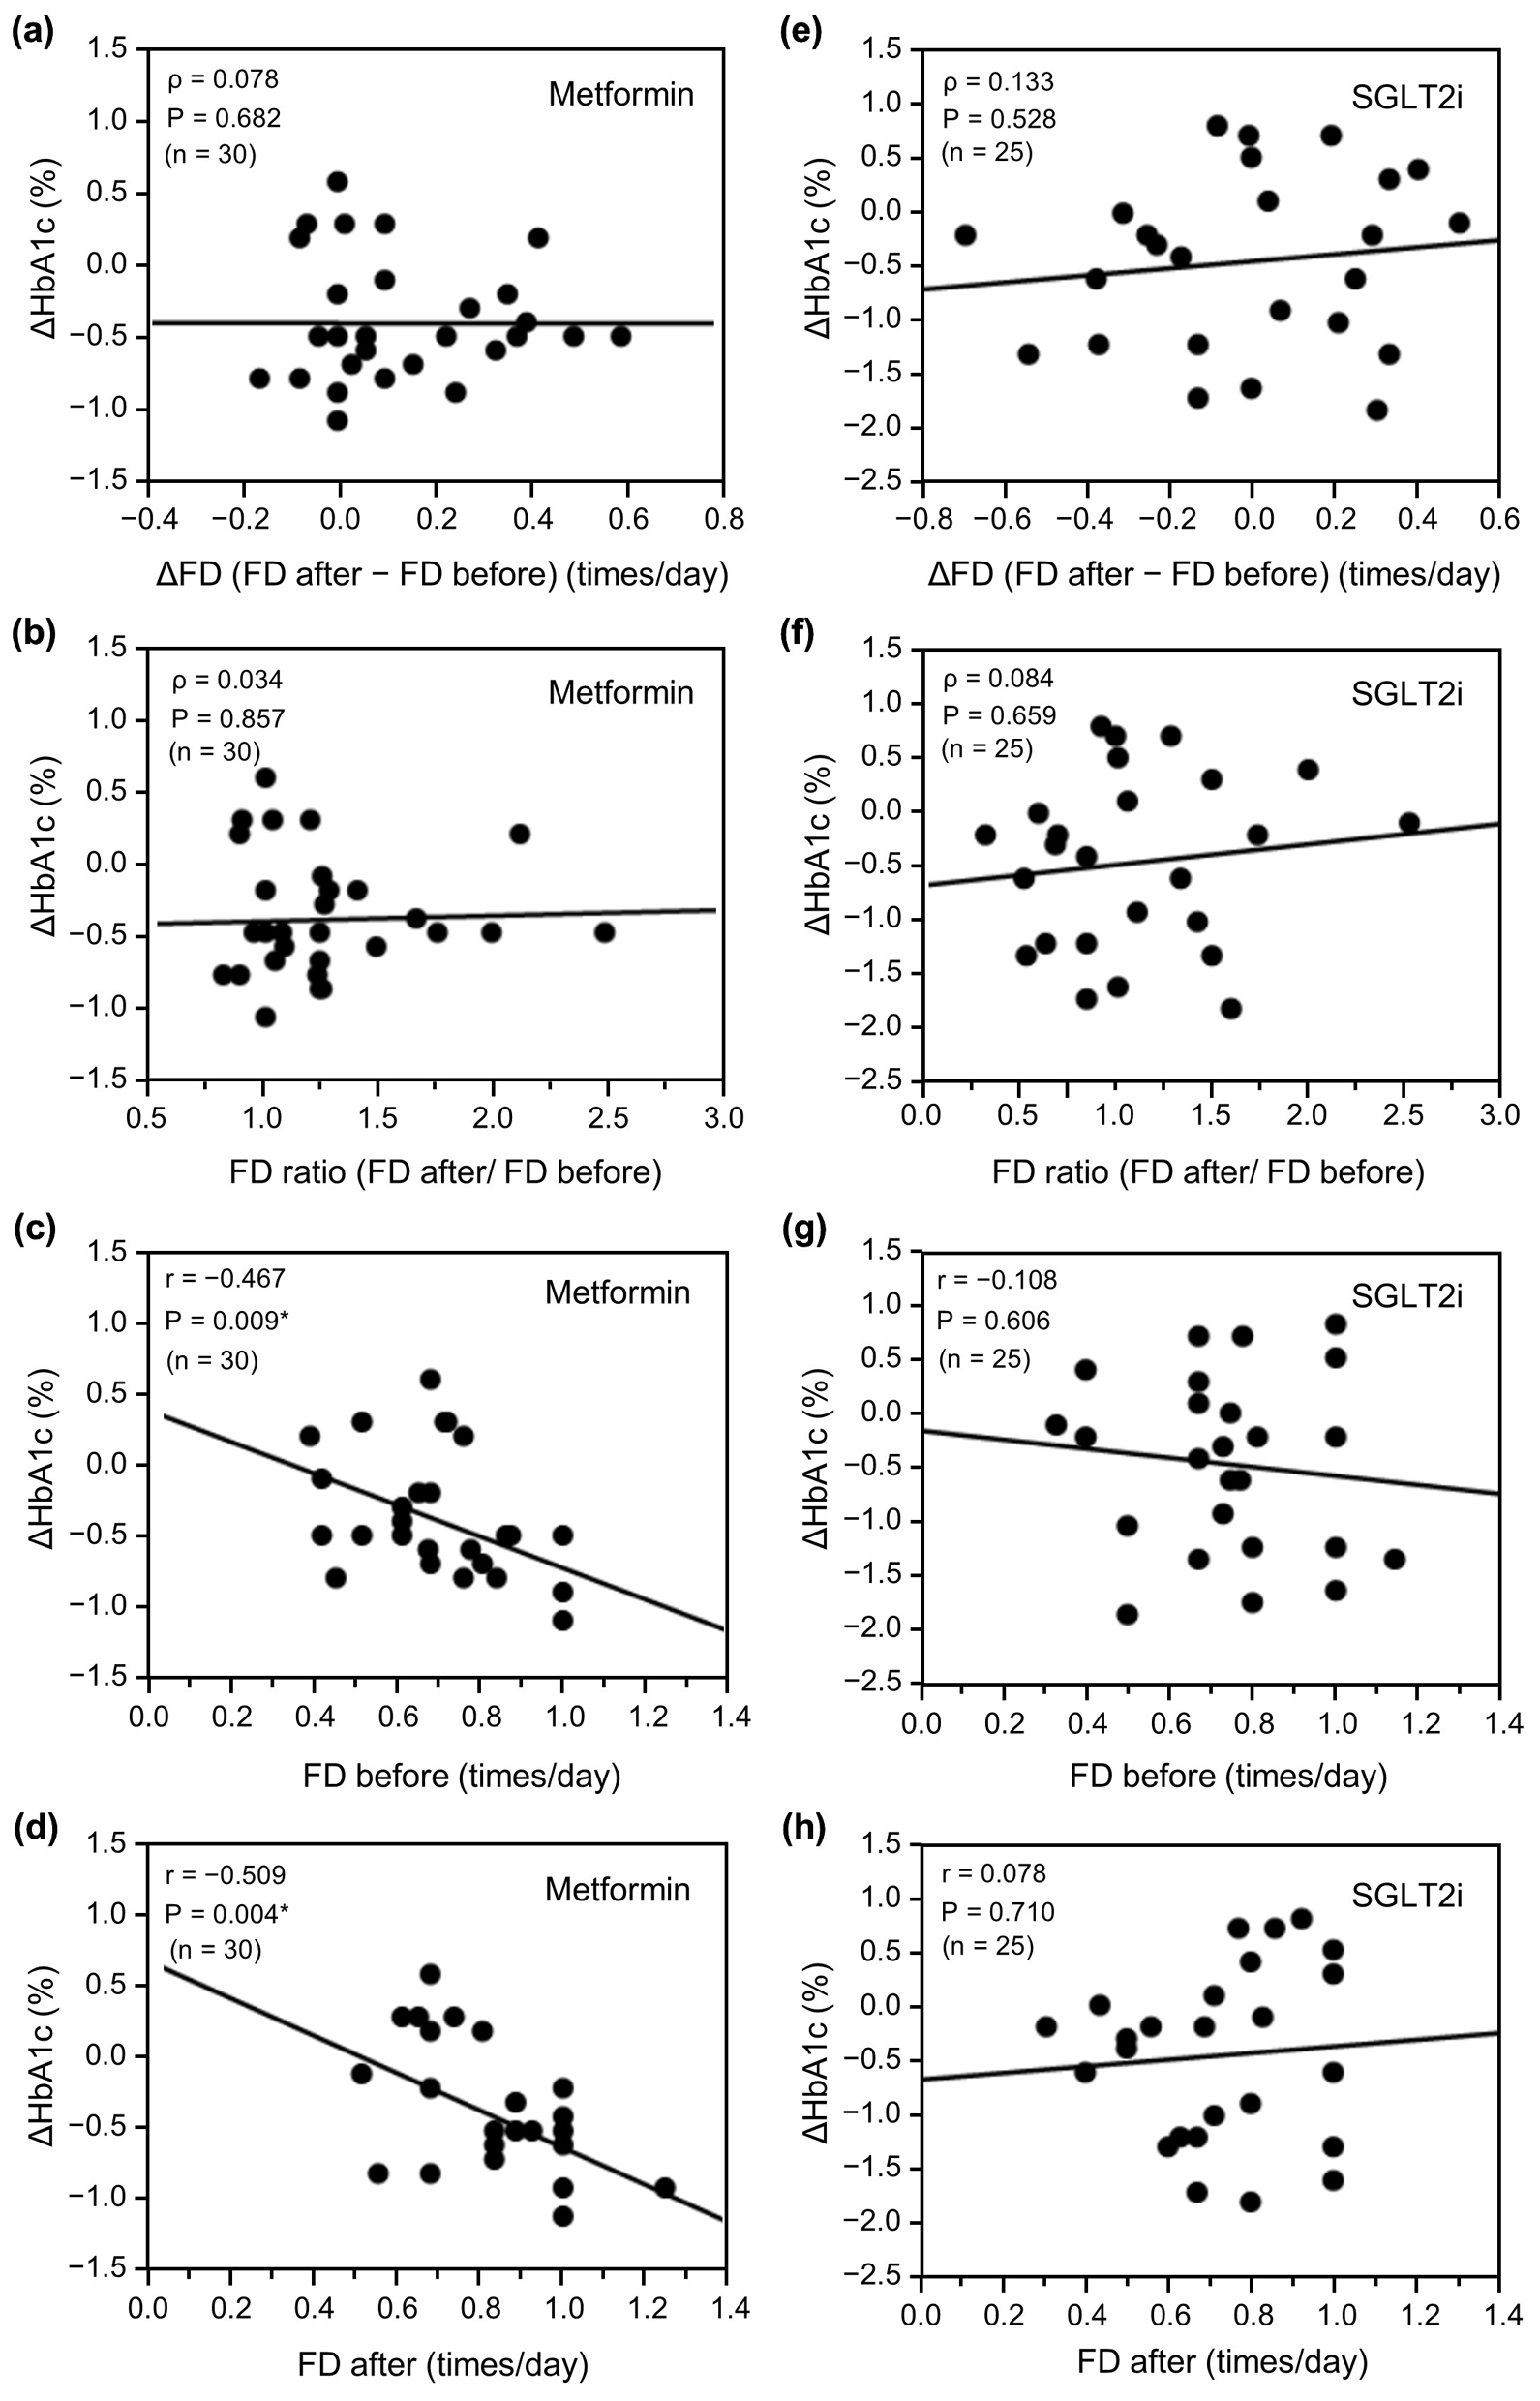
Figure 3. Relationship between ΔHbA1c and change in FD (ΔFD or FD ratio) or FD before and after initiation of metformin (n = 30) or an SGLT2i (n = 25). (a) ΔFD after initiation of metformin, (b) FD ratio before and after initiation of metformin, (c) FD before initiation of metformin, (d) FD after initiation of metformin, (e) ΔFD after initiation of SGLT2i, (f) FD ratio before and after initiation of SGLT2i, (g) FD before initiation of SGLT2i, and (h) FD after initiation of SGLT2i. Data in (a), (b), (e), and (f) were analyzed using Spearman’s correlation analysis and data in (c), (d), (g), and (h) were analyzed using the unpaired t-test. *P < 0.01. ΔHbA1c: change in glycated hemoglobin; ΔFD: change in FD; FD: frequency of defecation; SGLT2i: sodium-glucose cotransporter-2 inhibitor.

Tables

Table 1. Baseline Characteristics of the Patients Who Were Taking Metformin or SGLT2i
 
VariableTreatmentP-value
Metformin (n = 30)SGLT2i (n = 25)
Data are presented as mean ± SD, median (IQR) or %. aWilcoxon rank sum test. bPearson’s χ2-test. cUnpaired t-test. eGFR: estimated glomerular filtration rate; HbA1c: glycated hemoglobin; IQR: interquartile range; SD: standard deviation; SGLT2i: sodium-glucose cotransporter 2 inhibitors.
Age (years) (median (IQR))56.0 (51.0 - 69.0)60.0 (52.0 - 66.5)0.899a
Sex, male (%)70.060.00.437b
Body mass (kg) (mean ± SD)67.3 ± 13.866.5 ± 12.70.834c
Body mass index (kg/m2)25.3 ± 3.8125.8 ± 4.800.664c
Duration of diabetes (years)6 (0.5 - 13.0)3 (0.5 - 13.5)0.637a
Fasting plasma glucose (mg/dL)208 (146 - 265)171 (146 - 245)0.335a
HbA1c at admission (%)10.2 (8.8 - 12.2)9.5 (7.9 - 12.4)0.310a
Fasting C-peptide (ng/mL)1.78 ± 0.62 (n = 29)2.06 ± 0.76 (n = 20)0.172c
eGFR (mL/min/1.73 m2)77.9 ± 15.971.6 ± 24.90.266c
Hypertension (%)40.028.00.351b
Dyslipidemia (%)86.784.00.780b
Smoking (%)34.516.00.122b
Alcohol (%)24.128.00.740b
Diabetes polyneuropathy (%)35.728.00.548b
Diabetes retinopathy (%)50.036.00.297b
Diabetes nephropathy (%)36.716.00.087b


Table 2. Frequency of Defecation Parameters and Characteristics of the Patients After Admission According to Type of Treatment Initiated
 
VariableTreatmentP-value
Metformin (n = 30)SGLT2i (n = 25)
Data are presented as mean ± SD, median (IQR) or %. *P < 0.05. **P < 0.01. aWilcoxon rank sum test. bUnpaired t-test. cPearson’s χ2-test. DPP4i: dipeptidyl peptidase-4 inhibitors; FD: frequency of defecation; ΔFD: change in FD; GLP-1: glucagon-like peptide 1; HbA1c: glycated hemoglobin; ΔHbA1c: change in HbA1c; IQR: interquartile range; SD: standard deviation; SGLT2i: sodium-glucose cotransporter 2 inhibitors.
Days on which FD was recorded before initiation of treatment (days)7.0 (4.8 - 10.0)7.0 (3.5 - 9.5)0.507a
Days on which FD was recorded after initiation of treatment (days)6.0 (5.0 - 10.3)7.0 (5.0 - 9.5)0.980a
Time to starting recording of FD after initiation of treatment (days)0 (0 - 3)0 (0 - 0)0.014*a
FD before initiation of treatment (times/day)0.70 ± 0.190.74 ± 0.210.428b
FD after initiation of treatment (times/day)0.83 ± 0.180.73 ± 0.200.047*b
ΔFD (FD after - FD before) (times/day)0.06 (0.00 - 0.29)0.00 (-0.24 - 0.27)0.062a
FD ratio (FD after/FD before initiation of treatment)1.22 (1.00 - 1.31)1.00 (0.69 - 1.46)0.110a
Diarrhea after initiation of treatment (%)10.04.00.394c
HbA1c 1.5 months after discharge (%)7.34 ± 0.817.20 ± 0.690.477b
HbA1c 6 months after discharge (%)6.95 ± 0.906.74 ± 0.850.399b
ΔHbA1c (%)-0.40 ± 0.44-0.44 ± 0.790.796b
Use of medication
  Insulin (%)73.368.00.665c
  Metformin (%)1000.0< 0.000**c
  Sulfonylureas (%)3.34.00.895c
  DPP4i (%)46.732.00.269c
  α-Glucosidase inhibitors (%)10.04.00.394c
  Thiazolidinedione (%)10.00.00.104c
  Glinides (%)20.020.01.000c
  SGLT2i (%)56.71000.000**c
  GLP-1 receptor agonists (%)30.036.00.637c
  Osmotic laxatives (%)10.08.00.797c
  Stimulant laxatives (%)23.340.00.183c


Table 3. Multiple Regression Analysis Showing the Relationships Between ΔHbA1c and Variables in the Metformin Group
 
Standardized coefficient β95% confidence interval for Bt-valueP-valueVIF
Lower limitUpper limit
*P < 0.05. **P < 0.01. B: raw coefficient; FD: frequency of defecation; GLP-1: glucagon-like peptide-1; ΔHbA1c: change in HbA1c; VIF: variance inflation factor.
Constant0.000-0.4041.4621.170.255
Age-0.066-0.0180.012-0.390.7201.095
Sex (female)0.301-0.0180.3041.820.0801.019
FD before starting metformin-0.433-1.821-0.195-2.550.017*1.086
Constant0.000-0.3300.8240.880.386
Duration of diabetes0.182-0.0090.0281.050.3041.147
Use of stimulant laxative0.249-0.0650.3221.370.1831.257
FD before starting metformin-0.403-1.752-0.115-2.350.027*1.118
Constant0.000-0.0811.1211.780.087
Use of GLP-1 receptor agonists0.096-0.1180.2100.570.5721.060
Use of osmotic laxative0.306-0.0280.4731.820.0801.060
FD before starting metformin-0.450-1.823-0.249-2.710.012*1.020
Constant0.000-0.2521.0281.250.224
Diabetic polyneuropathy-0.110-0.2510.147-0.540.5921.345
Smoking-0.115-0.2300.124-0.620.5401.122
FD before starting metformin-0.504-2.088-0.249-2.620.015*1.219
Constant0.000-0.4280.7680.580.564
Diabetic nephropathy-0.362-0.327-0.003-2.100.046*1.132
Alcohol-0.159-0.2620.098-0.940.3551.087
FD before starting metformin-0.398-1.715-0.130-2.400.025*1.047
Constant0.000-0.2211.7671.600.122
Age-0.067-0.0180.012-0.400.6931.087
Sex (female)0.259-0.0380.2841.570.1291.044
FD after starting metformin-0.455-2.024-0.272-2.690.012*1.097
Constant0.0000.1311.4012.480.020*
Duration of diabetes0.3710.0020.0372.270.032*1.326
Use of stimulant laxative0.235-0.0440.2871.510.1431.202
FD after starting metformin-0.596-2.341-0.707-3.840.001**1.195
Constant0.0000.1661.6812.510.019*
Use of GLP-1 receptor agonists0.215-0.0620.2661.280.2111.147
Use of osmotic laxative0.296-0.0250.4551.840.0771.059
FD after starting metformin-0.530-2.195-0.480-3.210.004**1.119
Constant0.000-0.1041.4251.780.087
Diabetic polyneuropathy0.104-0.1270.2270.580.5691.122
Smoking-0.080-0.2100.135-0.440.6611.125
FD after starting metformin-0.497-2.167-0.373-2.910.007**1.003
Constant0.000-0.3861.1761.040.307
Diabetic nephropathy-0.314-0.3100.023-1.770.0891.202
Alcohol-0.169-0.2670.092-1.000.3251.084
FD after starting metformin-0.412-1.953-0.153-2.410.024*1.114