Figures
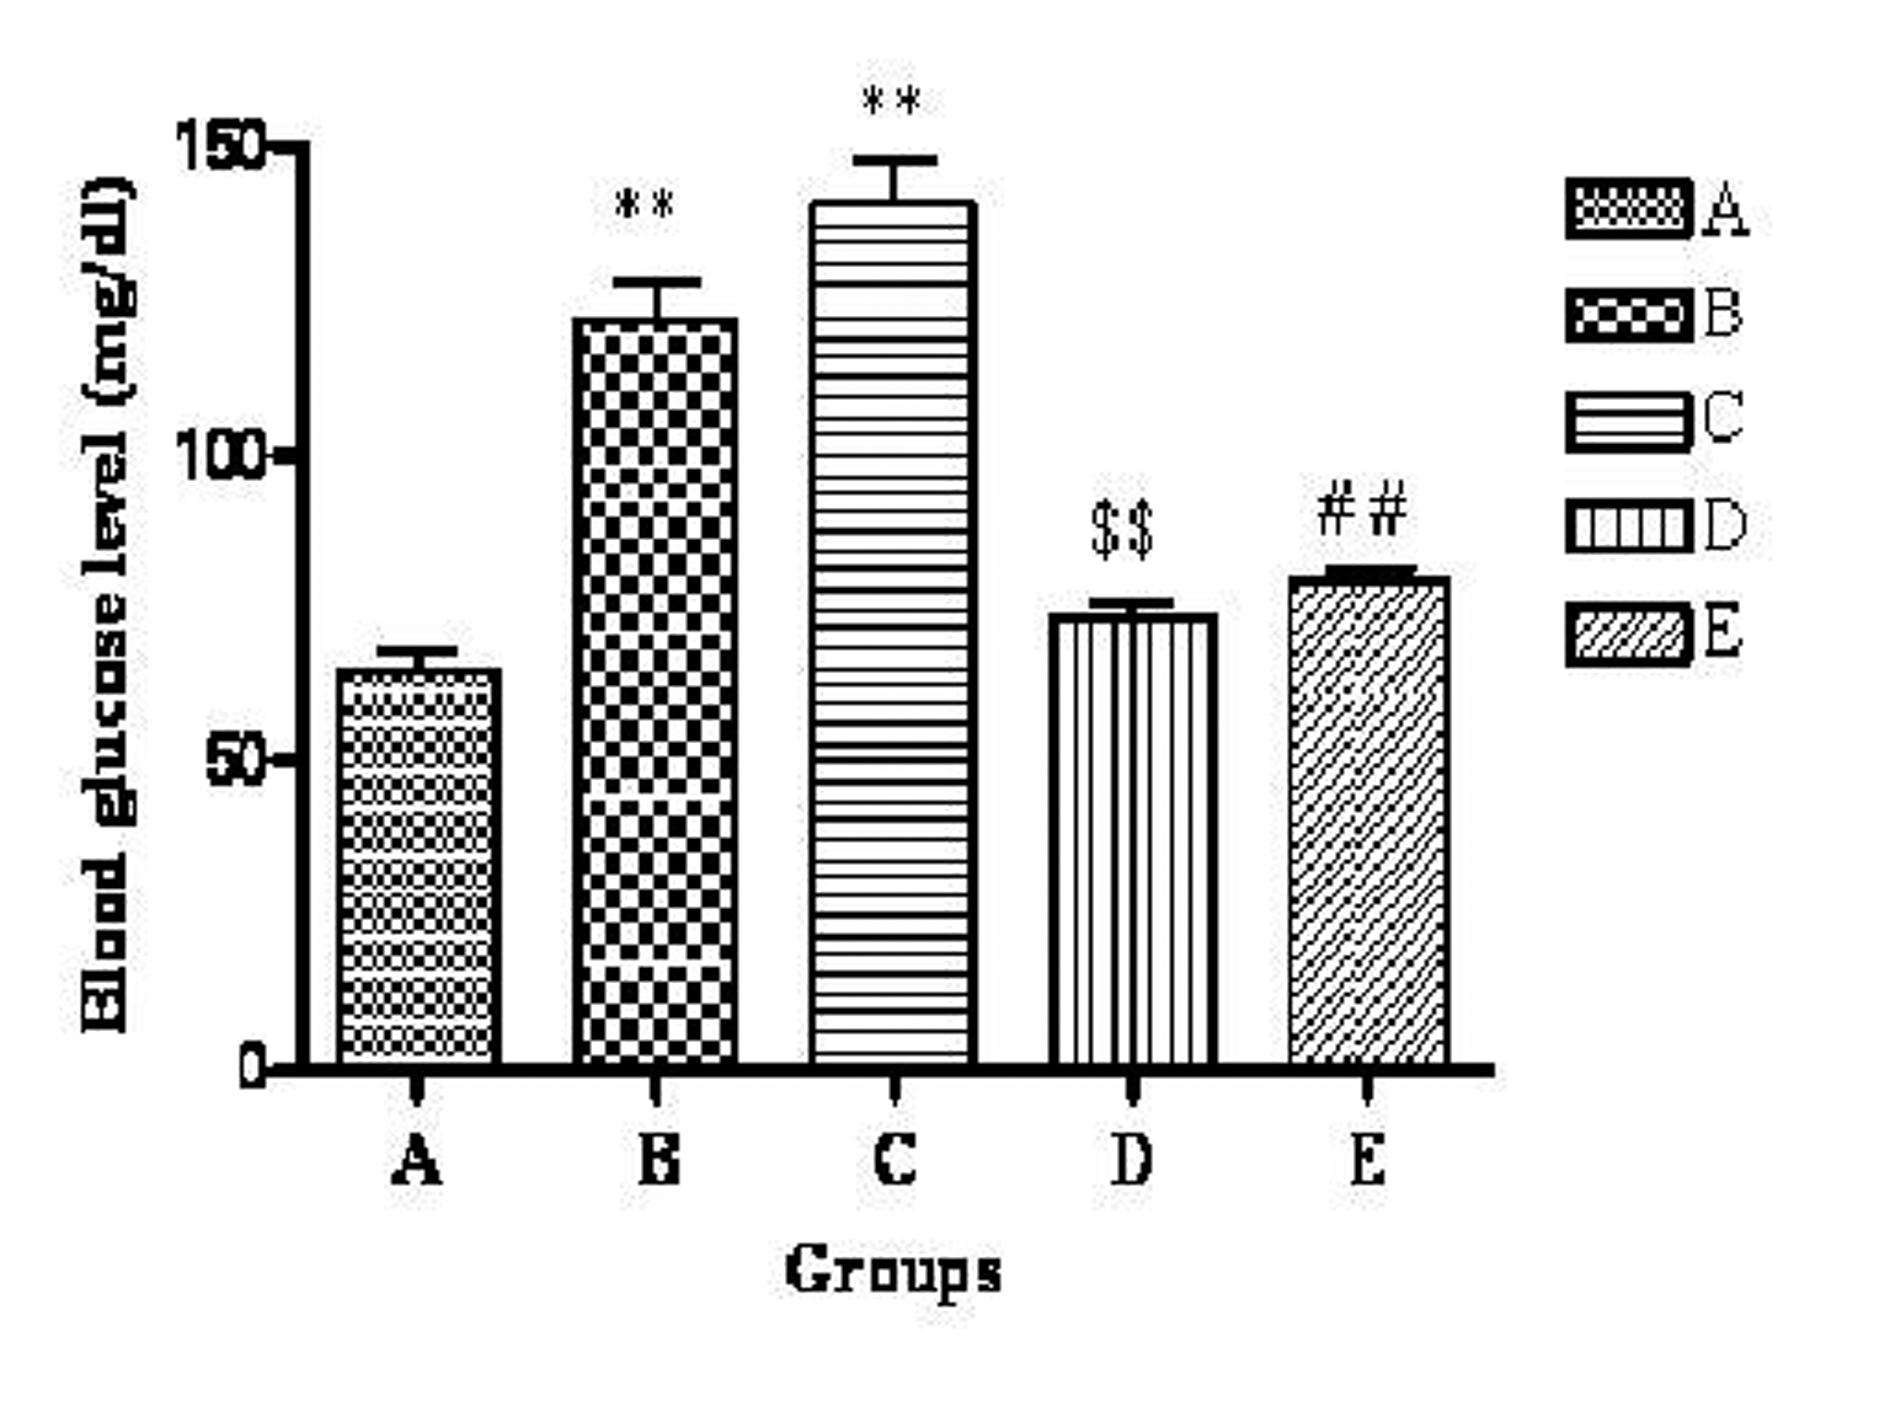
Figure 1. Effect of telmisartan on blood glucose level. n = 6; The values are expressed as mean± SEM; **P < 0.01 when compared to normal control, $$P < 0.01 when compared to OVX and ##P < 0.01 when compared to OVX + OLZ (One way ANOVA followed by Dunnett’s multiple comparison test). Group A: normal control, Group B: ovariectomy control, Group C: ovariectomy + olanzapine control, Group D: ovariectomy group treated with telmisartan, Group E: ovariectomy + olanzapine group treated with telmisartan.
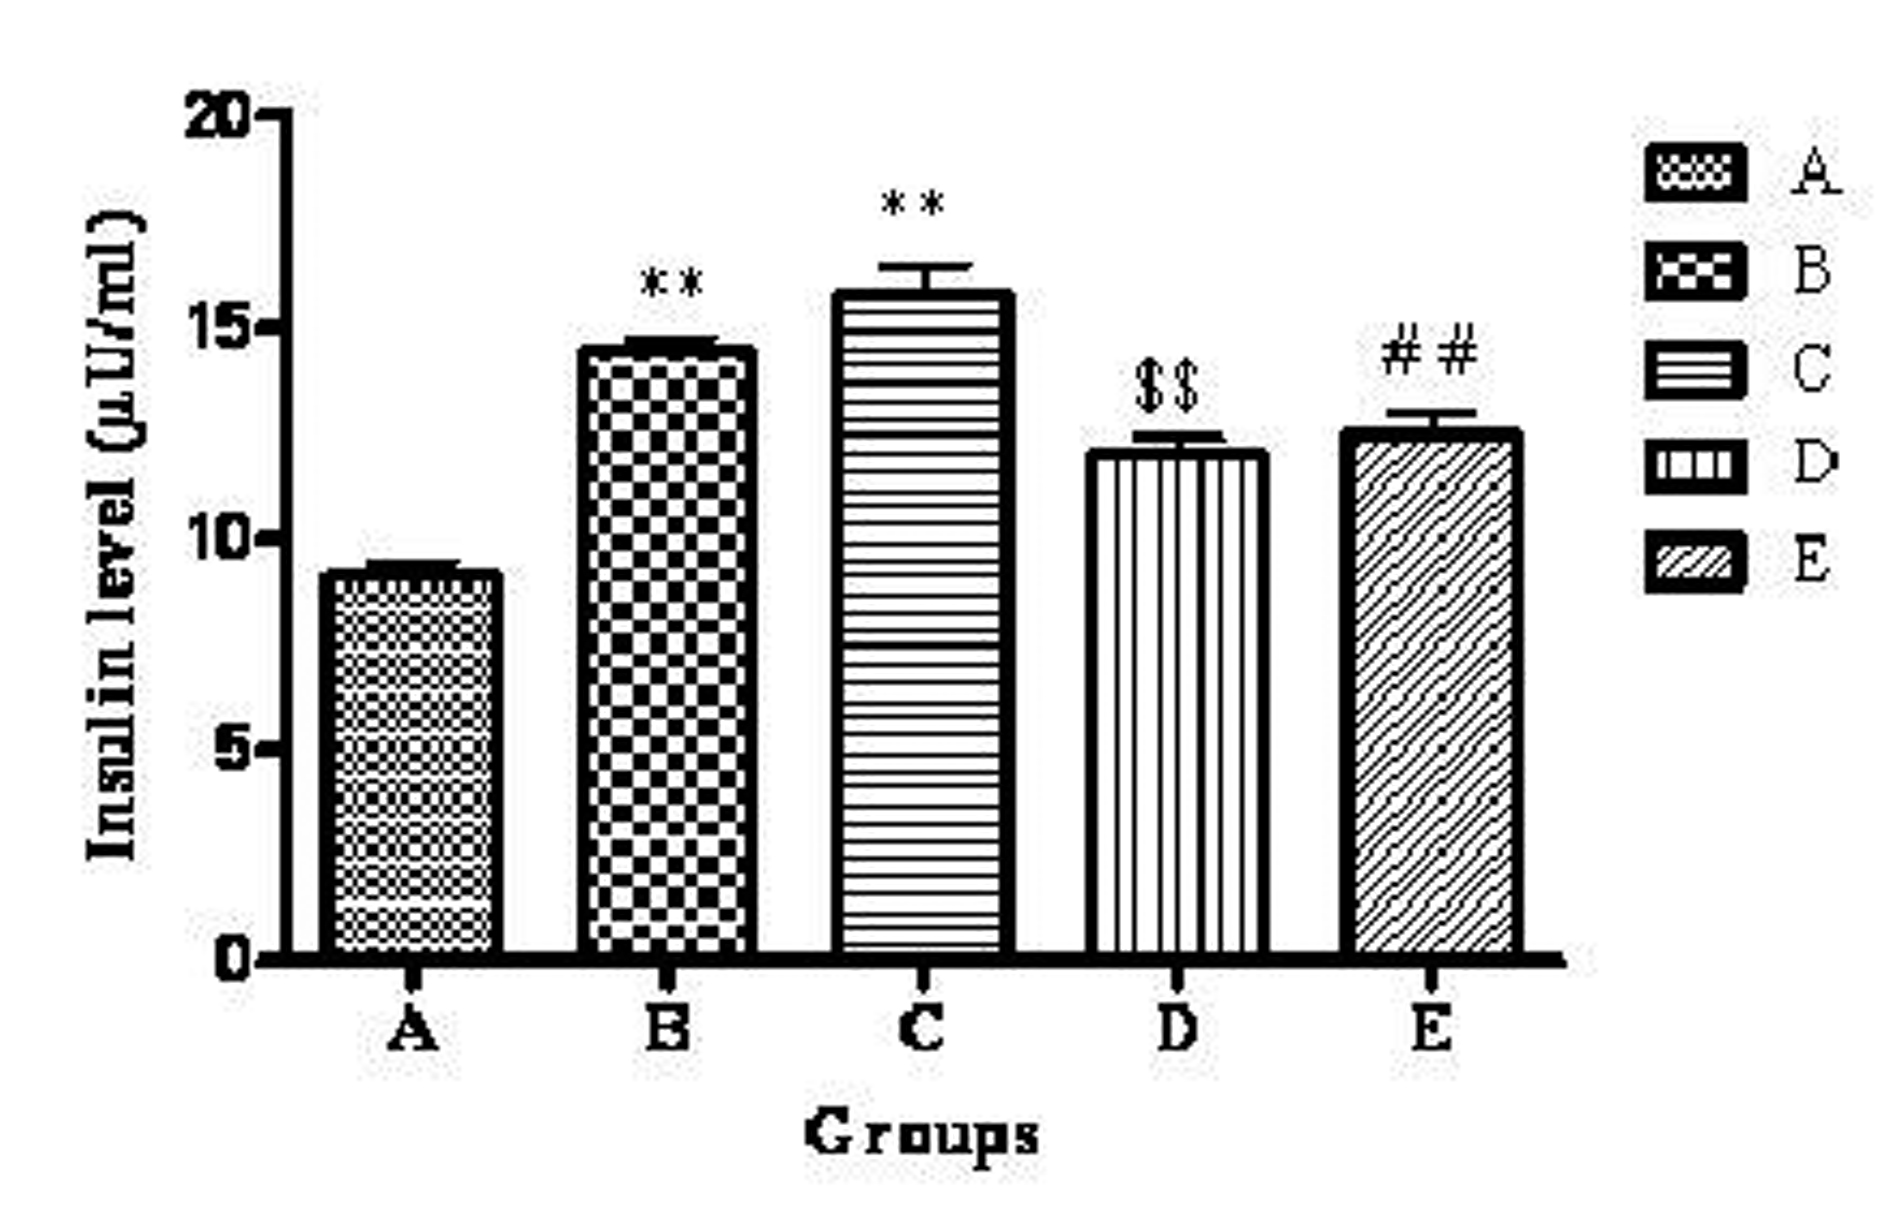
Figure 2. Effect of telmisartan on plasma insulin level. n = 6; The values are expressed as mean ± SEM; **P < 0.01 when compared to normal control, $$P < 0.01 when compared to OVX and ##P < 0.01 when compared to OVX +OLZ (One way ANOVA followed by Dunnett’s multiple comparison test). Group A: normal control, Group B: ovariectomy control, Group C: ovariectomy + olanzapine control, Group D: ovariectomy group treated with telmisartan, Group E: ovariectomy + olanzapine group treated with telmisartan.
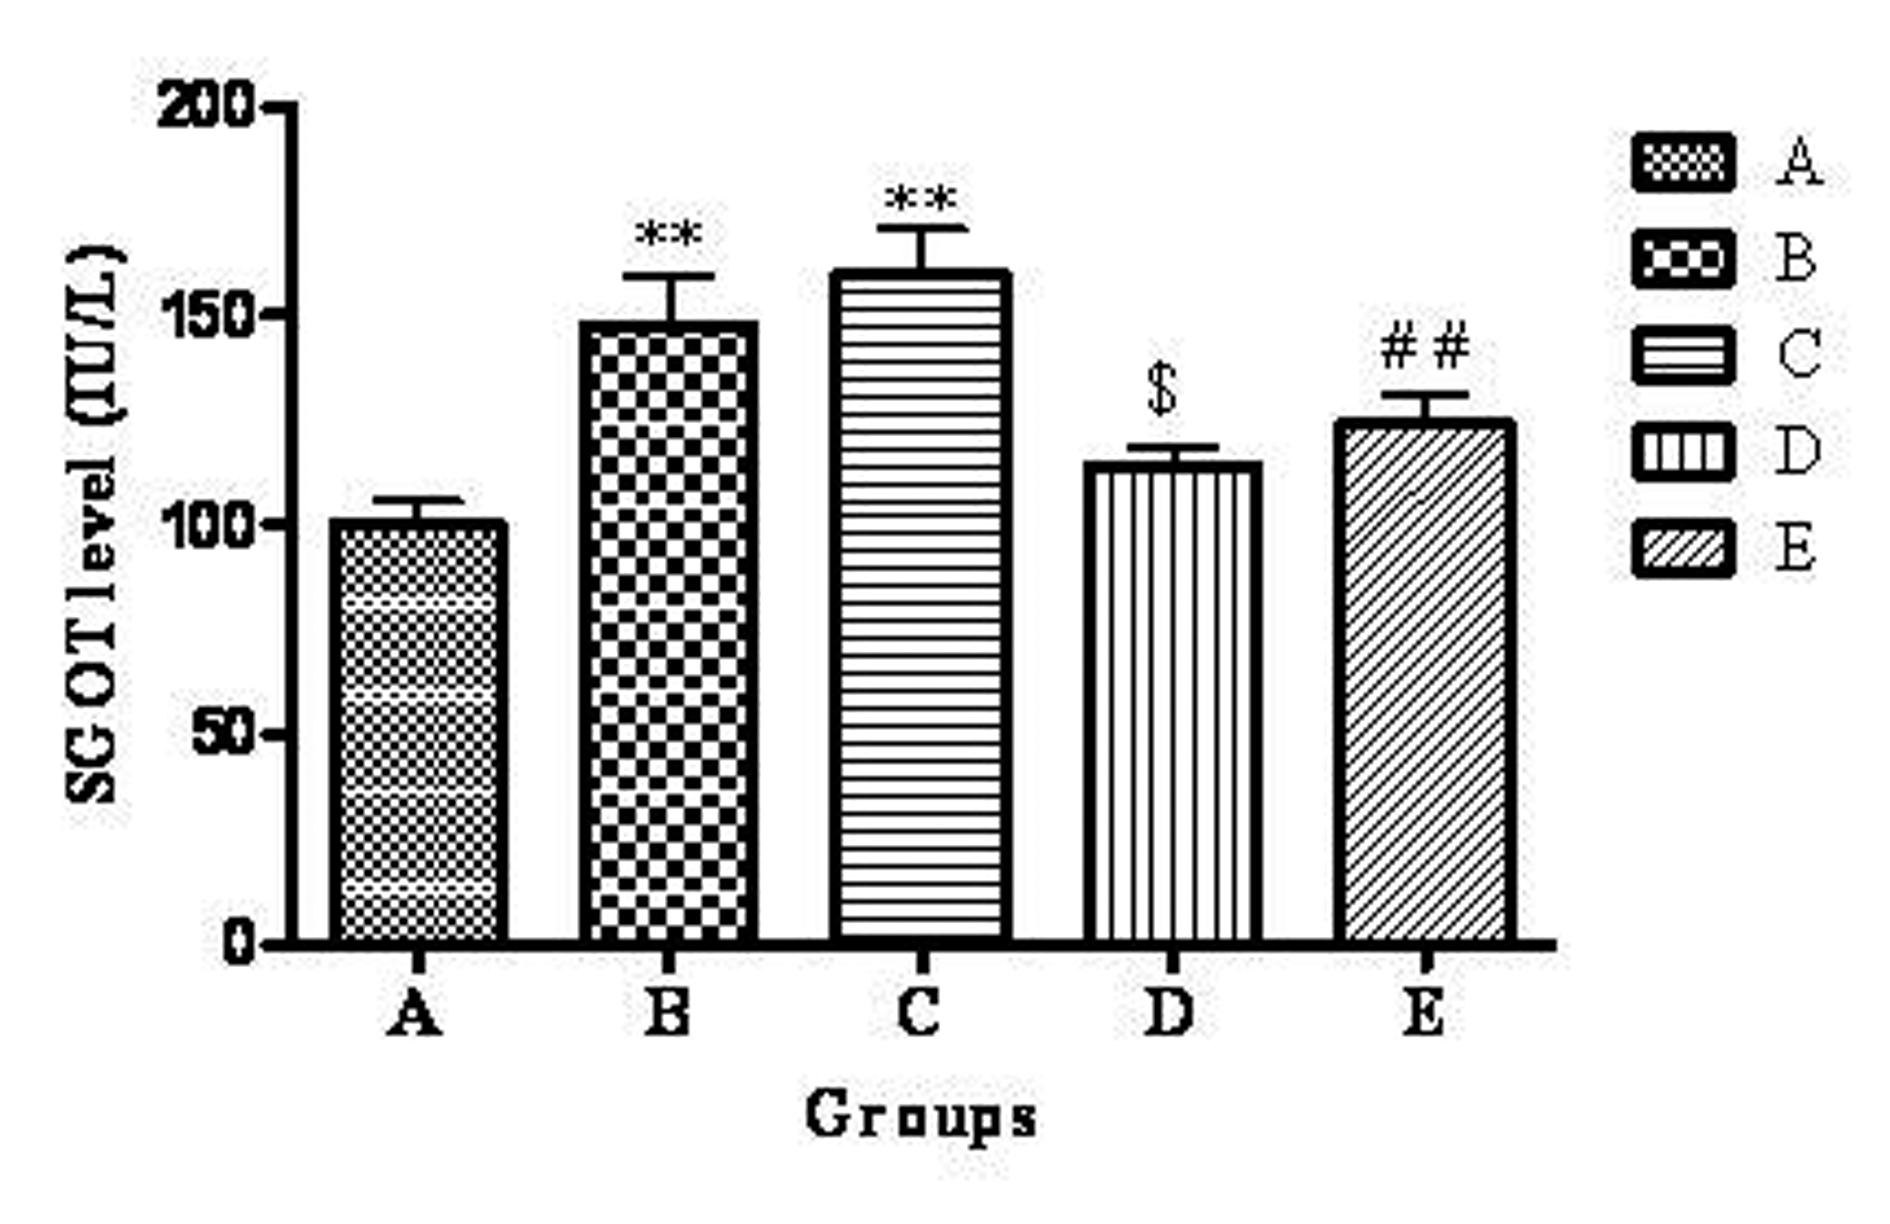
Figure 3. Effect of telmisartan on SGOT level. n =6; The values are expressed as mean ± SEM; **P <0.01 when compared to normal control, $P < 0.05 when compared to OVX and ##P < 0.01 when compared to OVX + OLZ (One way ANOVA followed by Dunnett’s multiple comparison test). Group A: normal control, Group B: ovariectomy control, Group C: ovariectomy + olanzapine control, Group D: ovariectomy group treated with telmisartan, Group E: ovariectomy + olanzapine group treated with telmisartan.
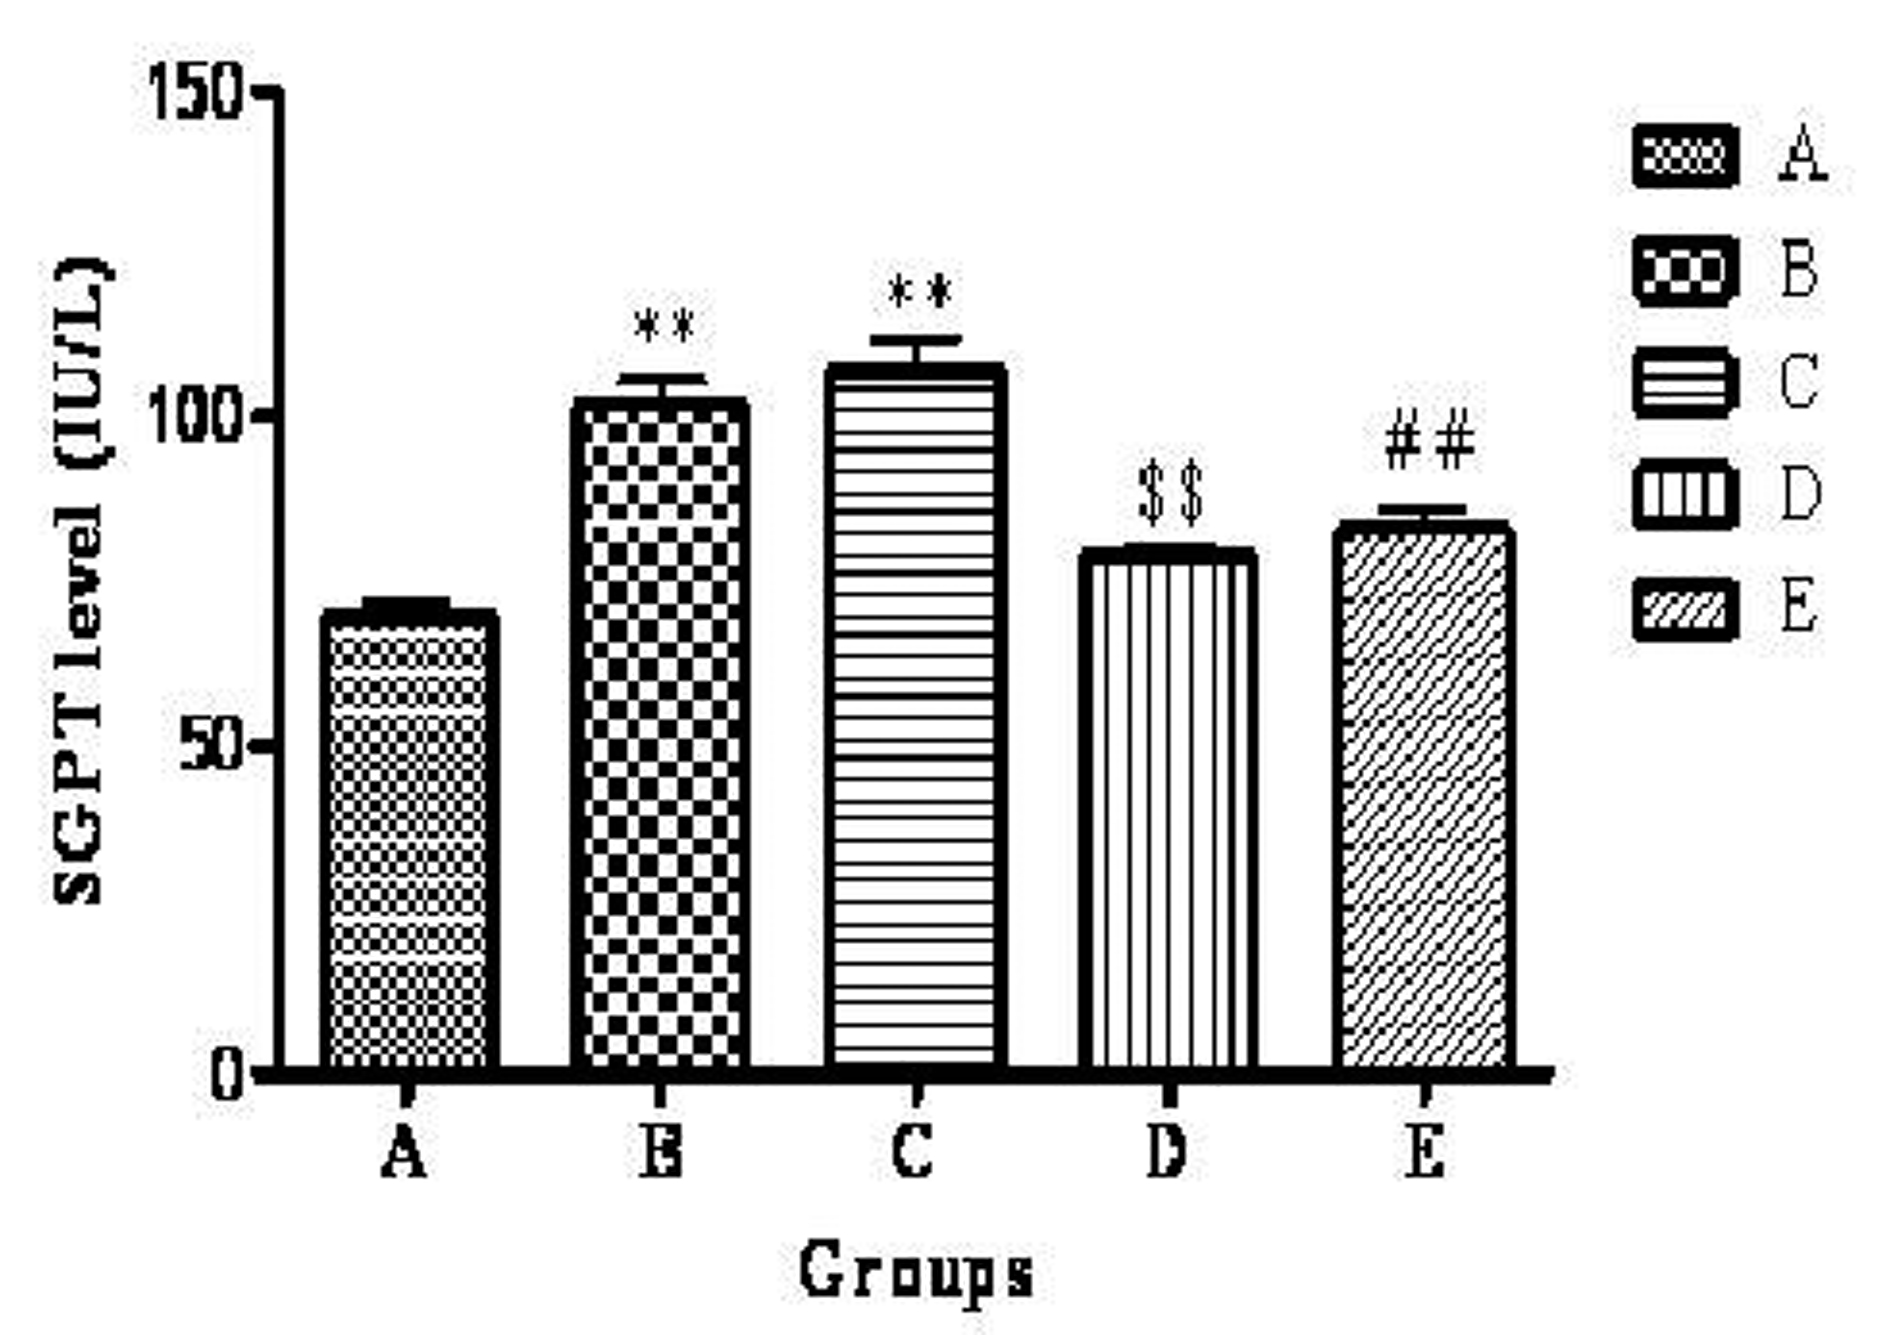
Figure 4. Effect of telmisartan on SGPT level. n =6; The values are expressed as mean ± SEM; **P <0.01 when compared to normal control, $$P < 0.01 when compared to OVX and ##P < 0.01 when compared to OVX + OLZ (One way ANOVA followed by Dunnett’s multiple comparison test). Group A: normal control, Group B: ovariectomy control, Group C: ovariectomy + olanzapine control, Group D: ovariectomy group treated with telmisartan, Group E: ovariectomy + olanzapine group treated with telmisartan.
Tables
Table 1. Effect of Telmisartan on Body Weight
| Group | Treatment | Body weight (g) |
|---|
| Initial | Final | Weight gain |
|---|
| n = 6; the values are expressed as Mean ± SEM; **P < 0.01 when compared to normal control, $P < 0.05 when compared to OVX and #P < 0.05 when compared to OVX + OLZ (One way ANOVA followed by Dunnett’s multiple comparison test). OVX: ovariectomy control, OVX + OLZ: ovariectomy + olanzapine control, OVX + TEL: ovariectomy group treated with telmisartan, OVX + OLZ + TEL: ovariectomy + olanzapine group treated with telmisartan. |
| A | Normal Control | 211.67 ± 6.009 | 223.50 ± 6.087 | 11.833 ± 0.910 |
| B | OVX Control | 213.33 ± 9.545 | 233.83 ± 10.879 | 20.500 ± 2.432** |
| C | OVX + OLZ Control | 220.00 ± 11.255 | 242.16 ± 11.677 | 22.167 ± 2.242** |
| D | OVX + TEL | 225.00 ± 9.574 | 211.50 ± 10.052 | 13.500 ± 1.544$ |
| E | OVX + OLZ +TEL | 220.00 ± 7.303 | 205.33 ± 7.401 | 14.667 ± 1.453# |
Table 2. Effect of Telmisartan on Total Cholesterol, Triglyceride, HDL-C, LDL-C and VLDL-C Levels
| Group | Treatment | Total Cholesterol | Triglyceride | HDL-C | LDL-C | VLDL-C |
|---|
| n = 6; the values are expressed as Mean ± SEM; **P < 0.01 when compared to normal control, $$P < 0.01, $P < 0.05 when compared to OVX and ##P < 0.05 when compared to OVX + OLZ (One way ANOVA followed by Dunnett’s multiple comparison test). OVX: ovariectomy control, OVX + OLZ: ovariectomy + olanzapine control, OVX + TEL: ovariectomy group treated with telmisartan, OVX + OLZ+TEL: ovariectomy + olanzapine group treated with telmisartan. |
| A | Normal Control | 65.233 ± 1.67 | 58.917 ± 3.36 | 33.33 ± 1.25 | 20.00 ± 1.15 | 11.783 ± 0.67 |
| B | OVX Control | 77.83 ± 1.95** | 88.08 ± 4.76** | 26.66 ± 0.71** | 33.60 ± 1.1** | 17.61 ± 0.95** |
| C | OVX + OLZ Control | 82.03 ± 1.85** | 99.16 ± 3.27** | 23.93 ± 0.60** | 38.16 ± 1.24** | 19.83 ± 0.65** |
| D | OVX + TEL | 70.61 ± 1.01$$ | 70.41 ± 3.83$ | 35.60 ± 0.96$$ | 20.43 ± 1.19$$ | 14.083 ± 0.76$ |
| E | OVX + OLZ + TEL | 74.23 ± 1.33## | 72.25 ± 6.26## | 37.95 ± 1.08## | 21.83 ± 0.98## | 14.45 ± 1.25## |
Table 3. Effect of Telmisartan on Liver and Kidneys Weight
| Group | Treatment | Liver weight | Kidney weight |
|---|
| n = 6; The values are expressed as mean ± SEM; **P < 0.01 when compared to normal control group, $$P < 0.01, $P < 0.05, when compared to OVX and ##P < 0.01, #P < 0.05 when compared to OVX + OLZ (One way ANOVA followed by Dunnet’s multiple comparison test). |
| A | Normal Control | 2.210 ± 0.06 | 0.680 ± 0.035 |
| B | OVX Control | 3.267 ± 0.123** | 0.872 ± 0.047** |
| C | OVX + OLZ Control | 3.350 ± 0.161** | 0.944 ± 0.045** |
| D | OVX + TEL | 2.382 ± 0.110$$ | 0.723 ± 0.025$ |
| E | OVX + OLZ + TEL | 2.367 ± 0.096## | 0.797 ± 0.032# |