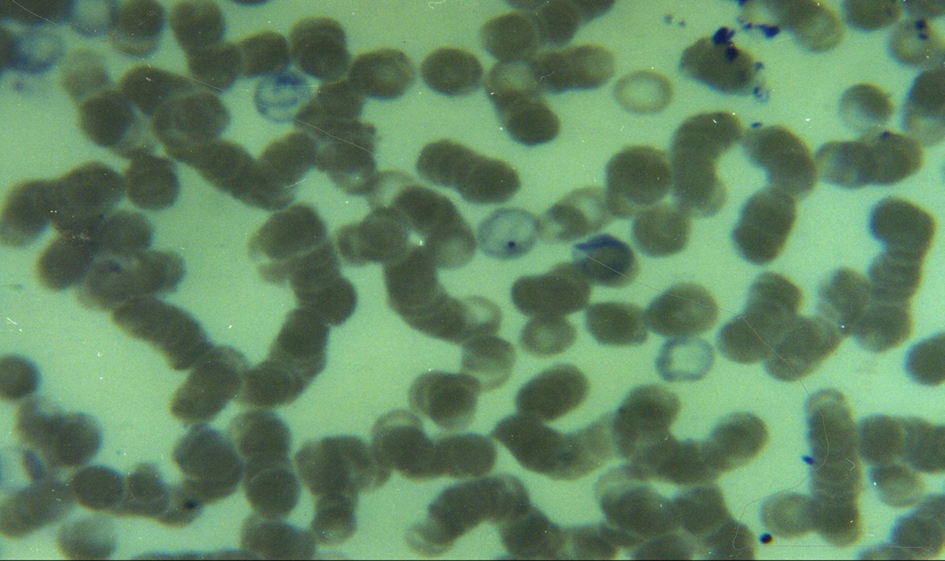
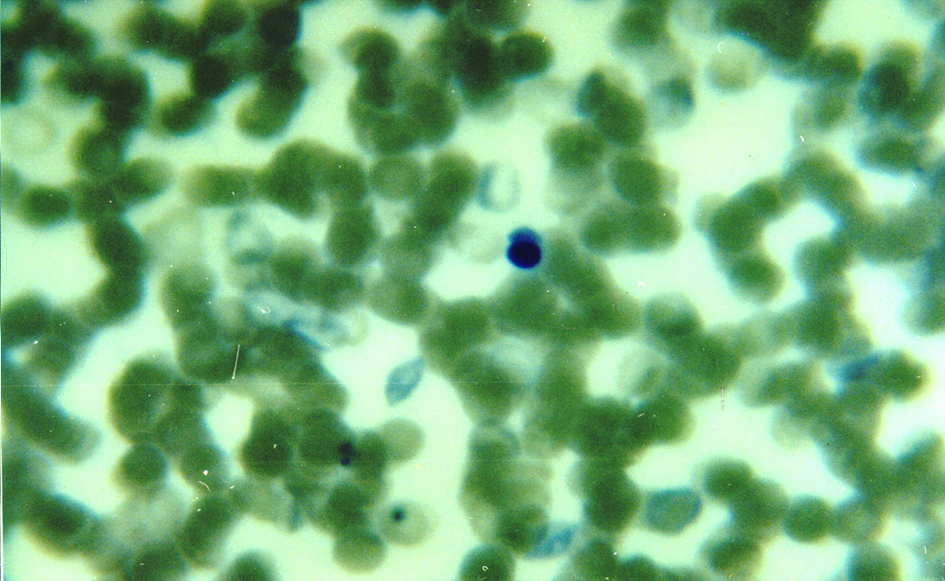
Figure 1. Blood smear of a 12-month old eSS diabetic showing polychromasia, a Howell-Jolly body (center) and Rouleaux formation. May-Grünwald-Giemsa stain. 100 ×.
| Journal of Endocrinology and Metabolism, ISSN 1923-2861 print, 1923-287X online, Open Access |
| Article copyright, the authors; Journal compilation copyright, J Endocrinol Metab and Elmer Press Inc |
| Journal website http://www.jofem.org |
Original Article
Volume 2, Number 4-5, October 2012, pages 171-175
Anemia in Spontaneously Type 2 Diabetic Rats With Renal Impairment
Figures
Table
| Rats | Bw (g) | G0 (mg/dL) | FH2 (µmol/L) | RBC (×106/ mm3) | Hb (g/dL) | Ht (%) | VMC (fl) | MCH (pg) | MCHC (g/dL) |
|---|---|---|---|---|---|---|---|---|---|
| Values expressed as mean ± standard deviation; fl: femtoliters. | |||||||||
| eSS (n =12) | 415±21 | 147 ± 15 | 182 ± 17 | 6.39 ±0.16 | 11.09± 0.22 | 34 ±0.84 | 49.3±1.1 | 17.2±0.17 | 34.9 ±0.29 |
| Wistar (n =11) | 410±36 | 103 ± 10 | 121 ± 14 | 7.88 ±0.07 | 13.9 ±0.13 | 39 ±0.41 | 48 ±0.22 | 16.5±0.06 | 34.3 ±0.09 |
| P | >0.05 | < 0.001 | < 0.001 | < 0.001 | <0.001 | <0.001 | >0.05 | <0.01 | > 0.05 |