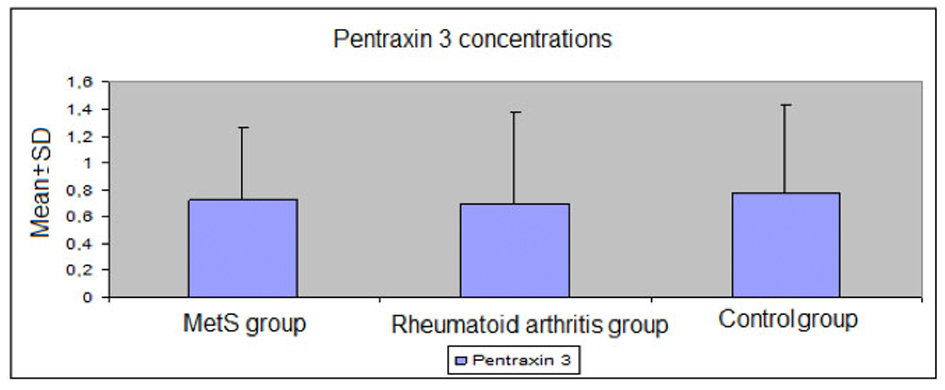
Figure 1. Plasma levels of pentraxin 3 in the study groups.
| Journal of Endocrinology and Metabolism, ISSN 1923-2861 print, 1923-287X online, Open Access |
| Article copyright, the authors; Journal compilation copyright, J Endocrinol Metab and Elmer Press Inc |
| Journal website http://www.jofem.org |
Original Article
Volume 2, Number 6, December 2012, pages 220-227
Pentraxin 3 Levels as a Marker of Chronic Inflammation in Patients With Metabolic Syndrome
Figure
Tables
| Total (n = 82) | Metabolic Syndrome (n = 27) | Rheumatoid Arthritis (n = 28) | Control (n = 27) | P | |
|---|---|---|---|---|---|
| Age (Mean ± SD) | 46.59 ± 9.27 | 47.70 ± 8.92 | 45.93 ± 13.18 | 46.18 ± 9.27 | 0.803 |
| Gender (n (%)) | |||||
| Males | 19 (23.2%) | 7 (25.9%) | 5 (17.9%) | 7 (25.9%) | 0.714 |
| Females | 63 (76.8%) | 20 (74.1%) | 23 (82.1%) | 20 (74.1%) | |
| Smoking (n (%)) | 9 (11%) | 2 (7.4%) | 0 (0%) | 7 (25.9%) | 0.007 |
| Alcohol (n (%)) | 4 (4.9%) | 1 (3.7%) | 0 (0%) | 3 (11.1%) | 0.151 |
| Hypertension (n (%)) | 15 (18.3%) | 15 (55.6%) | 0 (0%) | 0 (0%) | 0.001 |
| Total (n = 82) | Metabolic Syndrome (n = 27) | Rheumatoid Arthritis (n = 28) | Control (n = 27) | P | |
|---|---|---|---|---|---|
| BMI: Body Mass Index; SBP: Systolic Blood Pressure; DBP: Diastolic Blood Pressure. | |||||
| Height (cm) | 163.24 ± 8.20 | 165.18 ±9.26 | 160.7 ± 8.07 | 163.85 ± 6.73 | 0.124 |
| Weight (kg) | 75.41 ± 17.16 | 86.96 ±18.71 | 73.39 ± 14.25 | 65.94 ± 10.97 | 0.001 |
| BMI (kg/m2) | 28.29 ± 6.02 | 31.82 ±6.11 | 28.51 ± 5.67 | 24.54 ± 3.81 | 0.001 |
| Waist circumference (cm) | |||||
| Females | 89.82 ± 14.72 | 98.90 ±11.95 | 93.00 ± 13.38 | 77.10 ± 9.37 | 0.001 |
| Males | 94.00 ± 7.72 | 105.57 ±8.40 | 89.66 ± 14.57 | 85.57 ± 7.72 | 0.005 |
| SBP (mmHg) | 125.48 ±19.87 | 140.18 ±20.12 | 122.32 ± 16.96 | 114.07 ±12.48 | 0.001 |
| DBP (mmHg) | 81.22 ± 12.68 | 90.56 ±12.11 | 77.14 ± 10.13 | 76.11 ± 10.59 | 0.001 |
| Total (n = 82) | Metabolic Syndrome (n = 27) | Rheumatoid Arthritis (n = 28) | Control (n = 27) | P | |
|---|---|---|---|---|---|
| FPG: Fasting plazma glucose; Total-C: Total cholesterol; HDL-C: High density lipoprotein cholesterol; LDL-C: Low density lipoprotein cholesterol; TG: Triglyceride; HOMA-IR: Homeostasis model assessment insulin resistance; Non-HDL-C: Non high density lipoprotein cholesterol; CRP: C-reactive protein. | |||||
| FPG (mg/dL) | 90.95 ±12.99 | 99.03 ± 11.54 | 87.39 ± 12.86 | 86.55 ±10.94 | 0.001 |
| Total-C (mg/dL) | 222.64 ±45.76 | 230.33 ± 50.28 | 215.03 ± 42.74 | 222.85 ±44.44 | 0.469 |
| HDL-C (mg/dL) | 51.91 ±14.27 | 40.92 ± 9.09 | 57.39 ± 13.61 | 57.22 ±13.14 | 0.001 |
| LDL-C (mg/dL) | 144.74 ±37.15 | 154.40 ± 39.06 | 134.71 ± 33.41 | 145.48 ±37.55 | 0.144 |
| TG (mg/dL) | 155.66 ±90.54 | 233.96 ± 90.79 | 128.07 ± 62.42 | 105.96 ±59.13 | 0.001 |
| Uric acid (mg/dL) | 4.57 ± 1.31 | 5.29 ± 1.23 | 4.03 ± 1.27 | 4.41 ± 1.11 | 0.003 |
| Insulin (µU/mL) | 7.78 ± 5.96 | 11.60 ± 8.09 | 6.71 ± 4.07 | 5.05 ± 1.95 | 0.001 |
| HOMA-IR | 1.82 ± 1.56 | 2.89 ± 2.11 | 1.47 ± 0.98 | 1.10 ± 0.52 | 0.001 |
| Total-C/HDL-C | 4.53 ± 1.26 | 5.69 ± 0.85 | 3.89 ± 0.96 | 4.04 ± 1.08 | 0.001 |
| TG/HDL-C | 3.45 ± 2.52 | 5.87 ± 2.28 | 2.49 ± 1.84 | 2.02 ± 1.34 | 0.001 |
| Non-HDL-C | 170.73 ±43.79 | 189.41 ± 43.80 | 157.64 ± 39.78 | 165.63 ±42.87 | 0.019 |
| Sedimentation | 27.85 ±16.61 | 33.44 ± 16.24 | 32.14 ± 18.02 | 17.78 ±10.05 | 0.001 |
| CRP | 0.67 ± 1.14 | 1.01 ± 1.82 | 0.71 ± 0.68 | 0.26 ± 0.14 | 0.001 |
| Pentraxin 3 | 0.73 ± 0.62 | 0.73 ± 0.53 | 0.70 ± 0.67 | 0.78 ± 0.65 | 0.859 |
| Metabolic Syndrome vs. Rheumatoid Arthritis (P) | Metabolic Syndrome vs. Control (P) | Rheumatoid Arthritis vs. Control (P) | |
|---|---|---|---|
| Turkey HSD test. FPG: Fasting plazma glucose; Total-C: Total cholesterol; HDL-C: High density lipoprotein cholesterol; LDL-C: Low density lipoprotein cholesterol; TG: Triglyceride; HOMA-IR: Homeostasis model assessment insulin resistance; Non-HDL-C: Non high density lipoprotein cholesterol; CRP: C-reactive protein. | |||
| FPG (mg/dL) | 0.001 | 0.001 | 0.963 |
| HDL-C (mg/dL) | 0.001 | 0.001 | 0.999 |
| TG (mg/dL) | 0.001 | 0.001 | 0.081 |
| Uric acid (mg/dL) | 0.001 | 0.013 | 0.252 |
| Insulin (µU/mL) | 0.004 | 0.001 | 0.216 |
| HOMA-IR | 0.001 | 0.001 | 0.249 |
| Total-C/HDL-C | 0.001 | 0.001 | 0.820 |
| TG/HDL-C | 0.001 | 0.001 | 0.239 |
| Non-HDL-C | 0.018 | 0.102 | 0.763 |
| Sedimentation | 0.501 | 0.001 | 0.001 |
| CRP | 0.424 | 0.001 | 0.001 |
| All cases | PTX 3 | |
|---|---|---|
| r | P | |
| BMI: Body Mass Index; SBP: Systolic Blood Pressure; DBP: Diastolic Blood Pressure; FPG: Fasting plazma glucose; Total-C: Total cholesterol; HDL-C: High density lipoprotein cholesterol; LDL-C: Low density lipoprotein cholesterol; TG: Triglyceride; HOMA-IR: Homeostasis model assessment insulin resistance; Non-HDL-C: Non high density lipoprotein cholesterol; CRP: C-reactive protein. | ||
| Age | 0.016 | 0.886 |
| BMI (kg/m2) | ||
| Females | -0.075 | 0.559 |
| Males | -0.339 | 0.156 |
| Waist circumference (cm) | ||
| Females | -0.074 | 0.565 |
| Males | -0.075 | 0.559 |
| SBP (mmHg) | 0.061 | 0.886 |
| DBP (mmHg) | 0.107 | 0.338 |
| FPG (mg/dL) | 0.007 | 0.949 |
| Uric acid (mg/dL) | 0.050 | 0.657 |
| Total-C (mg/dL) | -0.126 | 0.258 |
| LDL-C (mg/dL) | -0.109 | 0.330 |
| TG (mg/dL) | -0.135 | 0.225 |
| HDL-C (mg/dL) | -0.012 | 0.913 |
| TG/HDL-C | -0.085 | 0.446 |
| Total-C/HDL-C | -0.075 | 0.503 |
| Non-HDL-C | -0.161 | 0.149 |
| Insulin (µU/mL) | -0.110 | 0.324 |
| HOMA-IR | -0.106 | 0.344 |
| Sedimentation | 0.008 | 0.943 |
| CRP | 0.121 | 0.281 |