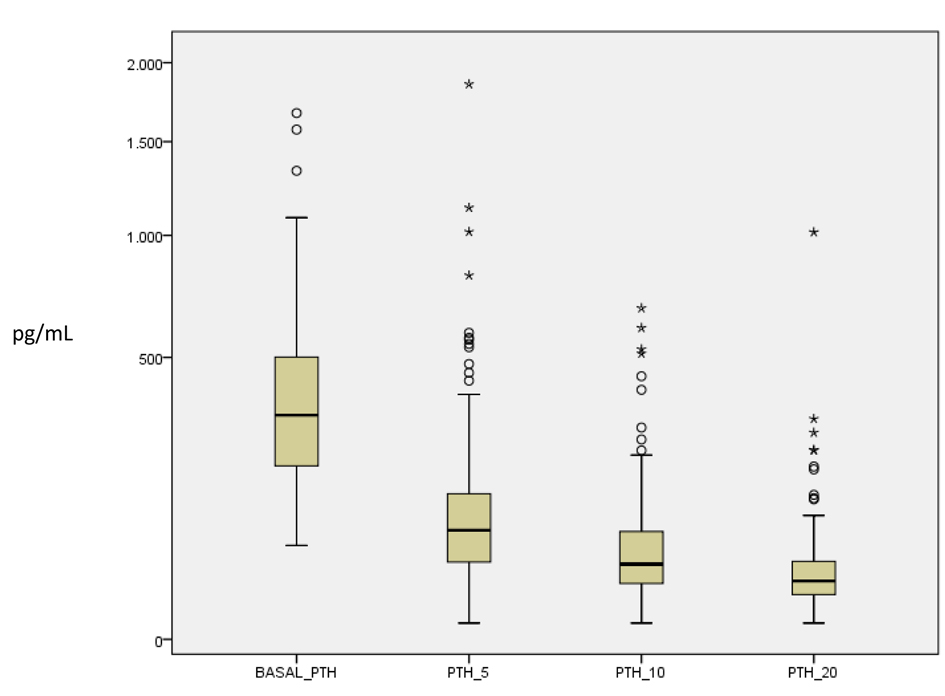
Figure 1. Boxplot chart of the PTH levels before and 5, 10 and 20 minutes after excision of the parathyroid gland.
| Journal of Endocrinology and Metabolism, ISSN 1923-2861 print, 1923-287X online, Open Access |
| Article copyright, the authors; Journal compilation copyright, J Endocrinol Metab and Elmer Press Inc |
| Journal website http://www.jofem.org |
Original Article
Volume 3, Number 4-5, October 2013, pages 98-104
Intraoperative Parathyroid Hormone is a Valuable Indicator of Long Term Cure in Primary Hyperparathyroidism
Figure
Tables
| 3 months | 6 months | 1 year | 2 years | 3 years | 4 years | 5 years | ||||||||
|---|---|---|---|---|---|---|---|---|---|---|---|---|---|---|
| Ca | PTH | Ca | PTH | Ca | PTH | Ca | PTH | Ca | PTH | Ca | PTH | Ca | PTH | |
| N | 64 | 53 | 69 | 65 | 54 | 53 | 51 | 53 | 28 | 23 | 20 | 15 | 14 | 13 |
| Median | 9.2 | 69.6 | 9.2 | 60.3 | 9.2 | 46.6 | 9.4 | 49.4 | 9.2 | 52.4 | 9.1 | 62.9 | 9.2 | 57.4 |
| Inter-quartile range | 0.9 | 74.6 | 0.6 | 59.1 | 0.6 | 38.3 | 0.6 | 50.4 | 0.5 | 56.7 | 0.6 | 87.2 | 1.0 | 36.2 |
| Decreased (%) | 10.9 | 7.5 | 7.2 | 6.2 | 7.4 | 5.7 | 7.8 | 5.7 | 7.1 | 0.0 | 10.0 | 0.0 | 14.3 | 7.7 |
| Normal (%) | 84.4 | 37.7 | 89.9 | 52.3 | 88.9 | 73.6 | 88.2 | 50.9 | 92.9 | 65.2 | 85.0 | 46.7 | 78.6 | 69.2 |
| Increased (%) | 4.7 | 54.7 | 2.9 | 41.5 | 3.7 | 20.8 | 3.9 | 43.4 | 0.0 | 34.8 | 5.0 | 53.3 | 7.1 | 23.1 |
| Group I | Group II | P | |
|---|---|---|---|
| Weight of the glands and levels of calcium and PTH are expressed as median and interquartile range. SI conversion factors: to convert calcium to millimoles per liter, multiply by 0.25; to convert PTH to nanograms per liter, multiply by 1. | |||
| Age (years) | 59.88 ± 15.89 | 62.93 ± 16.14 | 0.34 |
| Gender | < 0.01 | ||
| Female (nr patients) | 74 | 24 | |
| Male (nr patients) | 11 | 16 | |
| Weight removed glands (g) | 1.4 (2.2) | 3.0 (6.0) | < 0.01 |
| Final diagnosis | 0.15 | ||
| Single adenoma (nr patients) | 75 | 41 | |
| Multiglandular disease (nr patients) | 11 | 2 | |
| Highest pre-operative calcium (mg/dL) | 11.1 (1.4) | 11.7 (1.8) | < 0.01 |
| Highest pre-excision PTH | 259 (210.5) | 863 (1186.5) | < 0.01 |
| Intra-operative PTH - 10’ (pg/mL) | 30.1 (20.5) | 125.5 (124.9) | < 0.01 |
| Calcium 1.5 months (mg/dL) | 9.2 (0.8) | 9.1 (1.1) | 0.41 |
| Calcium 3 months (mg/dL) | 9.4 (0.8) | 9.0 (1.1) | 0.39 |
| Calcium 6 months (mg/dL) | 9.2 (0.6) | 9.2 (0.8) | 0.83 |
| Calcium 12 months (mg/dL) | 9.2 (0.6) | 9.2 (0.7) | 0.59 |
| PTH 1.5 months (pg/mL) | 58.0 (47.2) | 73.4 (98.7) | 0.16 |
| PTH 3 months (pg/mL) | 55.0 (49.9) | 124.5 (136.7) | < 0.01 |
| PTH 6 months (pg/mL) | 55.9 (48.2) | 83.1 (92.6) | < 0.01 |
| PTH 12 months (pg/mL) | 46.3 (39.6) | 61.0 (57.6) | 0.07 |
| Calcium and PTH at 6 months | 0.01 | ||
| Normal calcium/normal PTH (nr patients) | 26 | 9 | |
| Normal calcium/ high PTH (nr patients) | 9 | 13 | |