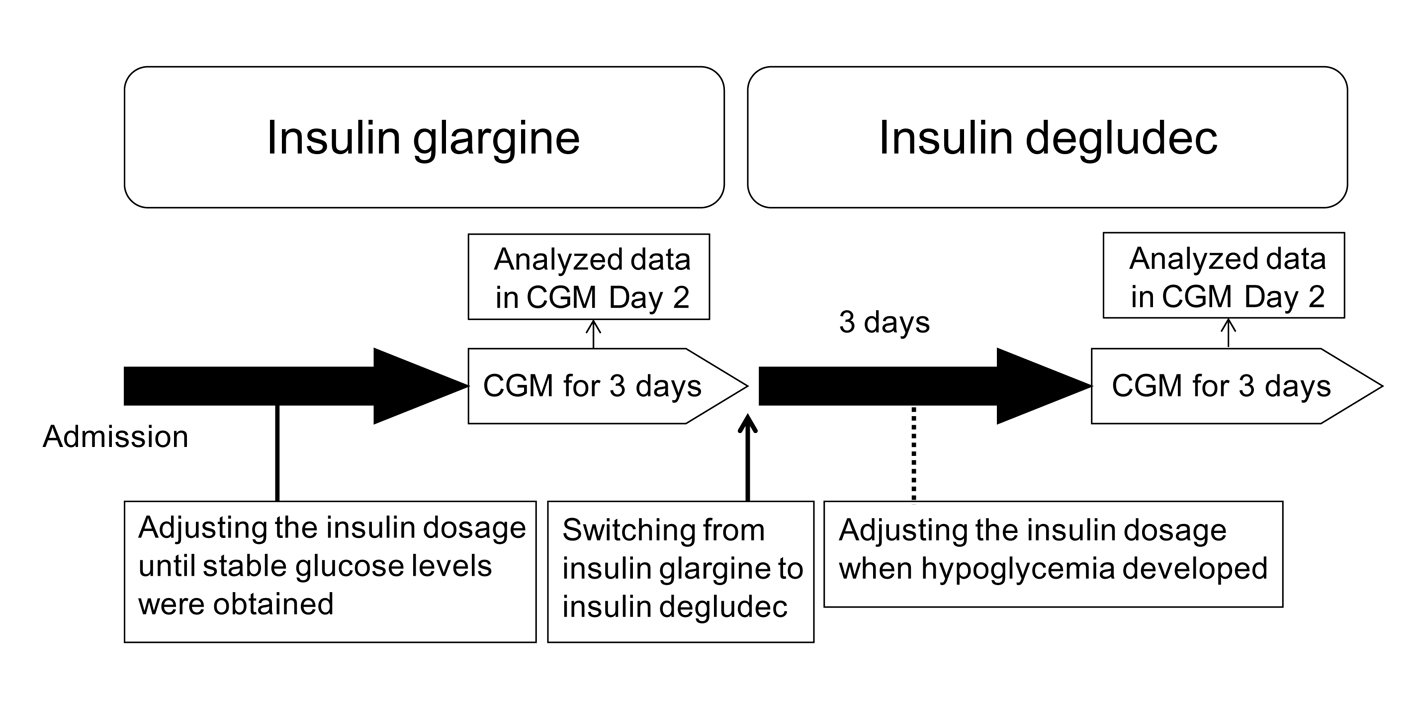
Figure 1. The protocol of the present study. CGM, continuous glucose monitoring.
| Journal of Endocrinology and Metabolism, ISSN 1923-2861 print, 1923-287X online, Open Access |
| Article copyright, the authors; Journal compilation copyright, J Endocrinol Metab and Elmer Press Inc |
| Journal website http://www.jofem.org |
Short Communication
Volume 3, Number 6, December 2013, pages 138-146
Comparison of Glycemic Variability by Using Insulin Glargine and Insulin Degludec in Japanese Patients With Type 1 Diabetes, Monitored by Continuous Glucose Monitoring: A Preliminary Report
Figures
Tables
| Patients | 1 | 2 | 3 | 4 |
|---|---|---|---|---|
| Age (years old) | 30 | 48 | 55 | 68 |
| Sex | Female | Male | Female | Female |
| Duration of disease (years) | 11 | 12 | 3 | 33 |
| Height (cm) | 154.7 | 170.0 | 157.6 | 148.5 |
| Weight (kg) | 55.1 | 55.8 | 63.9 | 56.6 |
| Body mass index (kg/m2) | 23.0 | 19.3 | 25.7 | 25.7 |
| HbA1c (%) | 11.0 | 9.5 | 10.0 | 7.4 |
| Serum C-peptide levels (ng/mL) | 0.08 | 0.06 | 0.11 | 0.46 |
| Urinary C-peptide levels (µg/day) | 1.9 | 8.1 | 8.2 | 25.3 |
| Anti-GAD antibodies (U/mL) | < 0.3 | < 0.3 | 7,200 | 21.0 |
| Anti-IA2 antibodies (U/mL) | < 0.4 | < 0.4 | 5.1 | < 0.4 |
| Patients | Bolus insulin (units) | Basal insulin (units) | Total daily insulin (units) | ||
|---|---|---|---|---|---|
| before breakfast | before lunch | before dinner | at bedtime | ||
| During the insulin glargine treatment | |||||
| 1 | 8 | 6 | 4 | 18 | 36 |
| 2 | 24 | 10 | 14 | 18 | 66 |
| 3 | 9 | 8 | 8 | 30 | 55 |
| 4 | 6 | 4 | 6 | 9 | 25 |
| During the insulin degludec treatment | |||||
| 1 | 8 | 6 | 4 | 18 | 36 |
| 2 | 18 | 10 | 14 | 16 | 58 |
| 3 | 7 | 6 | 6 | 29 | 48 |
| 4 | 6 | 4 | 6 | 9 | 25 |
| Insulin glargine | Insulin degludec | P value* | |
|---|---|---|---|
| Data present as median ± quartile deviation. *Statistical analyzed were done by the Mann-Whitney U test. | |||
| 24 h mean glucose levels (mg/dL) | 193.5 ± 57.0 | 119.6 ± 28.7 | 0.057 |
| 24 h area under the glucose curve (× 104 mg/dL•min) | 27.9 ± 6.21 | 17.2 ± 4.09 | 0.057 |
| SD of 24 h glucose levels | 50.8 ± 16.3 | 28.8 ± 14.7 | 0.083 |
| M-value | 156.8 ± 135.7 | 10.6 ± 7.0 | 0.021 |
| Mean amplitude of glycemic excursions | 92.4 ± 36.1 | 56.1 ± 33.5 | 0.309 |
| Time in hyperglycemia (> 180 mg/dL) (min) | 567.5 ± 486.3 | 32.5 ± 268.0 | 0.083 |
| Time in hypoglycemia (< 70 mg/dL) (min) | 0 | 0 ± 42.5 | 0.317 |