Figures
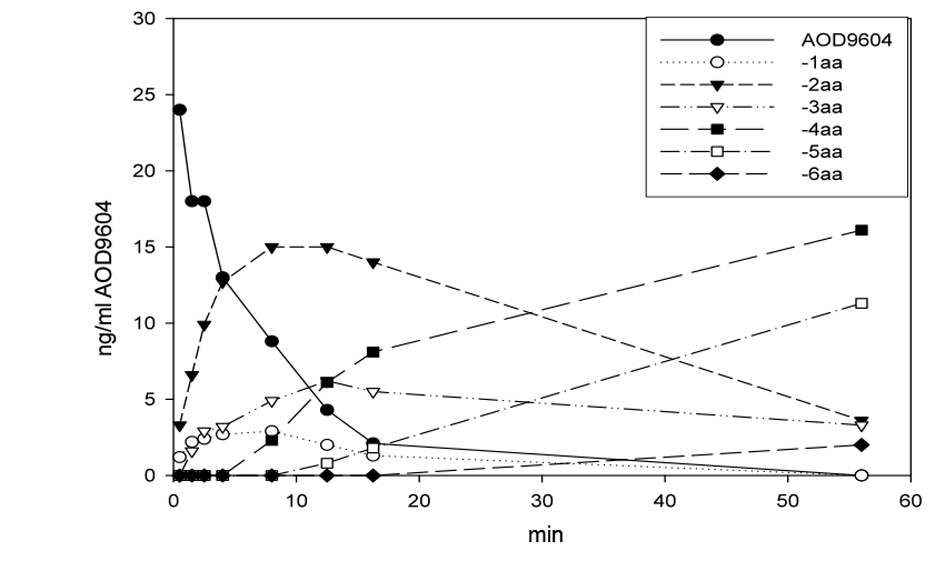
Figure 1. Degradation of AOD9604 in rat plasmain vitro at room temperature. After 56 min, the peptide is completely eliminated. The half-life is approximately 4 min. The appearance of AOD9604 amino-terminal truncated fragments (-xaa) is demonstrated.
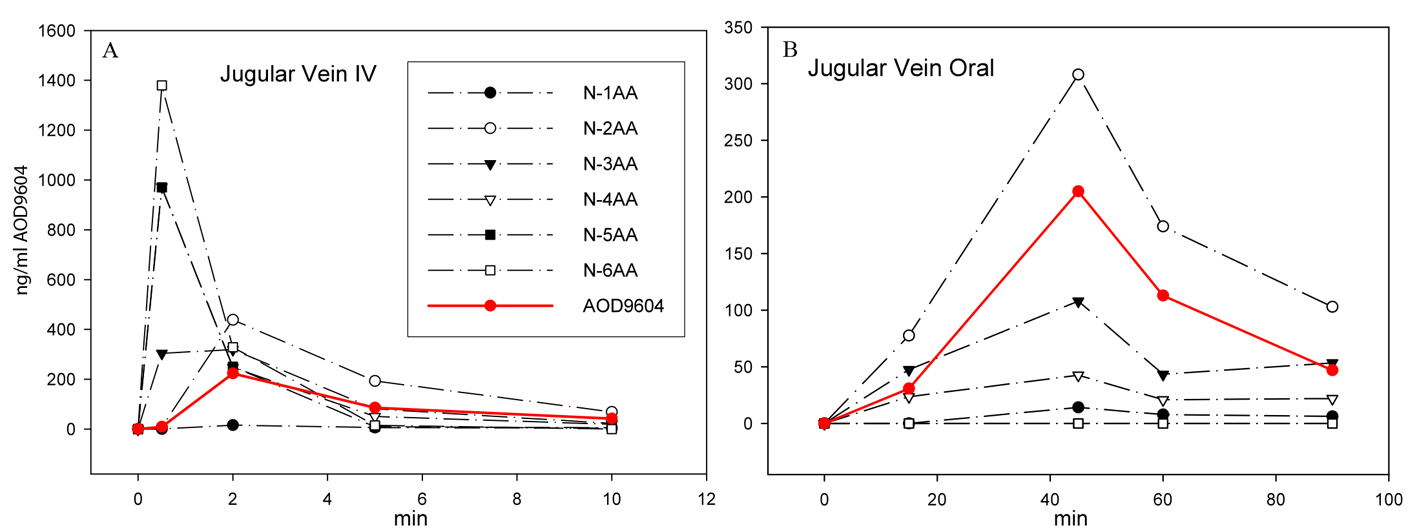
Figure 2. After IV (A) or oral (B) application of AOD9604 to two different pigs, the extracted plasma from jugular vein blood was analyzed by MS to quantitate AOD9604 and its degradants. The concentration of AOD9604 and its degradants (lacking 1 - 6 amino acids) in the plasma at different sampling times is indicated.
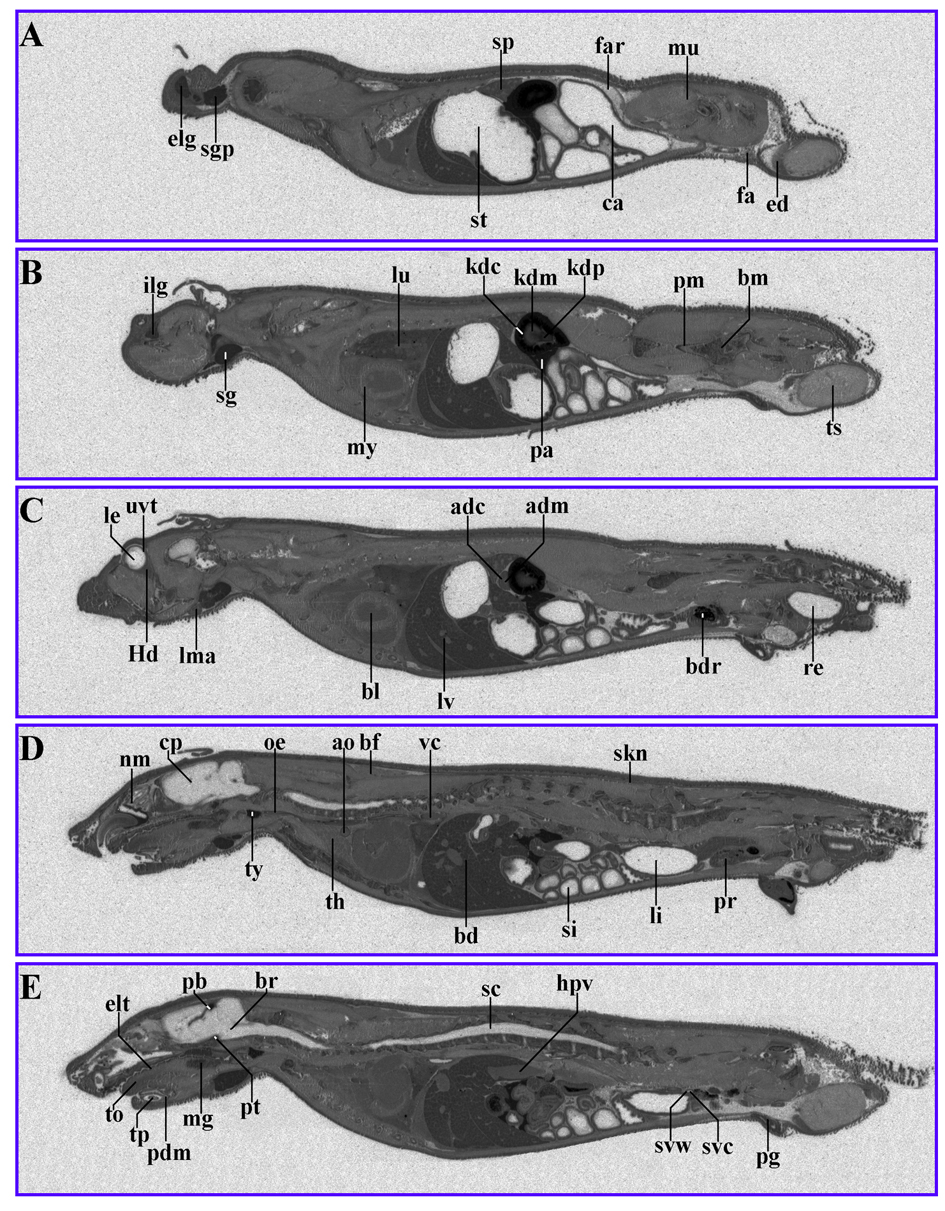
Figure 3. 14C-AOD9604 (5 mg/kg), labeled within the cysteines, was administered IV to rats. The animals were subsequently sectioned and subjected to quantitative whole-body radiography. (A-E): serial sections, 5 min after IV administration (slight digital brightness modification of image). Principal sites of localization are the pancreas, pineal body, thyroid, kidney cortex and liver.
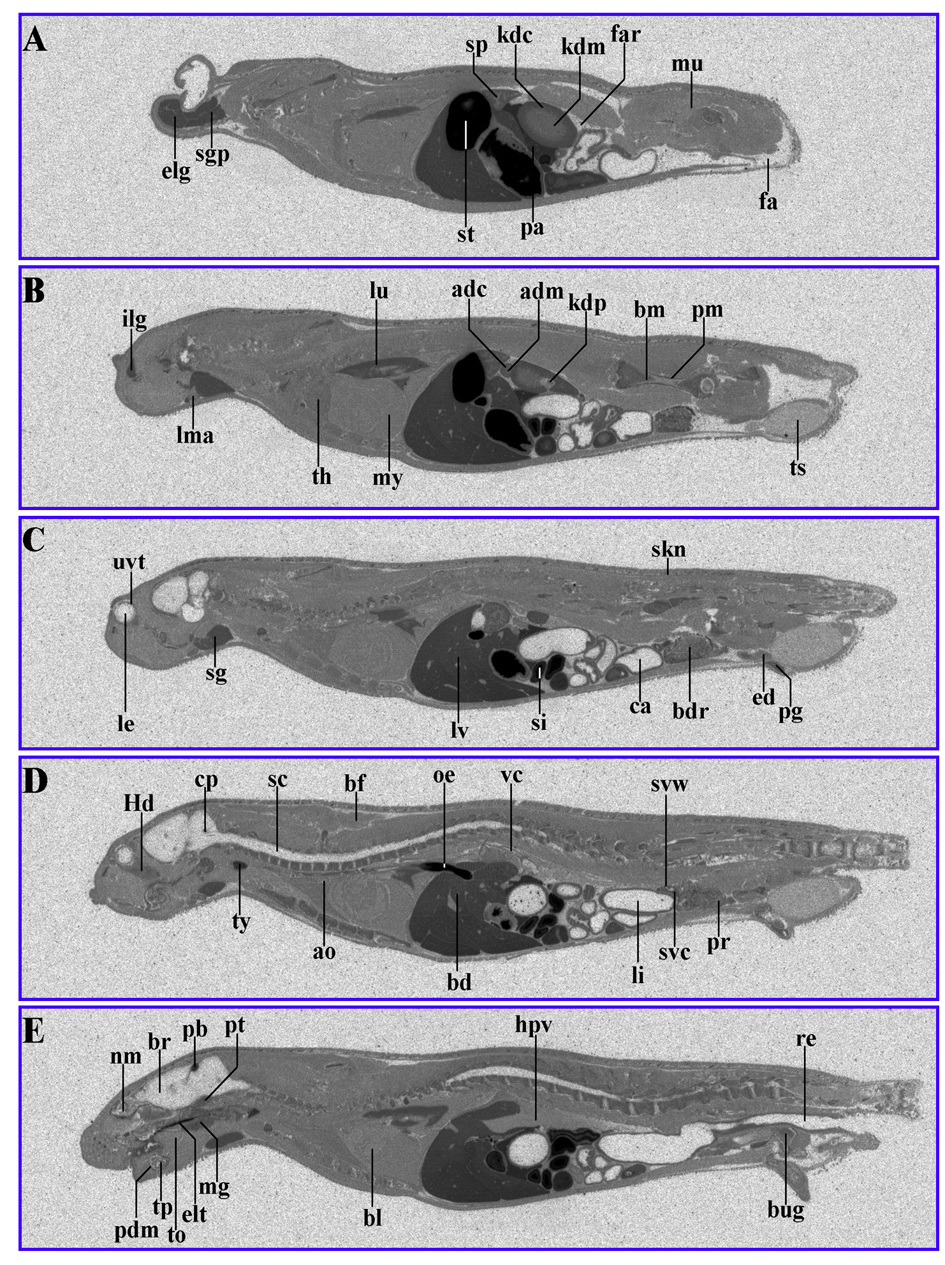
Figure 4. 14C-AOD9604 (5 mg/kg), labeled within the cysteines, was administered by oral gavage to rats. The animals were subsequently sectioned and subjected to quantitative whole-body radiography. (A-E): serial sections, 30 min after oral gavage administration. Principal sites of localization are pancreas, pineal body, thyroid, kidney cortex and liver and the upper gastrointestinal tract (stomach). It should be noted that later time points (for example, 24 h) are likely to represent degradants, so the data is not shown.
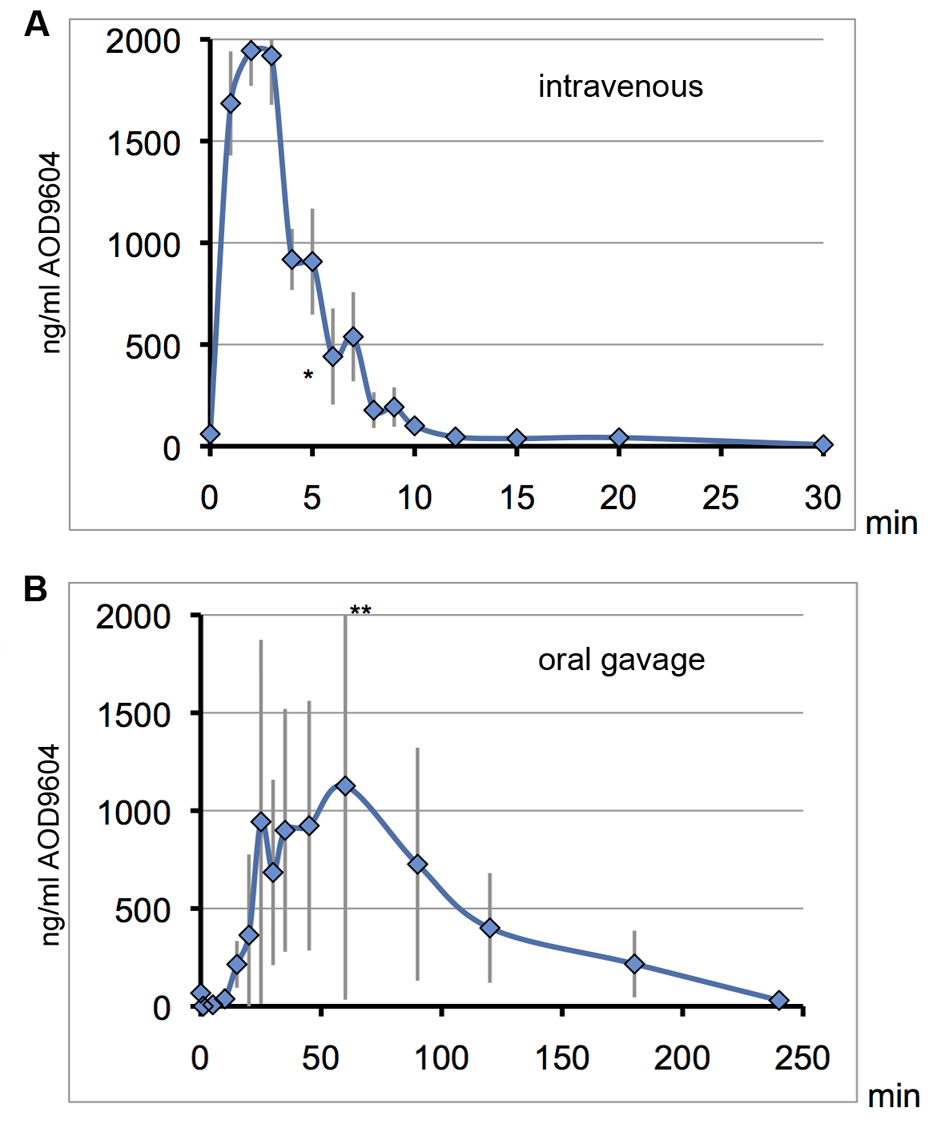
Figure 5. On consecutive days, the same 6 pigs received AOD9604 intravenously (A) or with oral gavage (B). Blood serum was analyzed for AOD9604 levels by immunoassay and concentrations are plotted against the sampling time. Error bars for the standard deviation are depicted in grey. *data point of one pig omitted due to an extremely high value indicating a technical error. **top error bar slightly cut off. (A) IV injection (400 µg/kg AOD9604): T1/2 = 3 min, Tmax = 2 min, Cmax = 1,944µg/mL, AUC = 12,743.42 (SD ± 625.3) ng/mL/min; (B) Oral gavage (2,000 µg/kg AOD9604): Cmax = 1,127 µg/mL, Tmax = 60 min, AUC = 108,630 (SD ± 32,654.3) ng/mL/min.
Tables
Table 1. Overview of Studies Contained in This Report
| Study type | Year | Species | Mode of Administration | (Run-in Phase) Study duration | Brief outcome summary |
|---|
| Genotoxicity - Ames test | 1999 | S. typhimurium E. coli | in vitro | ca. 2 weeks | No genotoxicological concerns |
| Genotoxicity - chromosomal aberration assay | 1999 | CHO cells | in vitro | ca. 3 weeks | No clastogenic activity,inconsistent evidence of interfering with cell cycling |
| Toxicology and Genotoxicity - bone marrow micronucleus | 2002 | Rat | IV | (15 days)
28 days repeated dose | No genotoxicological concerns, reduced body mass gain |
| 14C-AOD9604: Quantitative whole-body radiography | 2004 | Rat | in vitro, IV or oral | 1 day; 1 day | Label of various tissues and organs after IV or oral administration |
| Pharmacokinetics | 2000 | Pig | IV and oral with food | (2 weeks) 3 days of dosing | IV: rapid plasma clearance
oral: slower kinetics |
| Toxicology | 2006 | Rat | Oral gavage | (11 days) 6 months repeated dose | No toxicological concerns |
| Toxicology | 2004 | Cynomolgus monkey | Oral gavage | (5 - 11 weeks)
9 months
repeated dose | No toxicological concerns |
Table 2. Cytotoxicity to CHO Cells by Colony Forming Capacity, AOD9604 in Experiment 1
| Without S-9 (3 h) | With S-9 (3 h) |
|---|
| Dose µg/mL | Relative growth % | Dose µg/mL | Relative growth % |
|---|
| 1Precipitation observed. |
| 0 | 100 | 0 | 100 |
| 20 | 91.56 | 20 | 91.81 |
| 50 | 92.29 | 50 | 96.58 |
| 100 | 85.80 | 100 | 97.88 |
| 2001 | 108.05 | 2001 | 108.44 |
Table 3. Cytotoxicity to CHO Cells by Colony Forming Capacity, AOD9604 in Experiment 2
| Without S-9 (1.5 cell cycle) | With S-9 (3 h) |
|---|
| Dose µg/mL | Relative growth % | Dose µg/mL | Relative growth % |
|---|
| 1Precipitation observed. |
| 0 | 100 | 0 | 100 |
| 20 | 162.72 | 201 | 62.88 |
| 100 | 84.90 | 1001 | 48.79 |
| 200 | 70.29 | 2001 | 46.54 |
| 5001 | 3.55 | - | - |
| 1,0001 | 0.00 | - | - |
Table 4. Abbreviations
| Adrenal cortex | adc |
| Adrenal medulla | adm |
| Aorta | ao |
| Bile ducts | bd |
| Bladder | bdr |
| Blood | bl |
| Bone marrow | bm |
| Brain | br |
| Brown fat | bf |
| Bulbo-urethral gland | bug |
| Caecum | ca |
| Choroid plexus | cp |
| Epididymis | ed |
| Epithelial lining (tongue) | elt |
| Exorbital lachrymal gland | elg |
| Harderian gland | Hd |
| Hepatic portal vein | hpv |
| Intra-orbital lachrymal gland | ilg |
| Kidney cortex | kdc |
| Kidney medulla | kdm |
| Kidney pyramid | kdp |
| Large intestine | li |
| Lens | le |
| Liver | lv |
| Lung | lu |
| Mandibular lymph nodes | lma |
| Mucus gland | mg |
| Muscle | mu |
| Myocardium | my |
| Nasal mucosa | nm |
| Non-pigmented skin | skn |
| Oesophagus | oe |
| Pancreas | pa |
| Parotid salivary gland | sgp |
| Peridontal membrane | pdm |
| Periosteum | pm |
| Peri-renal fat | far |
| Pineal body | pb |
| Pituitary | pt |
| Preputial gland | pg |
| Prostate | pr |
| Rectum | re |
| Salivary glands | sg |
| Seminal vesicle contents | svc |
| Seminal vesicle wall | svw |
| Small intestine | si |
| Spinal cord | sc |
| Spleen | sp |
| Stomach | st |
| Testis | ts |
| Thymus | th |
| Thyroid | ty |
| Tongue | to |
| Tooth pulp | tp |
| Uveal tract | uvt |
| Vena cava | vc |
| White fat | fa |