Figures
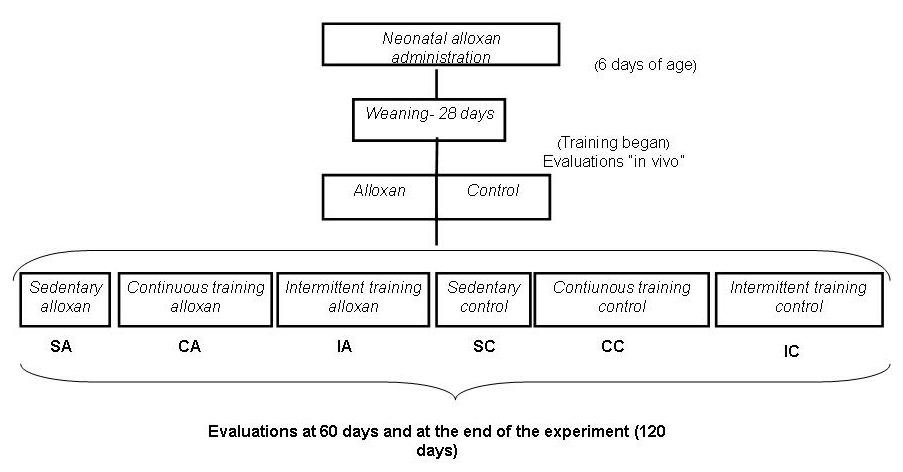
Figure 1. Experimental design.
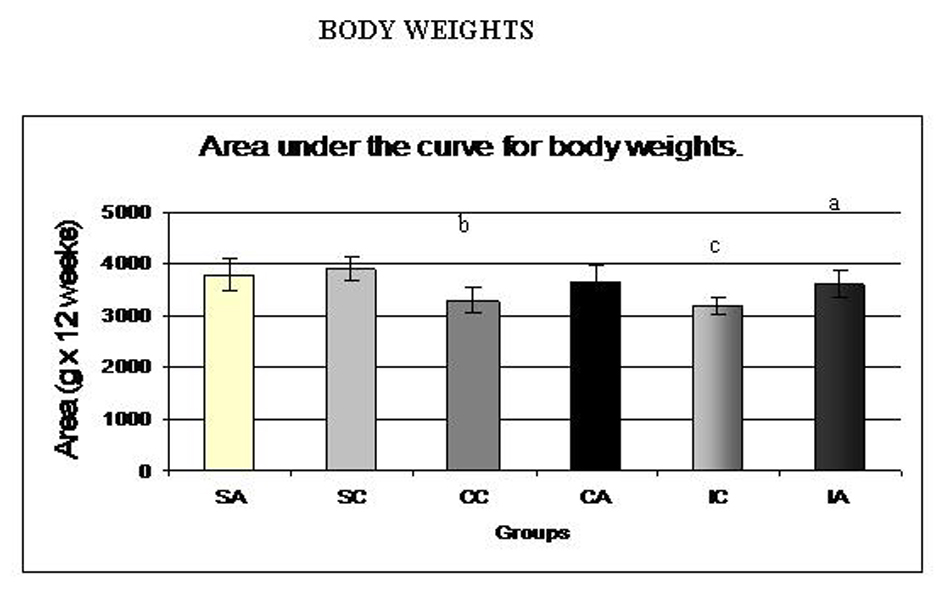
Figure 2. Area under the curve for body weights of the animals at weaning (28 days) until the end of the experiment (120 days). Results are expressed as means ± standard deviation of 10 animals per group. SA: Sedentary alloxan; SC: Sedentary control; CC: Continuous training control; CA: Continuous training alloxan; IC: Intermittent training control and IA: Intermittent training alloxan. Different letters indicate a statistically significant difference among groups (Two-way ANOVA (3 x 2) and Bonferroni post hoc test, P < 0.05). a: statistically significant difference for IA versus IC; b: statistically significant difference for SC versus CC; c: statistically significant difference for SC versus IC.
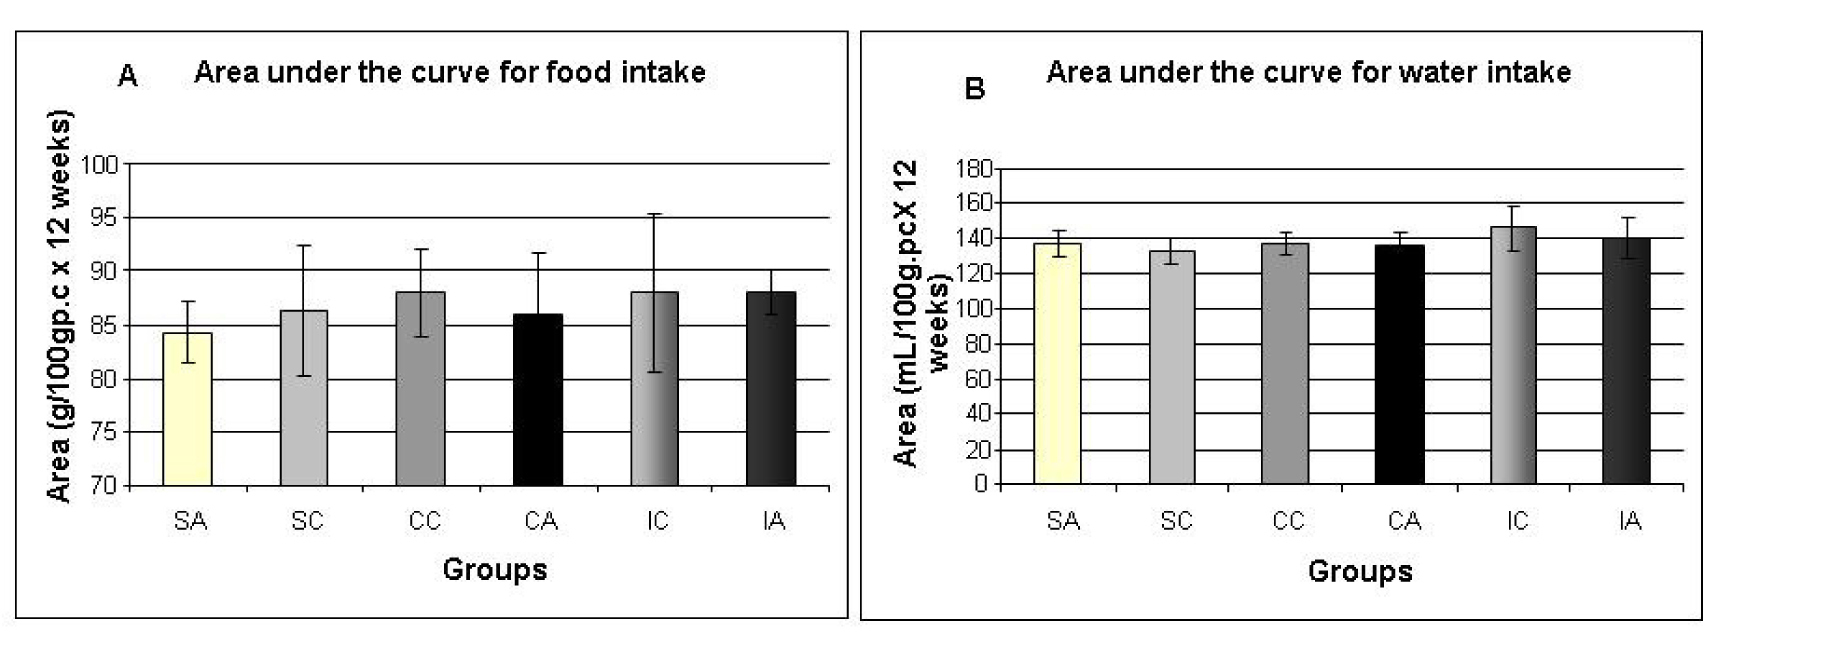
Figure 3. Area under the curve for food intake (A) and water intake (B) of the animals at weaning (28 days) until the end of the experiment (120 days). Results are expressed as means ± standard deviation of 10 animals per group. SA: Sedentary alloxan; SC: Sedentary control; CC: Continuous training control; CA: Continuous training alloxan; IC: Intermittent training control and IA: Intermittent training alloxan.
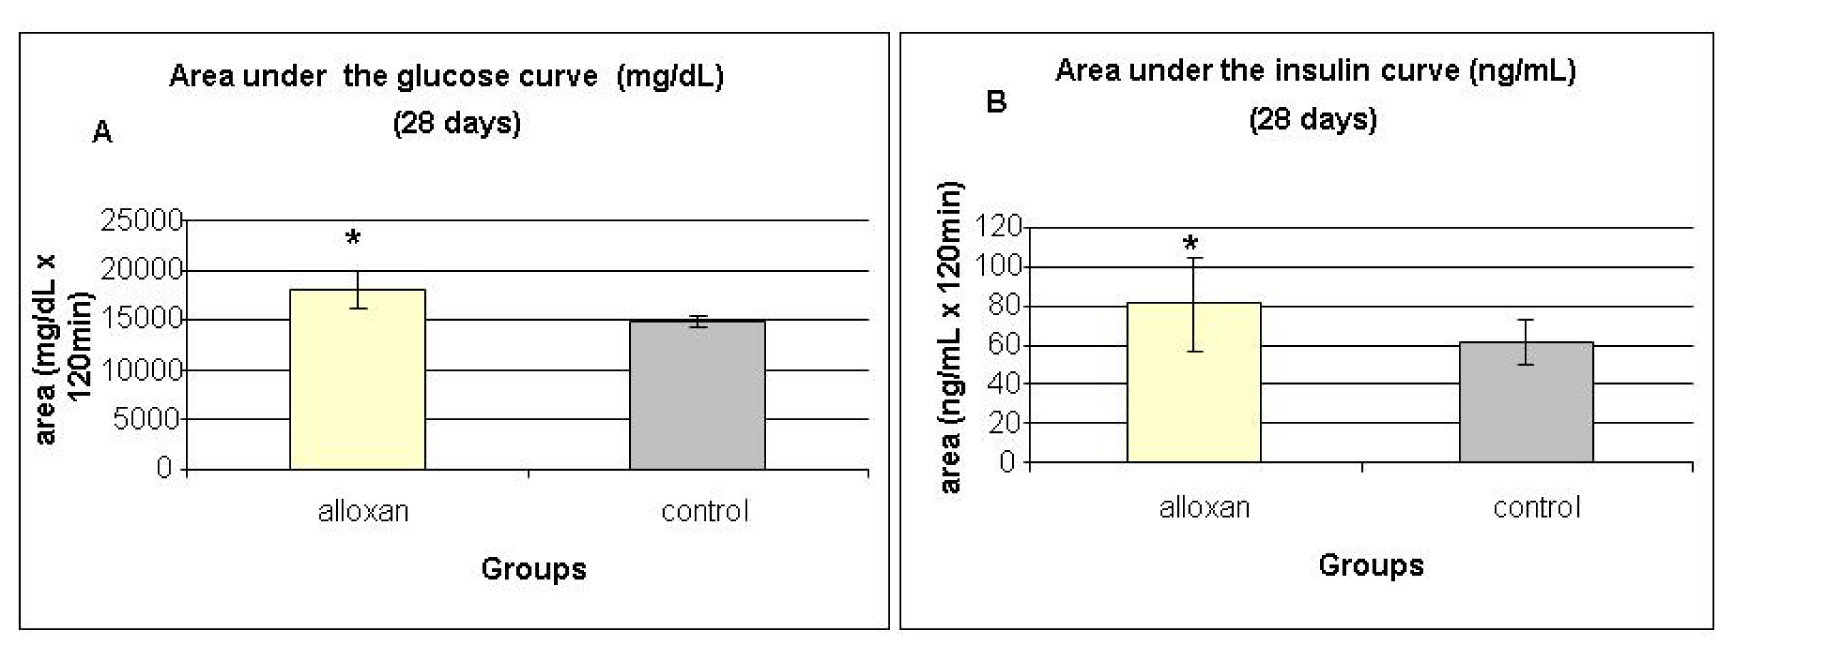
Figure 4. Area under the glucose curve (A) and area under the insulin curve (B) at weaning (28 days) during the glucose tolerance test (OGTT). Results are expressed as means ± standard deviation of 10 animals per group. *: statistically significant different ( student test, P < 0.05) from control group.
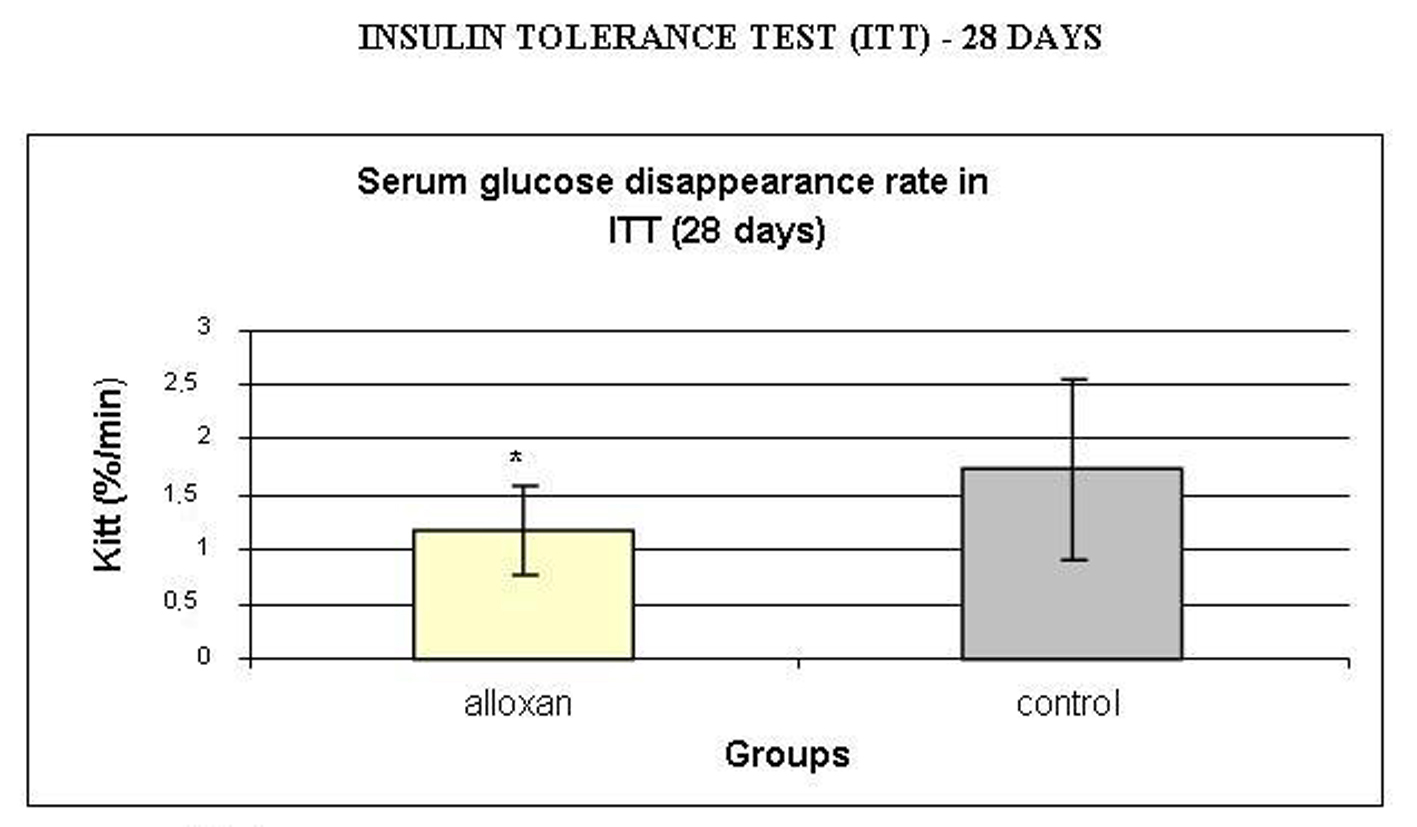
Figure 5. Serum glucose disappearance rate (Kitt, %/min) during insulin tolerance test (ITT). Results are expressed as means ± standard deviation of 10 animals per group. *: statistically significant different (student test, P < 0.05) from control group.
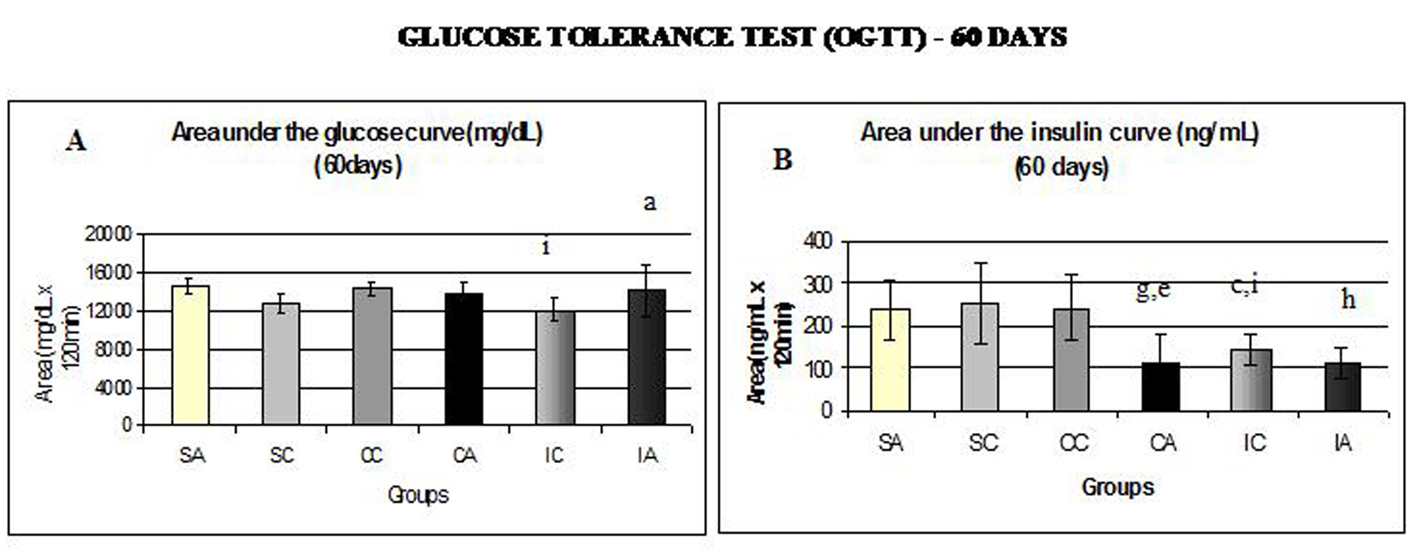
Figure 6. Area under the glucose curve (A) at 60 days and area under the insulin curve (B) at 60 days during glucose tolerance test (OGTT). Results are expressed as means ± standard deviation of 10 animals per group. SA: Sedentary alloxan; SC: Sedentary control; CC: Continuous training control; CA: Continuous training alloxan; IC: Intermittent training control and IA: Intermittent training alloxan. Different letters indicate a statistically significant difference among groups (Two-way ANOVA (3 x 2) and Bonferroni post hoc test, P < 0.05), referring to area under the glucose and insulin curve. a: statistically significant differences for IA versus IC; c: statistically significant differences for SC versus IC; e: statistically significant differences for CA versus CC; g: statistically significant differences for SA versus CA; h: statistically significant differences for SA versus IA; i: statistically significant differences for CC versus IC.
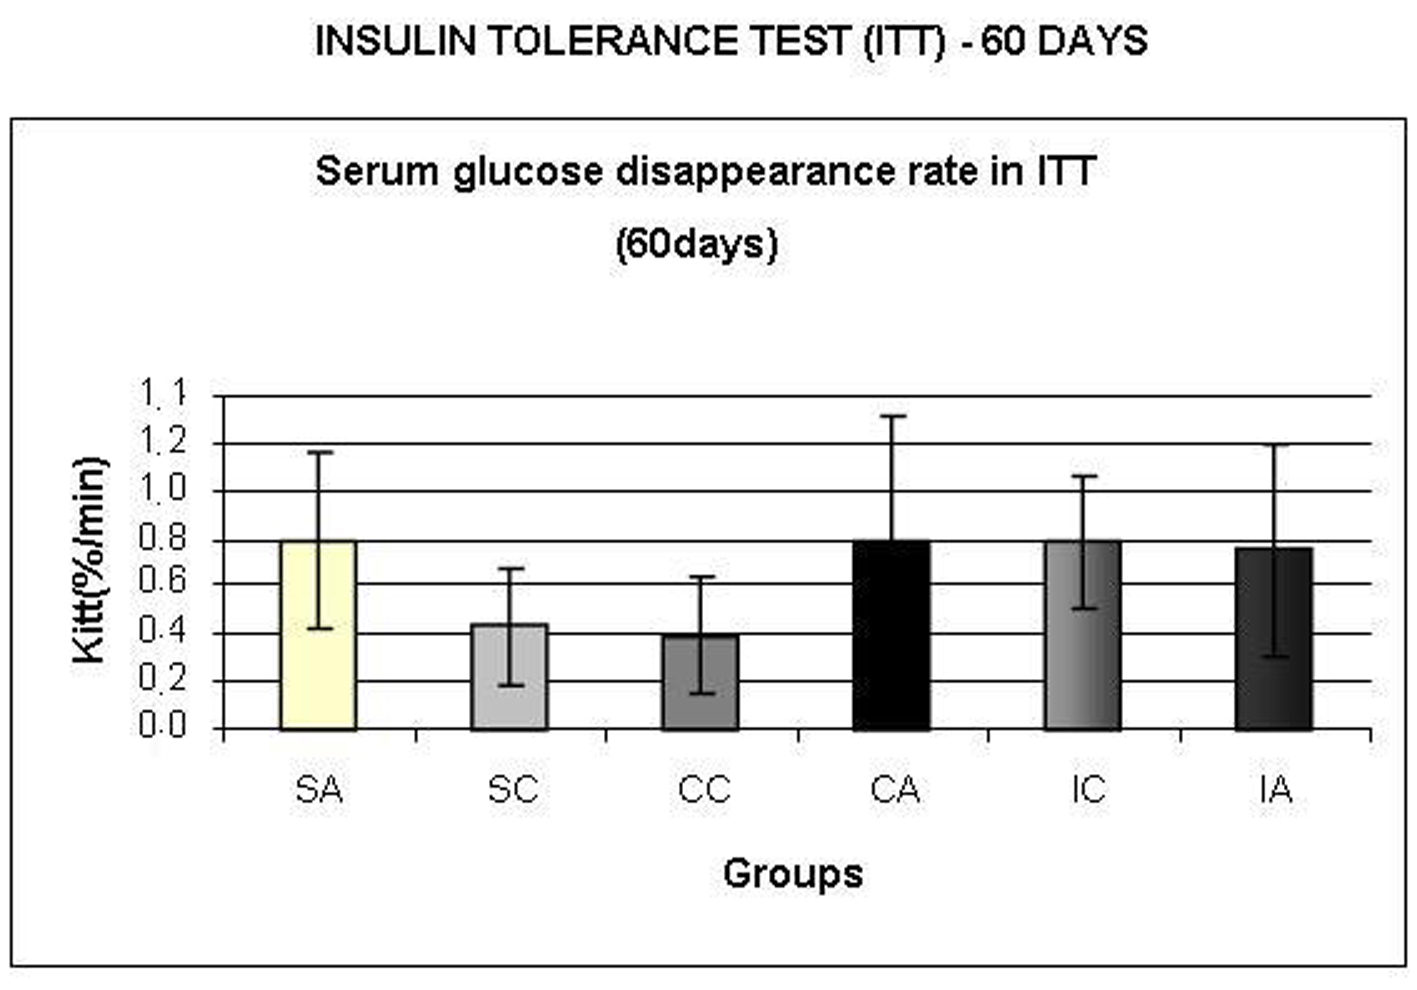
Figure 7. Serum glucose disappearance rate (Kitt,) during insulin tolerance test (ITT) at 60 days. Results are expressed as means ± standard deviation of 10 animals per group. SA: Sedentary alloxan; SC: Sedentary control; CC: Continuous training control; CA: Continuous training alloxan; IC: Intermittent training control and IA: Intermittent training alloxan.
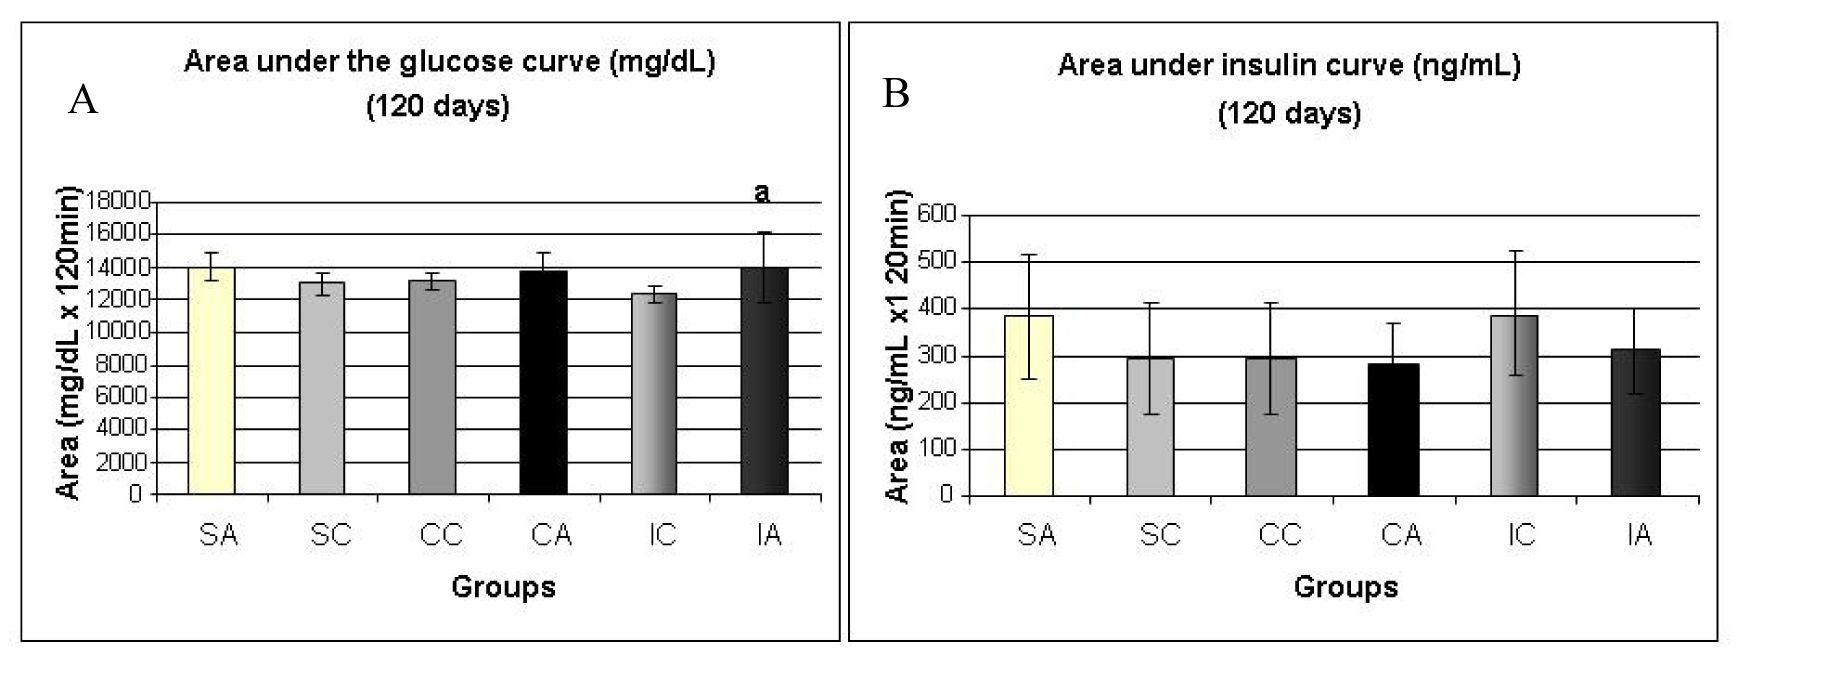
Figure 8. Area under the glucose curve (A) at 120 days and area under the insulin curve (B) at 120 days during the glucose tolerance test (OGTT). Results are expressed as means ± standard deviation of 10 animals per group. SA: Sedentary alloxan; SC: Sedentary control; CC: Continuous training control; CA: Continuous training alloxan; IC: Intermittent training control and IA: Intermittent training alloxan. Different letters indicate a statistically significant difference among groups (Two-way ANOVA (3 x 2) and Bonferroni post hoc test, P < 0.05), referring to area under the glucose curve a, statistically significant differences for IA versus IC.
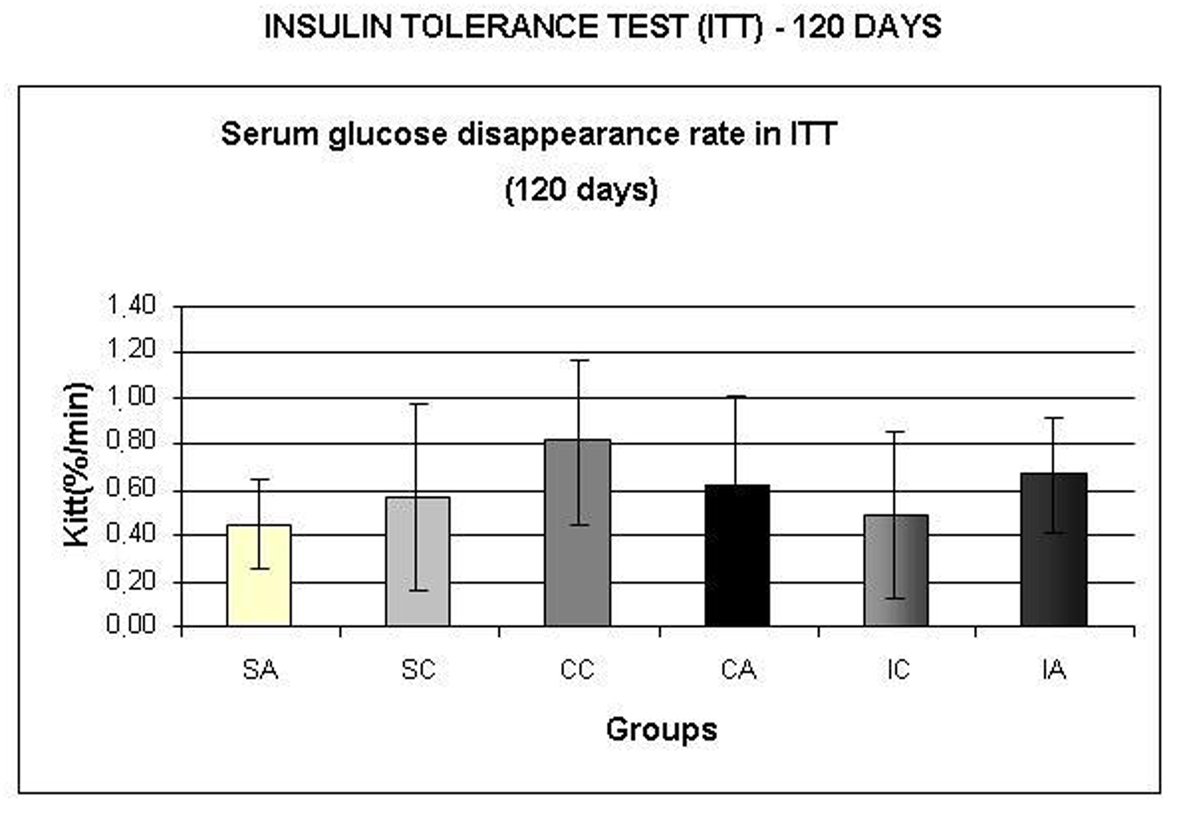
Figure 9. Serum glucose disappearance test (Kitt,) during insulin tolerance test (ITT) at 120 days. Results are expressed as means± standard deviation of 10 animals per group. SA: Sedentary alloxan; SC: Sedentary control; CC: Continuous training control; CA: Continuous training alloxan; IC: Intermittent training control and IA: Intermittent training alloxan.
Tables
Table 1. Serum Glucose, Insulin Concentrations and Gastrocnemius Muscle, Liver and Heart Glycogen Concentrations at 120 days
| SA | SC | CC |
|---|
| Serum glucose (mg/dL) | 94.68 ± 5.51 | 88.73 ± 7.90 | 88.80 ± 6.83 |
| Serum insulin (ng/mL) | 2.40 ± 1.97 | 2.83 ± 1.90 | 2.98 ± 2.22 |
| Gastrocnemius glycogen (mg/100 mg) | 0.44 ± 0.11 | 0.40 ± 0.12 | 0.50 ± 0.06 |
| Liver glycogen (mg/100 mg) | 7.36 ± 0.98 | 7.18 ± 0.94 | 7.64 ± 1.11 |
| Heart glycogen (mg/100 mg) | 0.148 ± 0.022 | 0.133 ± 0.019 | 0.144 ± 0.019 |
| CA | IC | IA |
|---|
| Results are expressed as means ± standard deviation of 10 animals per group. SA: Sedentary alloxan; SC: Sedentary control; CC: Continuous training control; CA: Continuous training alloxan; IC: Intermittent training control and IA: Intermittent training alloxan.Different letters indicate a statistically significant difference among groups (Two-way ANOVA (3 × 2) and Bonferroni post hoc test, P < 0.05). a: statistically significant differences for IA versus IC; c: statistically significant differences for SC versus IC. |
| Serum glucose (mg/dL) | 94.13 ± 9.22 | 90.98 ± 8.66 | 94.95 ± 8.16 |
| Serum insulin (ng/mL) | 3.03 ± 2.00 | 3.25 ± 2.49 | 2.81 ± 2.15 |
| Gastrocnemius glycogen (mg/100 mg) | 0.55 ± 0.10 | 0.62 ± 0.16c | 0.46 ± 0.10a |
| Liver glycogen (mg/100 mg) | 7.29 ± 1.38 | 8.13 ± 1.34 | 7.38 ± 0.79 |
| Heart glycogen (mg/100 mg) | 0.150 ± 0.027 | 0.164 ± 0.051 | 0.149 ± 0.041 |
Table 2. Glucose Uptake and Oxidation, Glycogen Synthesis and Concentration in the Soleus Muscle at 120 days
| SA | SC | CC |
|---|
| Glucose uptake (µmol/g.h) | 2.64 ± 0.55 | 3.17 ± 0.76 | 3.70 ± 0.89 |
| Glucose oxidation (µmol/g.h) | 2.07 ± 0.62 | 2.84 ± 0.82 | 3.65 ± 1.60 |
| Glycogen synthesis (µmol/g.h) | 0.27 ± 0.13 | 0.29 ± 0.13 | 0.36 ± 0.09 |
| Glycogen concentrations (mg/100mg) | 0.30 ± 0.04 | 0.40 ± 0.11 | 0.37 ± 0.04 |
| CA | IC | IA |
|---|
| Results are expressed as means ± standard deviation of 10 animals per group. SA: Sedentary alloxan; SC: Sedentary control; CC: Continuous training control; CA: Continuous training alloxan; IC: Intermittent training control and IA: Intermittent training alloxan. Different letters indicate a statistically significant difference among groups (Two-way ANOVA (3 × 2) and Bonferroni post hoc test, P < 0.05). c: statistically significant differences for SC versus IC; d: statistically significant differences for CA versus IA; g: statistically significant differences for SA versus CA; h: statistically significant differences for SA versus IA; i: statistically significant differences for CC versus IC. |
| Glucose uptake (µmol/g.h) | 3.13 ± 0.40 | 5.09 ± 0.49c, i | 5.59 ± 0.99h, d |
| Glucose oxidation (µmol/g.h) | 5.81 ± 2.25g | 4.64 ± 2.13 | 3.77 ± 1.68 |
| Glycogen synthesis (µmol/g.h) | 0.32 ± 0.06 | 0.32 ± 0.11 | 0.42 ± 0.21 |
| Glycogen concentrations (mg/100mg) | 0.44 ± 0.08g | 0.37 ± 0.04 | 0.41 ± 0.08 |