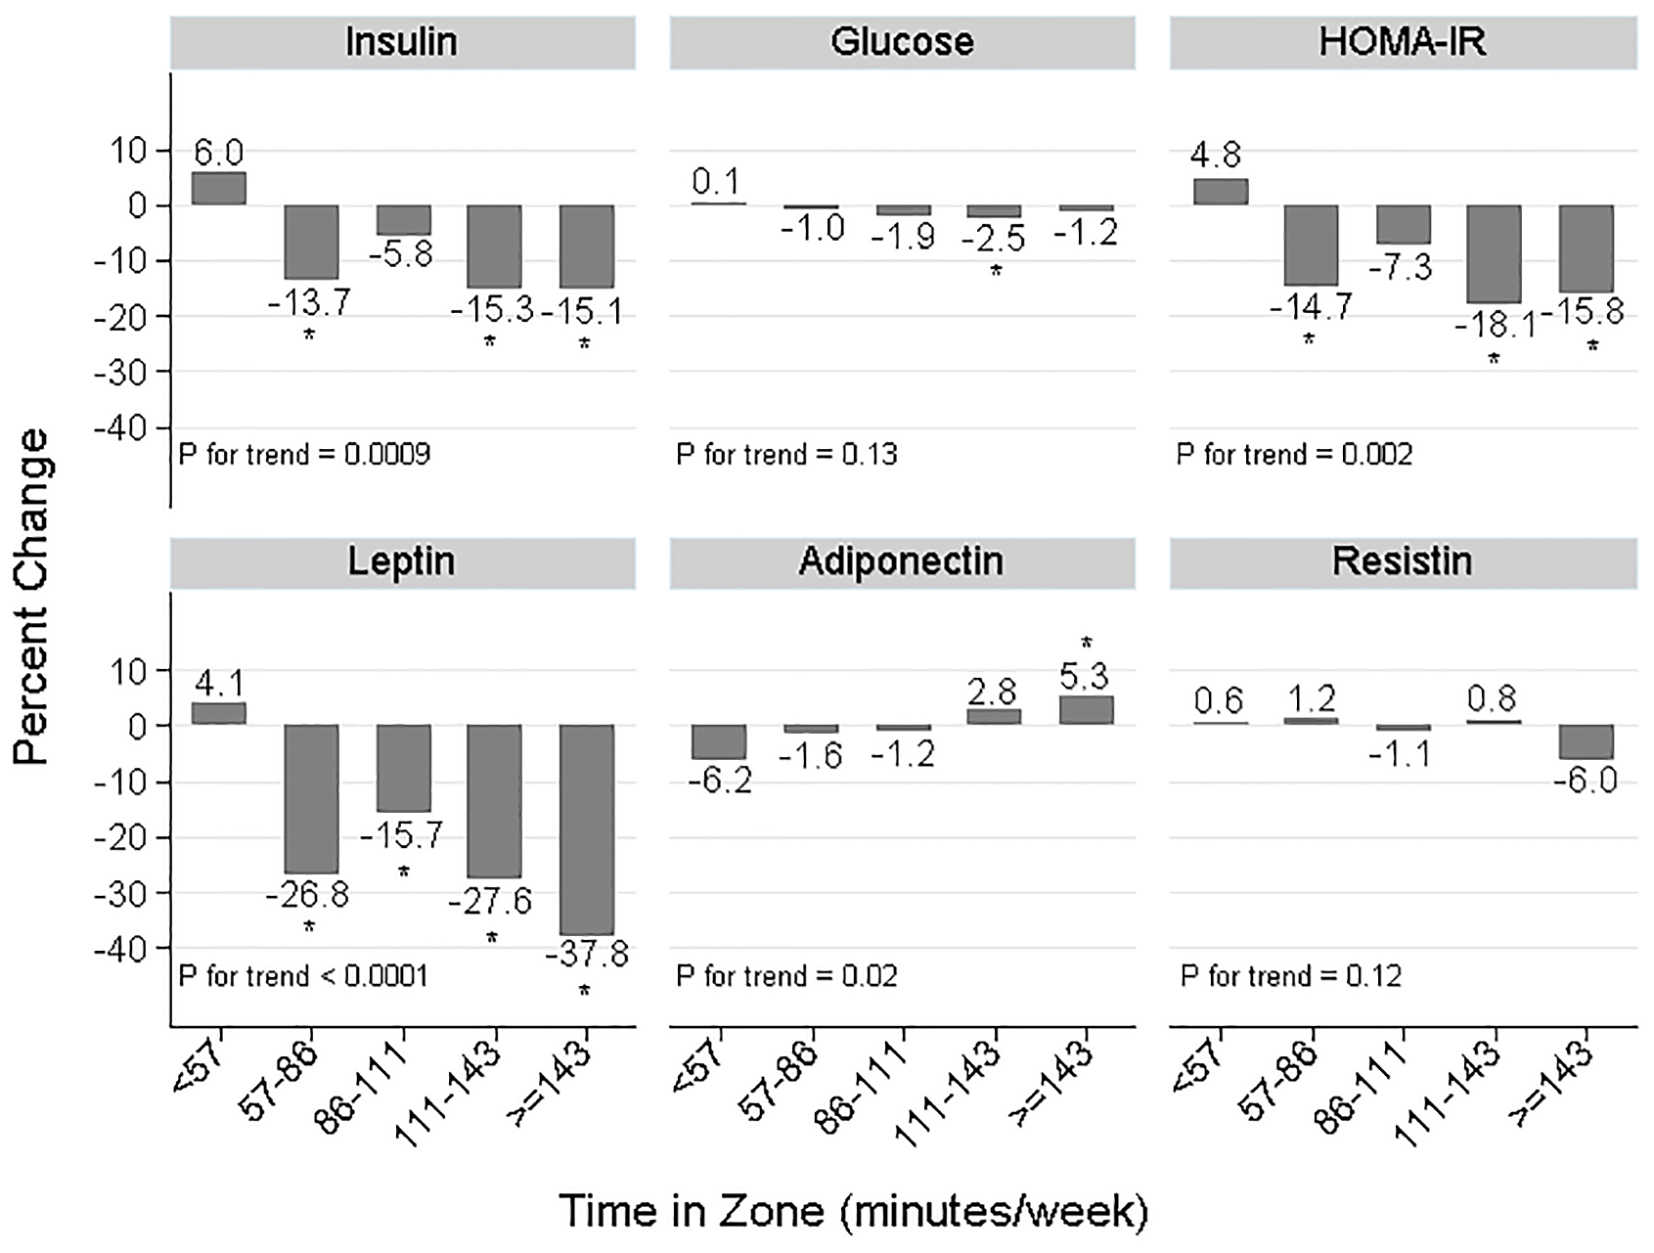
Journal of Endocrinology and Metabolism, ISSN 1923-2861 print, 1923-287X online, Open Access |
Article copyright, the authors; Journal compilation copyright, J Endocrinol Metab and Elmer Press Inc |
Journal website http://www.jofem.org |
Original Article
Volume 6, Number 2, April 2016, pages 35-45
Exercise Dose Effects on Insulin Resistance Indicators in Postmenopausal Women: A Randomized Trial
Figure
Tables
Baseline characteristic | Moderate | High |
---|---|---|
HOMA-IR: homeostasis model assessment of insulin resistance = fasting glucose (mM) × fasting insulin (μIU/mL)/22.5 [27]. SI conversions: to convert fasting insulin to pmol/L, multiply by 6.945; glucose to mmol/L, multiply by 0.0555; leptin to μg/L, multiply by 1.00; adiponectin and resistin SI units not available. aBaseline values were missing for biomarker concentration (n = 14). bThere were no statistically significant differences at baseline between high and moderate groups for these variables except for glucose and adiponectin, P value = 0.02 and 0.05, respectively. | ||
n (%) | n (%) | |
Number of participants randomized | 200 | 200 |
Race/ethnicity | ||
White | 186 (93%) | 172 (86%) |
Other | 14 (7%) | 28 (14%) |
Mean ± SD | Mean ± SD | |
Age (years) | 59.5 ± 5.1 | 59.4 ± 4.8 |
Maximal oxygen consumption (mL/kg/min) | 26.8 ± 5.0 | 26.7 ± 5.3 |
Body mass index (kg/m2) | 29.4 ± 4.4 | 29.1 ± 4.4 |
Percent body fat (%) | 40.7 ± 5.9 | 40.5 ± 5.8 |
Intra-abdominal fat (cm2) | 133.4 ± 49.3 | 125.6 ± 50.8 |
Lean mass (kg) | 43.9 ± 5.7 | 44.1 ± 5.5 |
Median (quartile 1, 3) | Median (quartile 1, 3) | |
Total energy intake (kcal/day) | 1,412 (1,115, 1,785) | 1,379 (999, 1,797) |
Alcohol intake (g/day) | 2.4 (0.7, 7.5) | 3.0 (0.9, 6.5) |
Fat intake (g/day) | 50.5 (37.2, 67.5) | 49.3 (35.5, 70.6) |
Fiber intake (g/day) | 17.3 (12.9, 22.4) | 16.8 (12.3, 22.5) |
Carbohydrate intake (g/day) | 175.3 (139.8, 227.6) | 169.3 (126.9, 217.7) |
Glycemic load (g/day) | 79.9 (62.2, 102.2) | 76.1 (56.2, 102.2) |
Past year total physical activity (MET-hours/week) | ||
Total activity | 90.6 (60.6, 121.9) | 89.0 (62.2, 115.8) |
Occupational activity | 25.9 (4.5, 55.2) | 34.2 (2.6, 56.3) |
Household activity | 41.0 (27.0, 60.6) | 40.4 (28.3, 60.1) |
Recreational activity | 7.6 (2.3, 13.0) | 6.9 (2.4, 13.3) |
Biomarker concentration | ||
Insulin (µIU/mL) | 8.7 (5.9, 12.5) | 8.3 (5.0, 12.1) |
Glucose (mg/dL)b | 91 (86, 98) | 89 (85, 95) |
HOMA-IR | 2.1 (1.3, 2.9) | 1.8 (1.1, 2.7) |
Leptin (ng/mL) | 39.2 (23.1, 61.1) | 38.4 (20.0, 58.6) |
Adiponectin (µg/mL)b | 21.1 (13.4, 40.5) | 26.5 (14.2, 50.1) |
Resistin (ng/mL) | 24.9 (20.6, 29.9) | 25.6 (20.2, 32.2) |
Biomarker | Groupa | Baseline geometric mean | 95% CI | 6-month geometric mean | 95% CI | 12-month geometric mean | 95% CI | 12-month percent change | Treatment effect ratio | 95% CI | Between-group P-valueb |
---|---|---|---|---|---|---|---|---|---|---|---|
HOMA-IR: homeostasis model assessment of insulin resistance = fasting glucose (mM) × fasting insulin (μIU/mL)/22.5. SI conversions: to convert fasting insulin to pmol/L, multiply by 6.945; glucose to mmol/L, multiply by 0.0555; leptin to μg/L, multiply by 1.00; adiponectin and resistin SI units not available. aAvailable sample sizes for moderate/high groups were as follows: insulin, 188/195; glucose, 190/195; HOMA-IR, 187/195; leptin, 191/192; adiponectin, 190/195; resistin, 191/194. Sample sizes varied between biomarkers due to insufficient blood volume (n = 1) and exclusion of extreme concentrations at baseline (n = 1 - 3 participants depending on biomarker). bStatistical test for a significant high versus moderate group difference in biomarker levels over 12 months from the linear mixed model, adjusted for biomarker level at baseline. | |||||||||||
Insulin, µIU/mL | Moderate | 8.7 | 8.0 - 9.3 | 8.1 | 7.5 - 8.8 | 8.0 | 7.3 - 8.6 | -8.0 | 0.96 | 0.90 - 1.03 | 0.26 |
High | 7.7 | 7.1 - 8.4 | 7.3 | 6.7 - 7.9 | 6.9 | 6.4 - 7.5 | -10.4 | ||||
Glucose, mg/dL | Moderate | 92 | 91 - 93 | 91 | 90 - 92 | 90 | 89 - 92 | -1.7 | 1.00 | 0.99 - 1.01 | 0.59 |
High | 90 | 89 - 91 | 89 | 88 - 90 | 89 | 87 - 90 | -1.0 | ||||
HOMA-IR | Moderate | 2.0 | 1.8 - 2.1 | 1.8 | 1.7 - 2.0 | 1.8 | 1.6 - 1.9 | -10.4 | 0.97 | 0.90 - 1.04 | 0.36 |
High | 1.7 | 1.6 - 1.9 | 1.6 | 1.5 - 1.8 | 1.5 | 1.4 - 1.7 | -11.3 | ||||
Leptin, ng/mL | Moderate | 36.1 | 32.4 - 40.3 | 29.6 | 26.5 - 33.2 | 28.4 | 25.4 - 31.8 | -21.4 | 0.93 | 0.84 - 1.02 | 0.13 |
High | 34.5 | 30.9 - 38.6 | 25.7 | 22.7 - 29.0 | 26.4 | 23.4 - 29.8 | -23.5 | ||||
Adiponectin, µg/mL | Moderate | 23.1 | 20.7 - 25.9 | 20.7 | 18.5 - 23.1 | 23.4 | 21.0 - 26.1 | 1.1 | 0.98 | 0.92 - 1.04 | 0.45 |
High | 26.7 | 23.8 - 30.0 | 23.1 | 20.5 - 26.0 | 26.3 | 23.3 - 29.6 | -1.6 | ||||
Resistin, ng/mL | Moderate | 24.8 | 23.7 - 25.9 | 25.5 | 24.3 - 26.8 | 25.2 | 24.1 - 26.4 | 1.6 | 0.98 | 0.94 - 1.02 | 0.23 |
High | 25.3 | 24.0 - 26.7 | 25.8 | 24.5 - 27.1 | 24.4 | 23.2 - 25.7 | -3.4 |
Biomarker | Treatment effecta | |||||||
---|---|---|---|---|---|---|---|---|
Group | N | 6-month percent change from baseline | 12-month percent change from baseline | Ratio of high/moderate | 95% CI | Between-group Pb | P-interactionc | |
HOMA-IR: homeostasis model assessment of insulin resistance = fasting glucose (mM) × fasting insulin (μIU/mL)/22.5. aHigh/moderate ratio of geometric means for biomarker levels over 12 months adjusted for biomarker level at baseline. bStatistical test for a significant high versus moderate group difference in biomarker level over 12 months from the linear mixed model, adjusted for biomarker level at baseline. cStatistical test for a significant cross-product term: (group assignment × baseline BMI as continuous variable) in a linear mixed model, adjusted for biomarker level at baseline. | ||||||||
Insulin | ||||||||
BMI < 30 kg/m2 | Moderate | 114 | -5.9 | -8.8 | 0.96 | 0.89 - 1.04 | 0.35 | 0.98 |
High | 121 | -4.1 | -9.3 | |||||
BMI ≥ 30 kg/m2 | Moderate | 74 | -6.8 | -6.7 | 0.96 | 0.86 - 1.06 | 0.40 | |
High | 74 | -9.4 | -12.1 | |||||
Glucose | ||||||||
BMI < 30 kg/m2 | Moderate | 115 | -1.3 | -2.0 | 1.00 | 0.98 - 1.02 | 0.97 | 0.41 |
High | 121 | 0.1 | -0.7 | |||||
BMI ≥ 30 kg/m2 | Moderate | 75 | 0.3 | -1.1 | 0.99 | 0.97 - 1.01 | 0.33 | |
High | 74 | -1.3 | -1.5 | |||||
HOMA-IR | ||||||||
BMI < 30 kg/m2 | Moderate | 113 | -7.6 | -10.9 | 0.97 | 0.89 - 1.06 | 0.52 | 0.89 |
High | 121 | -3.9 | -9.9 | |||||
BMI ≥ 30 kg/m2 | Moderate | 74 | -6.6 | -9.4 | 0.95 | 0.85 - 1.07 | 0.41 | |
High | 74 | -10.6 | -13.5 | |||||
Leptin | ||||||||
BMI < 30 kg/m2 | Moderate | 116 | -20.8 | -24.2 | 0.98 | 0.87 - 1.09 | 0.66 | 0.50 |
High | 121 | -25.1 | -22.6 | |||||
BMI ≥ 30 kg/m2 | Moderate | 75 | -13.3 | -16.4 | 0.87 | 0.73 - 1.03 | 0.09 | |
High | 71 | -27.0 | -25.0 | |||||
Adiponectin | ||||||||
BMI < 30 kg/m2 | Moderate | 116 | -11.5 | 1.6 | 0.98 | 0.91 - 1.05 | 0.53 | 0.67 |
High | 121 | -14.2 | -2.0 | |||||
BMI ≥ 30 kg/m2 | Moderate | 75 | -9.2 | 0.4 | 0.98 | 0.90 - 1.07 | 0.67 | |
High | 73 | -12.1 | -1.0 | |||||
Resistin | ||||||||
BMI < 30 kg/m2 | Moderate | 116 | 3.7 | 3.6 | 0.95 | 0.90 - 1.00 | 0.04 | 0.12 |
High | 121 | -0.8 | -5.5 | |||||
BMI ≥ 30 kg/m2 | Moderate | 75 | 1.1 | -1.4 | 1.03 | 0.96 - 1.09 | 0.43 | |
High | 73 | 6.4 | 0.3 |
Biomarker | Treatment effecta | |||||||
---|---|---|---|---|---|---|---|---|
Group | N | 6-month percent change from baseline | 12-month percent change from baseline | Ratio of high/moderate | 95% CI | Between-group Pb | P-interactionc | |
HOMA-IR: homeostasis model assessment of insulin resistance = fasting glucose (mM) × fasting insulin (μIU/mL)/22.5. aHigh/moderate ratio of geometric mean biomarker level over 12 months, adjusted for biomarker level at baseline. bStatistical test for a significant high versus moderate group difference in biomarker level over 12 months from the linear mixed model, adjusted for biomarker level at baseline. cStatistical test for a significant cross-product term: (group assignment × baseline age as continuous variable) in a linear mixed model, adjusted for biomarker level at baseline. | ||||||||
Insulin | ||||||||
Age < 60 years | Moderate | 106 | -3.9 | -6.5 | 0.95 | 0.87 - 1.04 | 0.25 | 0.61 |
High | 121 | -5.2 | -10.5 | |||||
Age ≥ 60 years | Moderate | 82 | -9.3 | -9.9 | 0.98 | 0.89 - 1.08 | 0.68 | |
High | 74 | -7.2 | -10.1 | |||||
Glucose | ||||||||
Age < 60 years | Moderate | 108 | -0.3 | -1.3 | 0.99 | 0.97 - 1.00 | 0.14 | 0.79 |
High | 121 | -0.4 | -1.5 | |||||
Age ≥ 60 years | Moderate | 82 | -1.3 | -2.3 | 1.01 | 0.99 - 1.03 | 0.36 | |
High | 74 | -0.3 | -0.0 | |||||
HOMA-IR | ||||||||
Age < 60 years | Moderate | 106 | -4.0 | -7.2 | 0.94 | 0.86 - 1.04 | 0.21 | 0.77 |
High | 121 | -5.6 | -11.9 | |||||
Age ≥ 60 years | Moderate | 81 | -11.2 | -14.4 | 1.00 | 0.90 - 1.12 | 0.95 | |
High | 74 | -7.5 | -10.1 | |||||
Leptin | ||||||||
Age < 60 years | Moderate | 108 | -13.6 | -8.7 | 0.84 | 0.74 - 0.96 | 0.01 | 0.03 |
High | 120 | -25.1 | -27.8 | |||||
Age ≥ 60 years | Moderate | 83 | -23.3 | -35.5 | 1.07 | 0.92 - 1.25 | 0.38 | |
High | 72 | -26.5 | -15.6 | |||||
Adiponectin | ||||||||
Age < 60 years | Moderate | 108 | -12.1 | 3.7 | 0.98 | 0.91 - 1.06 | 0.58 | 0.68 |
High | 121 | -13.0 | -2.3 | |||||
Age ≥ 60 years | Moderate | 83 | -8.7 | -2.1 | 0.98 | 0.89 - 1.07 | 0.62 | |
High | 73 | -14.4 | -0.5 | |||||
Resistin | ||||||||
Age < 60 years | Moderate | 108 | 1.7 | 2.5 | 0.99 | 0.94 - 1.05 | 0.82 | 0.85 |
High | 121 | 2.4 | -2.9 | |||||
Age ≥ 60 years | Moderate | 83 | 4.0 | 0.5 | 0.95 | 0.89 - 1.02 | 0.14 | |
High | 73 | 1.1 | -4.2 |
Biomarker | Groupb | Baseline geometric mean | 95% CI | 6-month geometric mean | 95% CI | 12-month geometric mean | 95% CI | 12-month percent change | Treatment effect ratio | 95% CI | Between-group P-valuec |
---|---|---|---|---|---|---|---|---|---|---|---|
HOMA-IR: homeostasis model assessment of insulin resistance = fasting glucose (mM) × fasting insulin (μIU/mL)/22.5. SI conversions: to convert fasting insulin to pmol/L, multiply by 6.945; glucose to mmol/L, multiply by 0.0555; leptin to μg/L, multiply by 1.00; adiponectin and resistin SI units not available. aAverage exercise time over weeks 13 - 52 was 135 - 150 min/week (moderate) or ≥ 270 min/week (high). bAvailable sample sizes for moderate/high groups were as follows: insulin, 57/80; glucose, 58/80; HOMA-IR, 57/80; leptin, 58/79; adiponectin, 58/80; resistin, 58/80. Sample sizes varied between biomarkers due to exclusion of extreme concentrations at baseline (n = 2 for insulin, HOMA-IR and leptin). cStatistical test for a significant high versus moderate group difference in biomarker levels over 12 months from the linear mixed model, adjusted for biomarker level at baseline. | |||||||||||
Insulin, µIU/mL | Moderate | 8.8 | 7.6 - 10.1 | 8.3 | 7.3 - 9.5 | 7.8 | 6.7 - 9.2 | -10.6 | 0.89 | 0.80 - 0.99 | 0.03 |
High | 7.5 | 6.6 - 8.6 | 6.6 | 5.8 - 7.5 | 6.1 | 5.4 - 7.0 | -19.1 | ||||
Glucose, mg/dL | Moderate | 92 | 89 - 94 | 92 | 90 - 94 | 90 | 88 - 92 | -1.73 | 0.98 | 0.96 - 1.00 | 0.03 |
High | 88 | 86 - 89 | 87 | 86 - 89 | 86 | 85 - 88 | -1.67 | ||||
HOMA-IR | Moderate | 2.0 | 1.7 - 2.3 | 1.9 | 1.6 - 2.2 | 1.7 | 1.5 - 2.1 | -11.9 | 0.87 | 0.78 - 0.98 | 0.02 |
High | 1.6 | 1.4 - 1.9 | 1.4 | 1.2 - 1.6 | 1.3 | 1.1 - 1.5 | -20.4 | ||||
Leptin, ng/mL | Moderate | 33.9 | 27.5 - 41.8 | 29.6 | 24.5 - 35.7 | 26.3 | 21.4 - 32.4 | -22.4 | 0.77 | 0.65 - 0.90 | 0.002 |
High | 30.9 | 26.0 - 36.7 | 19.6 | 16.1 - 23.8 | 20.3 | 16.8 - 24.5 | -34.4 | ||||
Adiponectin, µg/mL | Moderate | 22.0 | 18.4 - 26.2 | 20.8 | 17.4 - 24.8 | 23.8 | 19.9 - 18.5 | 8.2 | 0.92 | 0.84 - 1.02 | 0.11 |
High | 26.4 | 22.1 - 31.6 | 21.7 | 18.0 - 26.2 | 27.2 | 22.6 - 32.9 | 3.2 | ||||
Resistin, ng/mL | Moderate | 25.1 | 23.2 - 27.2 | 24.4 | 22.3 - 26.8 | 24.7 | 22.7 - 26.8 | -1.8 | 0.99 | 0.92 - 1.06 | 0.78 |
High | 25.7 | 23.5 - 28.0 | 25.8 | 23.6 - 28.2 | 23.7 | 21.6 - 26.1 | -7.5 |