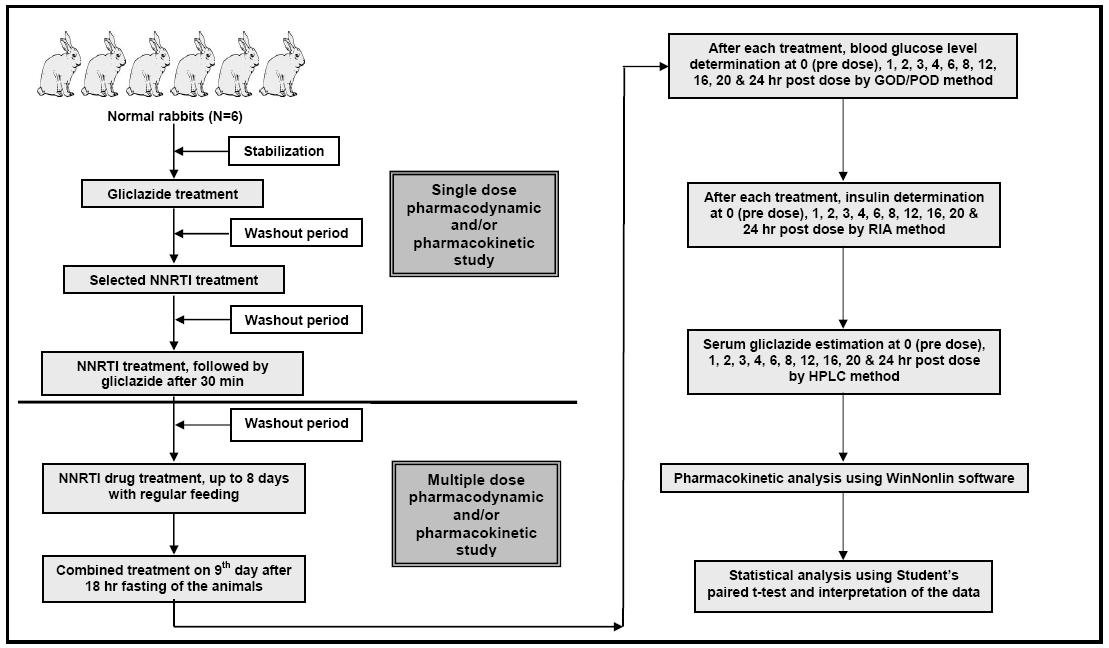
Figure 1. Study design for conducting pharmacodynamic and pharmacokinetic interaction studies of selected non-nucleoside reverse transcriptase inhibitors (NNRTIs) with gliclazide in rabbits.
| Journal of Endocrinology and Metabolism, ISSN 1923-2861 print, 1923-287X online, Open Access |
| Article copyright, the authors; Journal compilation copyright, J Endocrinol Metab and Elmer Press Inc |
| Journal website http://www.jofem.org |
Original Article
Volume 1, Number 3, August 2011, pages 113-124
Influence of Efavirenz and Nevirapine on the Pharmacodynamics and Pharmacokinetics of Gliclazide in Rabbits
Figures
Tables
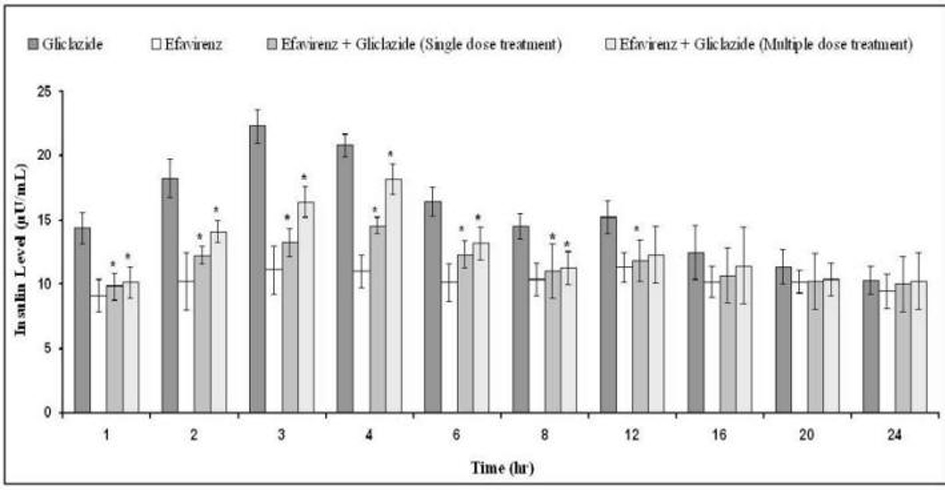
| Time (hr) | Gliclazide | Efavirenz | Efavirenz + Gliclazide (Single dose treatment) | Efavirenz + Gliclazide (Multiple dose treatment) |
|---|---|---|---|---|
| Data are expressed as mean ± SD; *Significant at P < 0.05 compared to gliclazide control. | ||||
| 1 | 16.68 ± 5.13 | -2.65 ± 1.86 | 5.44 ± 5.47* | 10.56 ± 3.59* |
| 2 | 22.84 ± 6.61 | -4.40 ± 2.35 | 11.43 ± 3.77* | 15.69 ± 3.42* |
| 3 | 32.82 ± 5.34 | -1.98 ± 2.93 | 21.86 ± 3.11* | 26.33 ± 2.55* |
| 4 | 24.41 ± 4.65 | 0.14 ± 3.04 | 11.07 ± 3.97* | 16.05 ± 3.74* |
| 6 | 22.85 ± 6.14 | 1.56 ± 2.29 | 8.89 ± 2.25* | 13.15 ± 2.60* |
| 8 | 17.56 ± 3.84 | 3.67 ± 4.28 | 6.99 ± 3.09* | 11.30 ± 3.00* |
| 12 | 8.51 ± 6.13 | 5.79 ± 4.77 | 5.14 ± 3.17 | 9.89 ± 1.84 |
| 16 | 3.74 ± 6.04 | 7.55 ± 3.86 | 0.69 ± 2.24 | 5.43 ± 4.01 |
| 20 | 2.28 ± 6.01 | 6.85 ± 4.97 | -0.80 ± 2.70 | 2.90 ± 3.60 |
| 24 | 0.03 ± 6.63 | 6.18 ± 2.20 | -2.71 ± 4.44 | 1.79 ± 2.56 |
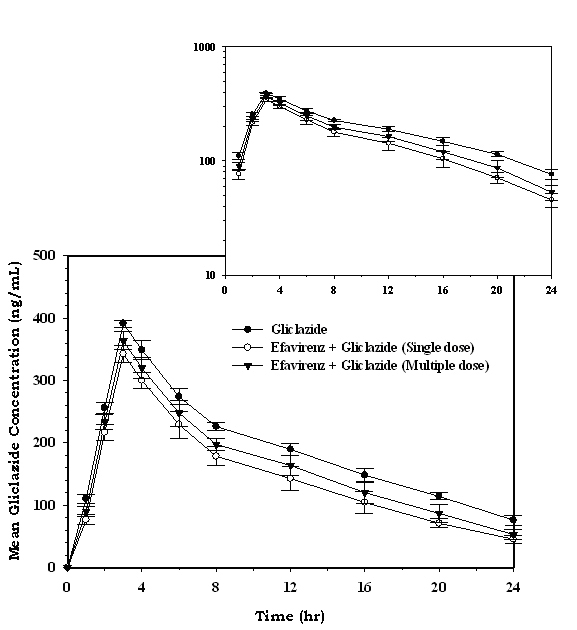
| Pharmacokinetic parameter | Gliclazide | Efavirenz + Gliclazide (Single dose treatment) | Efavirenz + Gliclazide (Multiple dose treatment) |
|---|---|---|---|
| Data are expressed as mean ± SD; *Significant at P < 0.05 compared to gliclazide control. | |||
| Cmax (ng/mL) | 391.21 ± 5.50 | 342.58 ± 13.45* | 363.37 ± 14.47* |
| Tmax (h) | 3.00 ± 0.00 | 3.00 ± 0.00 | 3.00 ± 0.00 |
| AUC0-24 (ng/mL/h) | 4465.66 ± 168.89 | 3441.40 ± 278.44* | 3841.04 ± 293.26* |
| AUC0-inf (ng/mL/h) | 5520.68 ± 277.21 | 3907.52 ± 292.87* | 4441.83 ± 370.97* |
| AUMC0-24 (ng/mL/h*h) | 43954.52 ± 2041.06 | 31748.24 ± 3094.48* | 36293.66 ± 3715.04* |
| AUMC0-inf (ng/mL/h*h) | 83977.99 ± 6954.70 | 47878.08 ± 5839.39* | 57613.10 ± 7573.52* |
| MRT0-24 (h) | 9.84 ± 0.09 | 9.21 ± 0.15* | 9.43 ± 0.25* |
| MRT0-inf (h) | 15.19 ± 0.60 | 12.24 ± 1.05* | 12.94 ± 0.84* |
| Vd (L) | 14.71 ± 0.66 | 15.15 ± 2.97 | 14.93 ± 1.60 |
| CL (L/h) | 0.06 ± 0.03 | 1.51 ± 0.11* | 1.33 ± 0.11* |
| Kel (h-1) | 0.07 ± 0.00 | 0.10 ± 0.02* | 0.09 ± 0.01* |
| T½ (h) | 9.62 ± 0.67 | 7.01 ± 1.45* | 7.84 ± 0.93* |
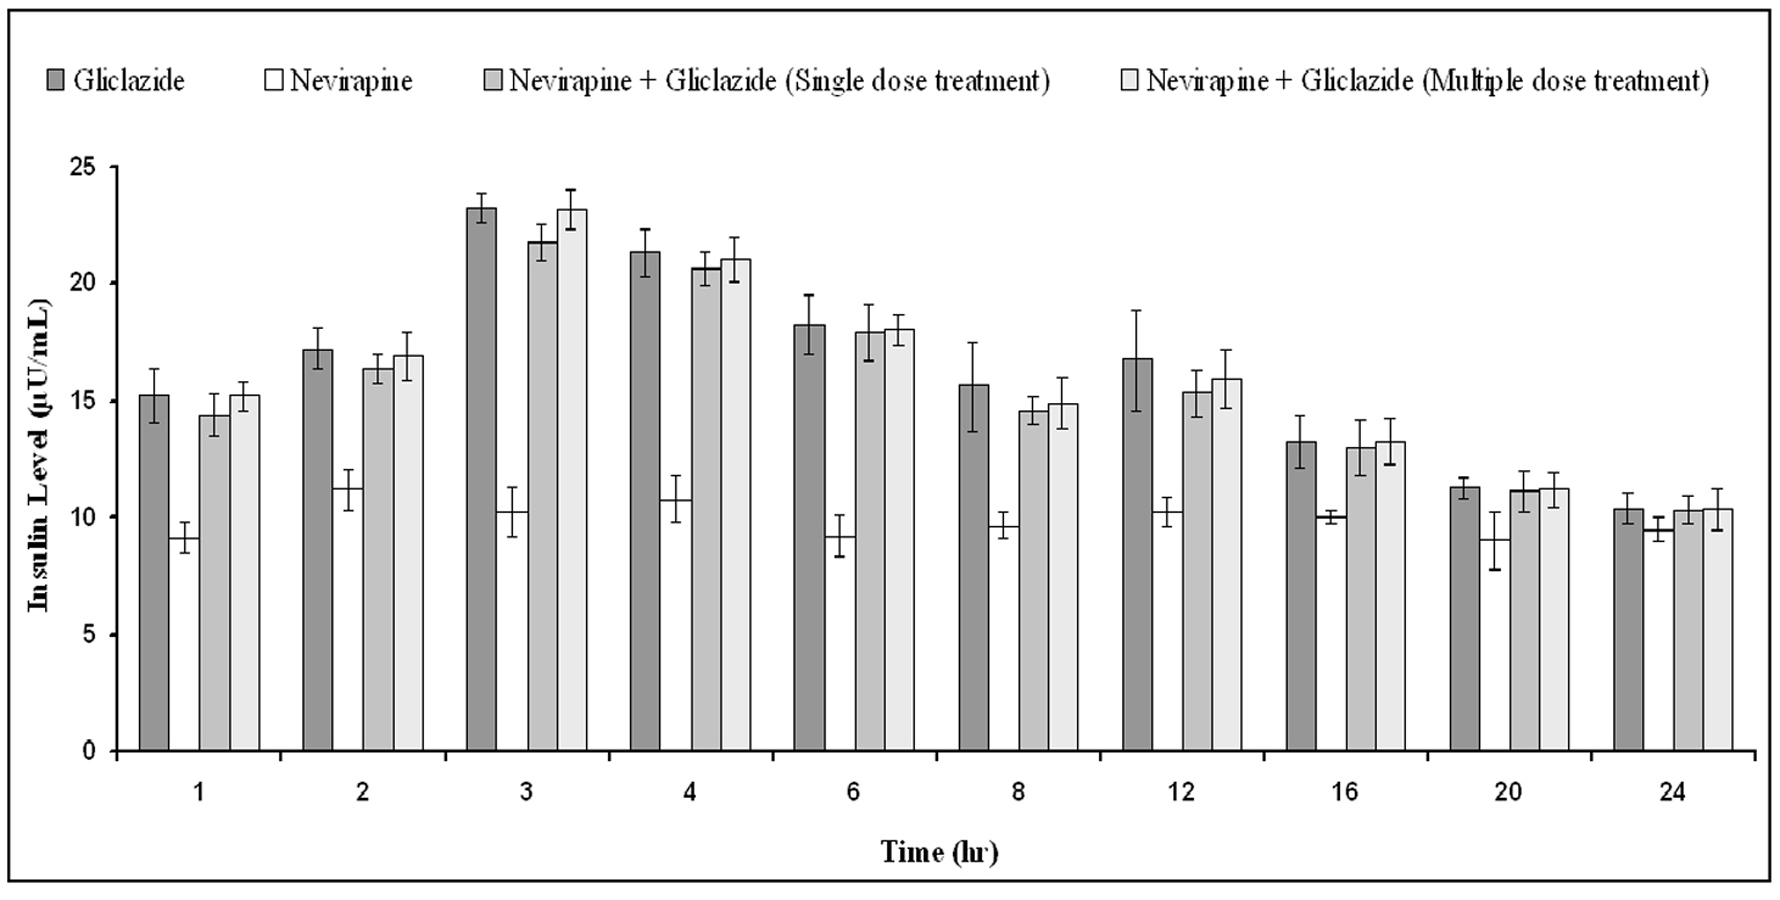
| Time (hr) | Gliclazide | Nevirapine | Nevirapine + Gliclazide* (Single dose treatment) | Nevirapine + Gliclazide* (Multiple dose treatment) |
|---|---|---|---|---|
| Data are expressed as mean ± SD; *No significant difference at P < 0.05 compared to gliclazide control. | ||||
| 1 | 18.98 ± 3.65 | -0.26 ± 7.67 | 18.53 ± 5.83 | 20.33 ± 5.49 |
| 2 | 25.19 ± 2.65 | 1.13 ± 9.86 | 25.89 ± 6.86 | 24.69 ± 3.34 |
| 3 | 34.03 ± 2.11 | 3.48 ± 6.91 | 35.46 ± 2.97 | 33.65 ± 2.13 |
| 4 | 26.34 ± 2.83 | 2.48 ± 5.10 | 28.09 ± 8.32 | 25.70 ± 2.87 |
| 6 | 24.09 ± 3.43 | 0.02 ± 9.80 | 23.82 ± 4.34 | 22.50 ± 3.71 |
| 8 | 18.20 ± 6.07 | 0.11 ± 7.43 | 18.14 ± 7.46 | 17.55 ± 3.06 |
| 12 | 10.90 ± 4.08 | 0.42 ± 9.04 | 13.43 ± 5.94 | 11.91 ± 2.35 |
| 16 | 5.39 ± 3.91 | -1.39 ± 8.01 | 7.20 ± 4.87 | 5.37 ± 5.07 |
| 20 | 3.54 ± 4.10 | -1.37 ± 7.14 | 3.92 ± 4.12 | 2.78 ± 5.92 |
| 24 | 2.13 ± 3.62 | -1.67 ± 5.39 | 1.04 ± 3.05 | 0.29 ± 3.68 |
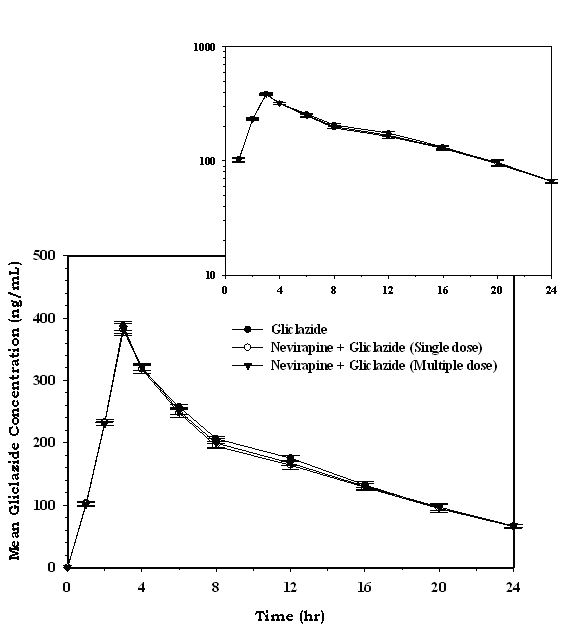
| Pharmacokinetic parameter | Gliclazide | Nevirapine + Gliclazide (Single dose treatment) | Nevirapine + Gliclazide (Multiple dose treatment) |
|---|---|---|---|
| Data are expressed as mean ± SD; *Significant at P < 0.05 compared to gliclazide control. | |||
| Cmax (ng/mL) | 387.56 ± 7.66 | 381.39 ± 9.99 | 382.89 ± 8.12 |
| Tmax (h) | 3.00 ± 0.00 | 3.00 ± 0.00 | 3.00 ± 0.00 |
| AUC0-24 (ng/mL/h) | 4078.99 ± 33.82 | 3950.86 ± 41.72* | 4008.58 ± 31.63* |
| AUC0-inf (ng/mL/h) | 4848.35 ± 106.93 | 4768.58 ± 168.22 | 4814.29 ± 83.18 |
| AUMC0-24 (ng/mL/h*h) | 39348.41 ± 518.98 | 38091.96 ± 634.91* | 38748.57 ± 394.60* |
| AUMC0-inf (ng/mL/h*h) | 66857.42 ± 4918.08 | 68074.90 ± 7688.14 | 67925.90 ± 4060.08 |
| MRT0-24 (h) | 9.65 ± 0.05 | 9.64 ± 0.08 | 9.67 ± 0.06 |
| MRT0-inf (h) | 13.78 ± 0.72 | 14.24 ± 1.10 | 14.10 ± 0.61 |
| Vd (L) | 14.17 ± 1.03 | 15.32 ± 1.91 | 14.92 ± 1.39 |
| CL (L/h) | 1.23 ± 0.07 | 1.25 ± 0.08 | 1.24 ± 0.05 |
| Kel (h-1) | 0.09 ± 0.01 | 0.08 ± 0.01 | 0.08 ± 0.01 |
| T½ (h) | 8.05 ± 0.86 | 8.56 ± 1.32 | 8.40 ± 0.77 |