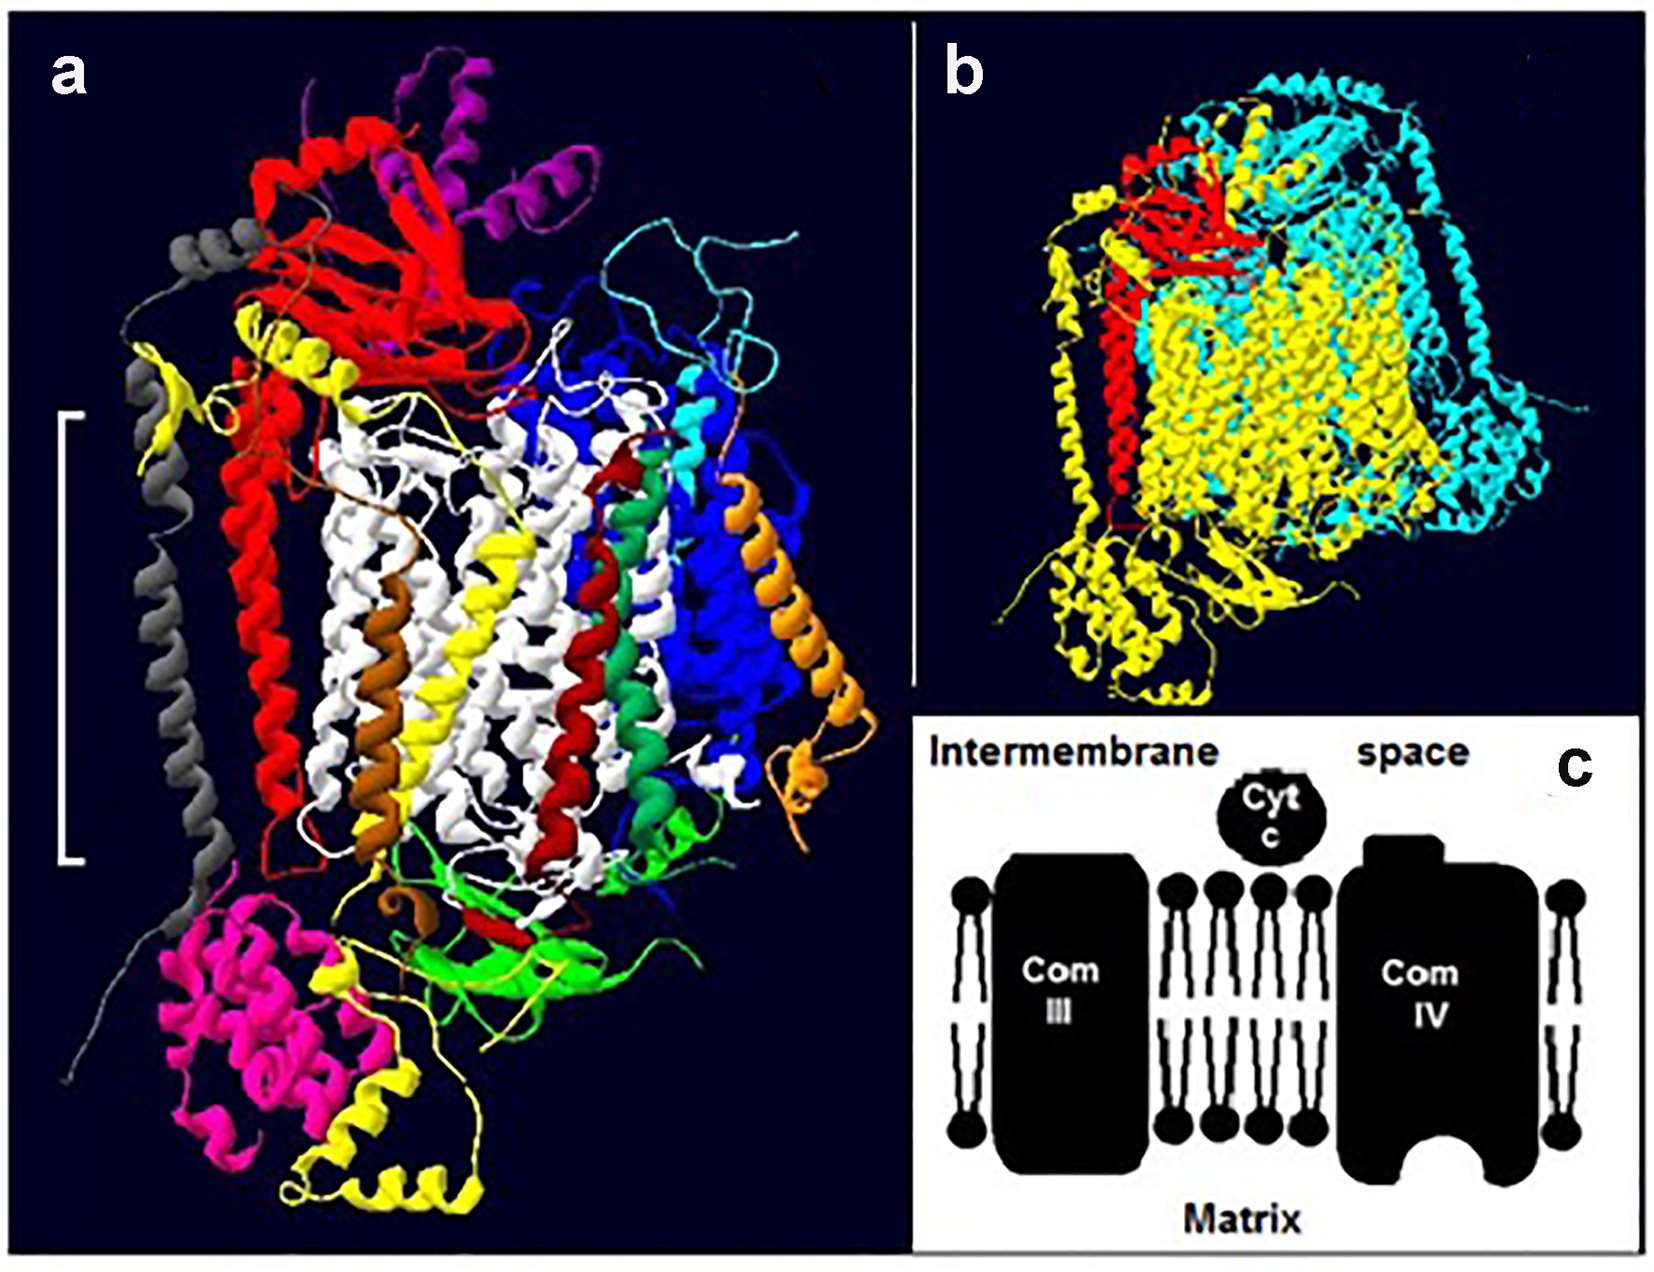
Figure 1. Cytochrome c oxidase. (a) The 13 subunits of one monomer of bovine COX (22): subunit, I (white), II (red) and III (blue) IV (yellow), V (pink), VI (green; extra-membrane) VII (light blue), VIII (purple), IX (gray), X (orange), XI (brown), XII (dark green) and XIII (dark brown). The white bracket shows the approximate position of the membrane. (b) A typical dimer (two identical monomers) of mammalian COX. One monomer is colored yellow and the other light blue; for ease of reference subunit II of the former is shown in red. The structures in both “a” and “b” are tilted slightly. (c) A section of the electron transport chain showing complexes III and IV. Cytochrome c (cty c) picks up electrons from complex III and delivers them to complex IV.
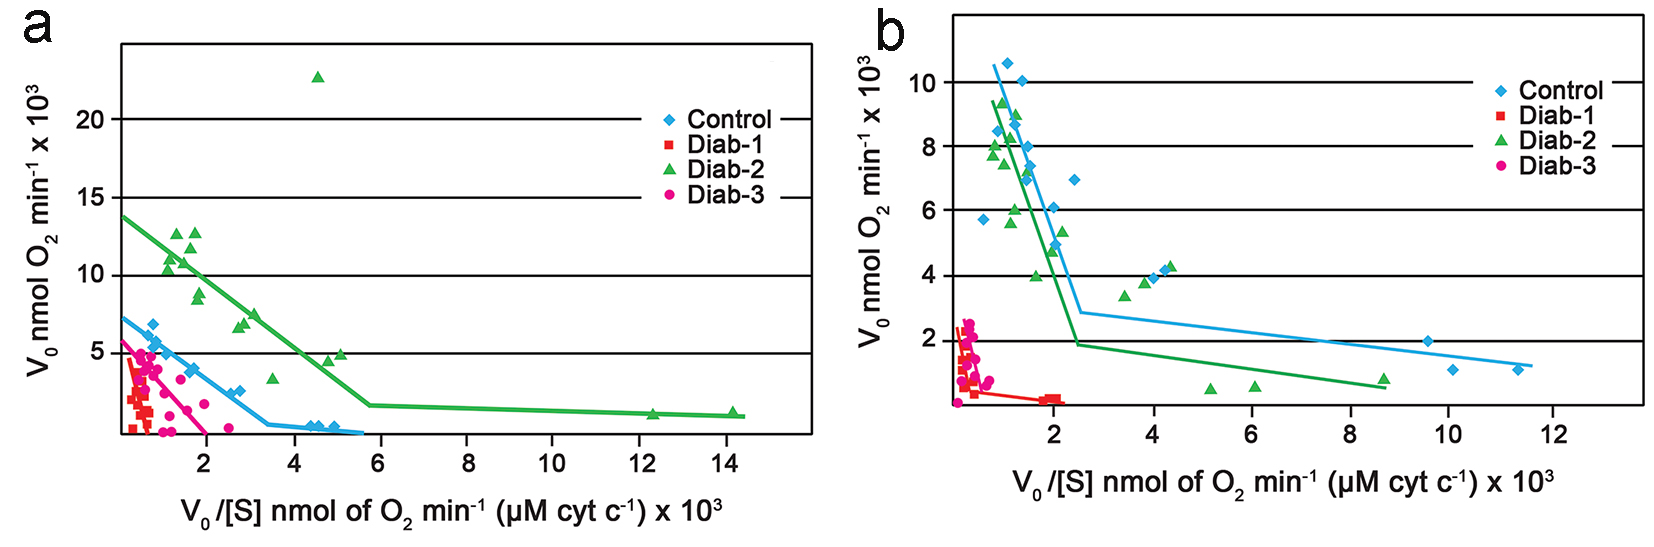
Figure 2. Eadie-Hofstee plots. (a) Eadie-Hofstee plots generated from the polarographic assay of COX within rat liver mitochondria. Typical control (blue). Diabetic at 1 month (red). Diabetic at 2 months (green). Diabetic at 3 months (purple). (b) Eadie-Hofstee plots generated from the polarographic assay of COX within rat kidney mitochondria. Typical control (blue). Diabetic at 1 month (red). Diabetic at 2 months (green). Diabetic at 3 months (purple). For all experiments the final mitochondrial concentration was 0.2 mg/mL; the substrate (cytochrome c) concentration was 6.8 - 680 μM.
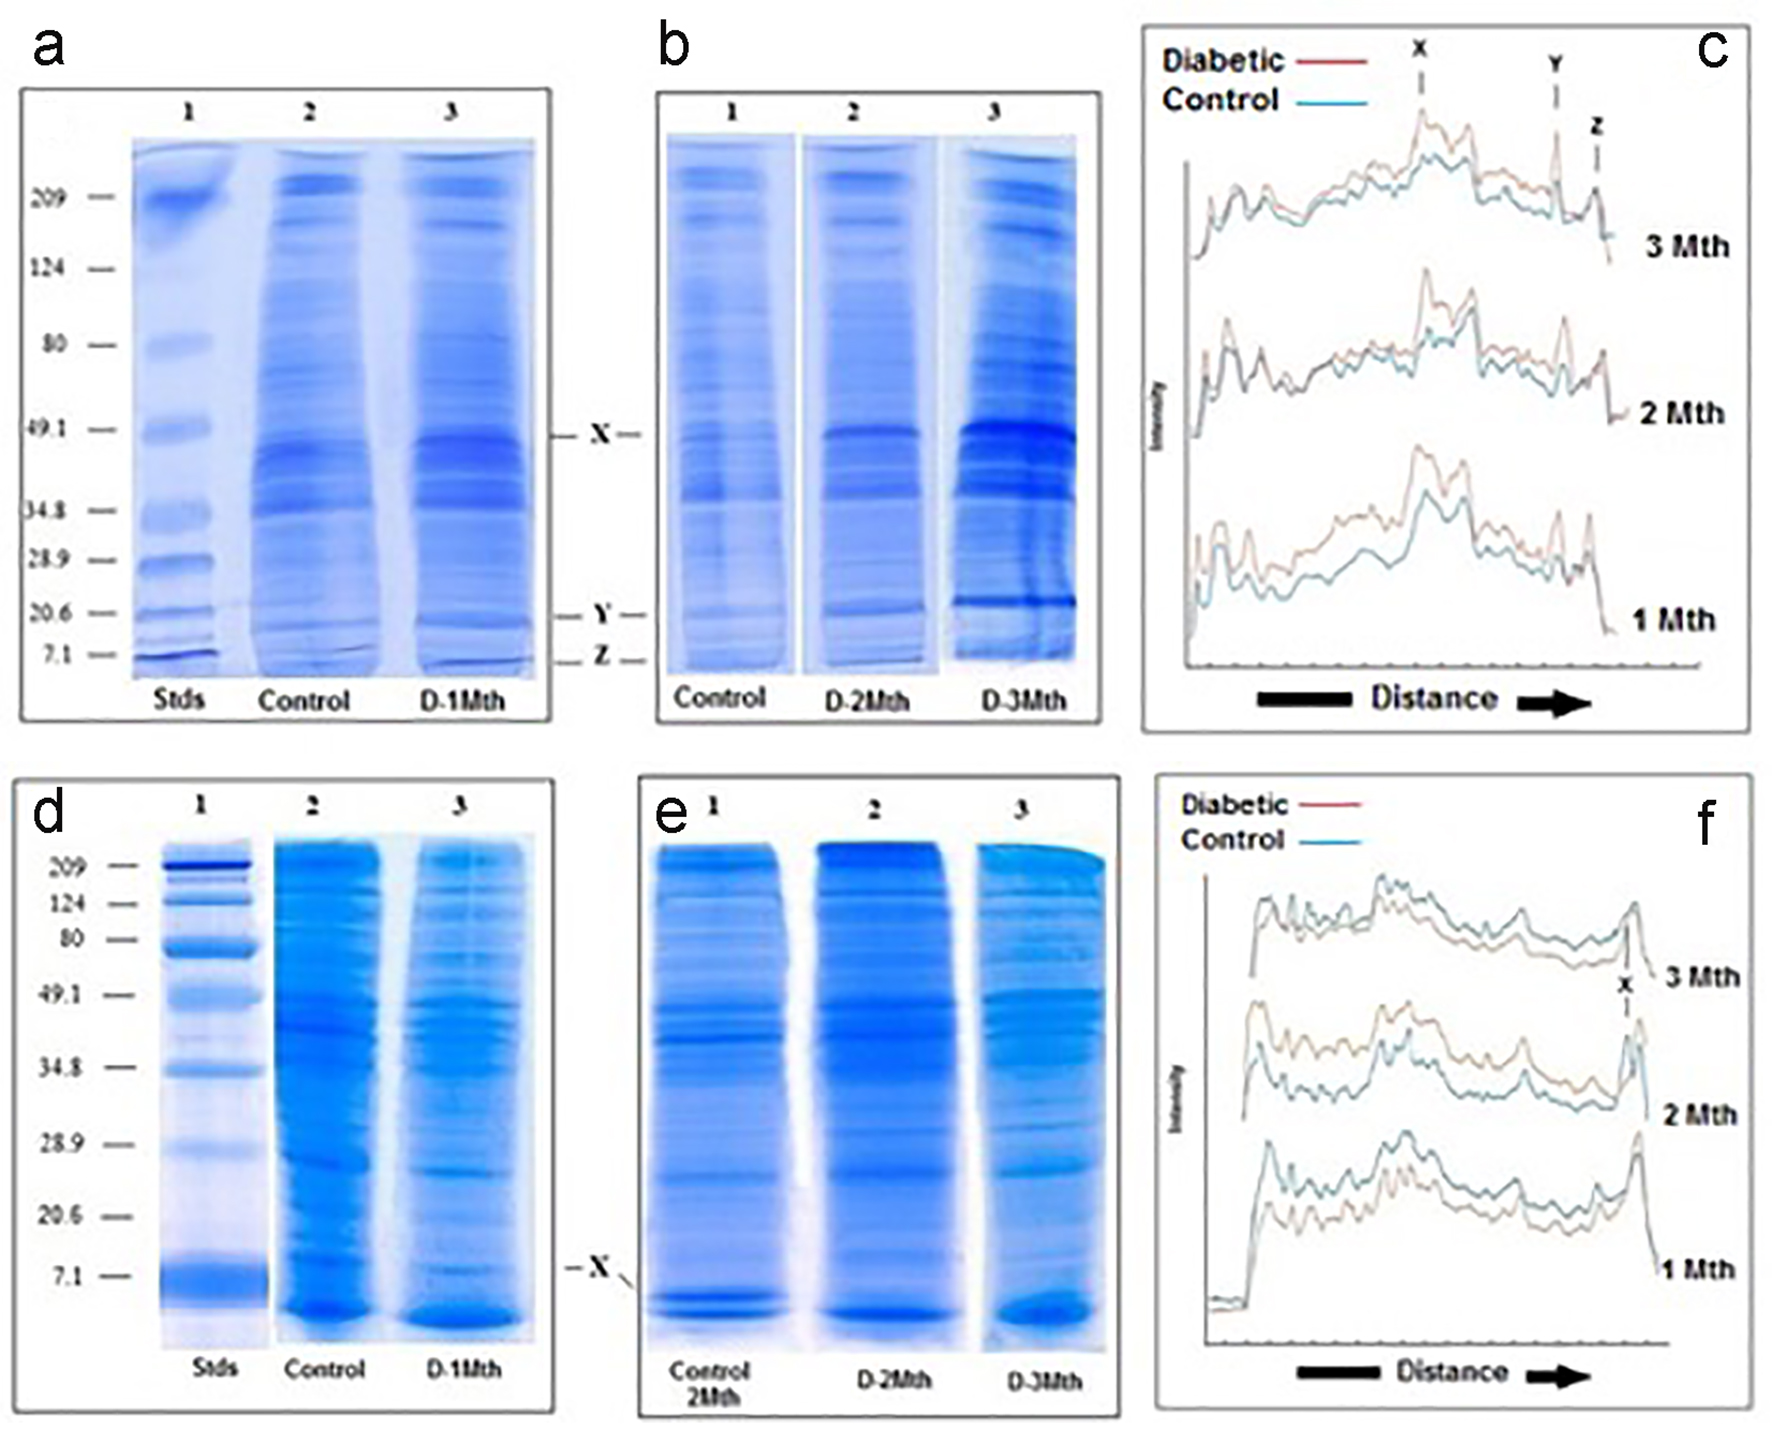
Figure 3. SDS-PAGE of liver and kidney (d-f) mitochondria. (a-c) Liver. SDS-PAGE of mitochondria from control and diabetic rats. (a) Lane 1: molecular weight standards (7.1 - 209 kd); lane 2: control; lane 3: diabetic rats 1 month. (b) Lane 1: control; lane 2: diabetic rats 2 months; lane 3: diabetic rats 3 months. (c) Densitometric analysis of the SDS gels shown in A and B. In all three cases, the blue traces are from the controls and the red are generated from the diabetics. (d-f) Kidney. SDS-PAGE of kidney mitochondria from control and diabetic rats. (d) Lane 1: molecular weight standards (7.1 - 209 kd); lane 2: control; lane 3: diabetic rats 1 month. (e) Lane 1: control; lane 2: diabetic rats 2 months; lane 3: diabetic rats 3 months. (f) Densitometric analysis of the SDS gels shown in (a) and (b). In all three cases, the blue traces are from the controls and the red are generated from the diabetics.