Figures
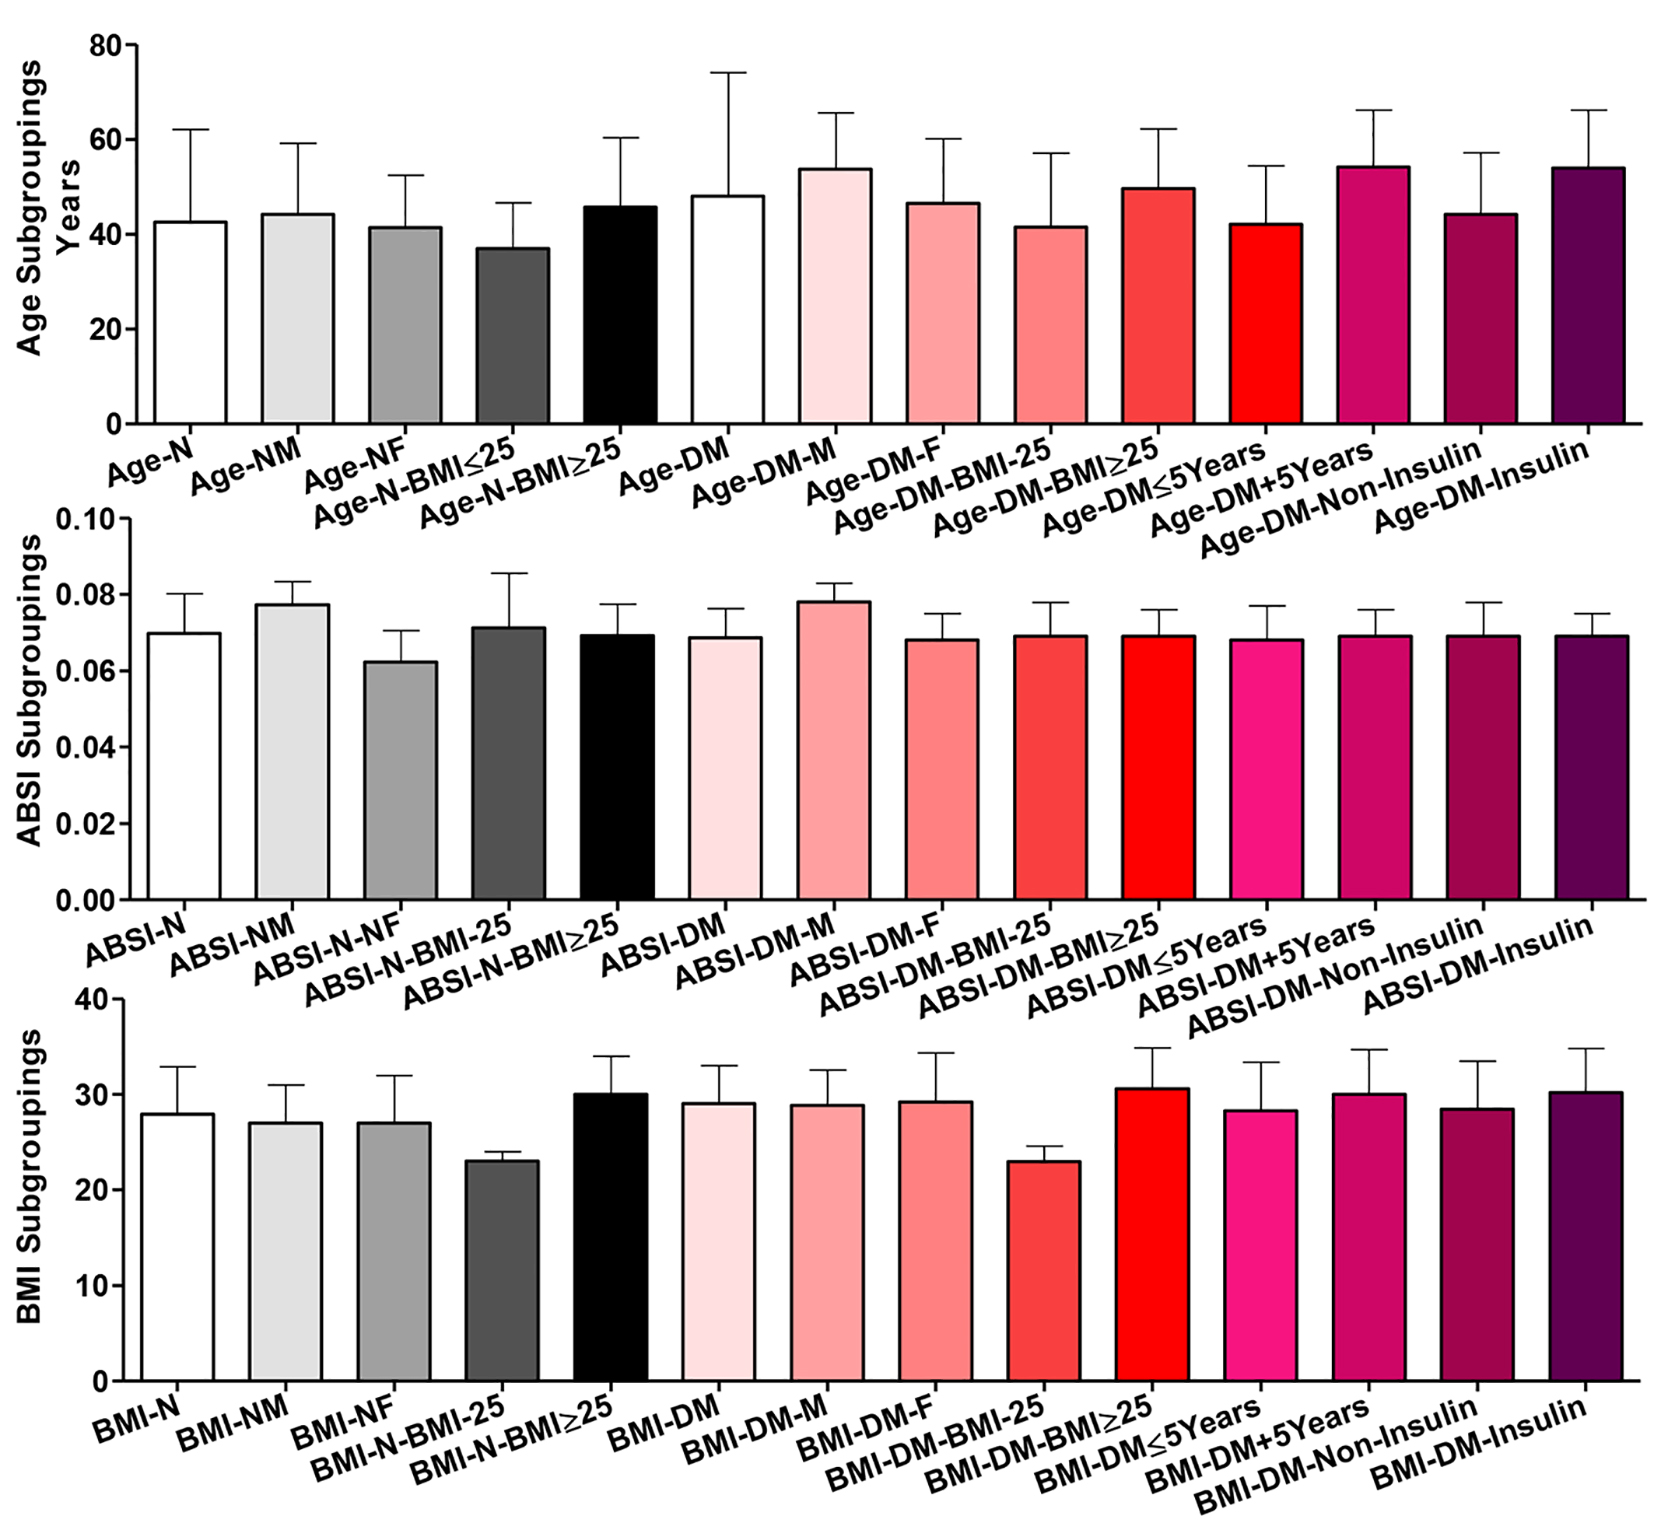
Figure 1. Age, body shape index (ABSI) and body mass index (BMI) distribution among all participants (normal healthy controls = N in black shades and diabetic patients = T2DM in red shades). Participants were subgrouped according to gender (M: male; F: female) and BMI (˂ 25 and ≥ 25). T2DM patients were further subgrouped according to disease duration (≤ 5 and ˃ 5 years) and treatment received (non-insulin and insulin). Data are shown as mean ± SEM. For significance of differences, see the text.
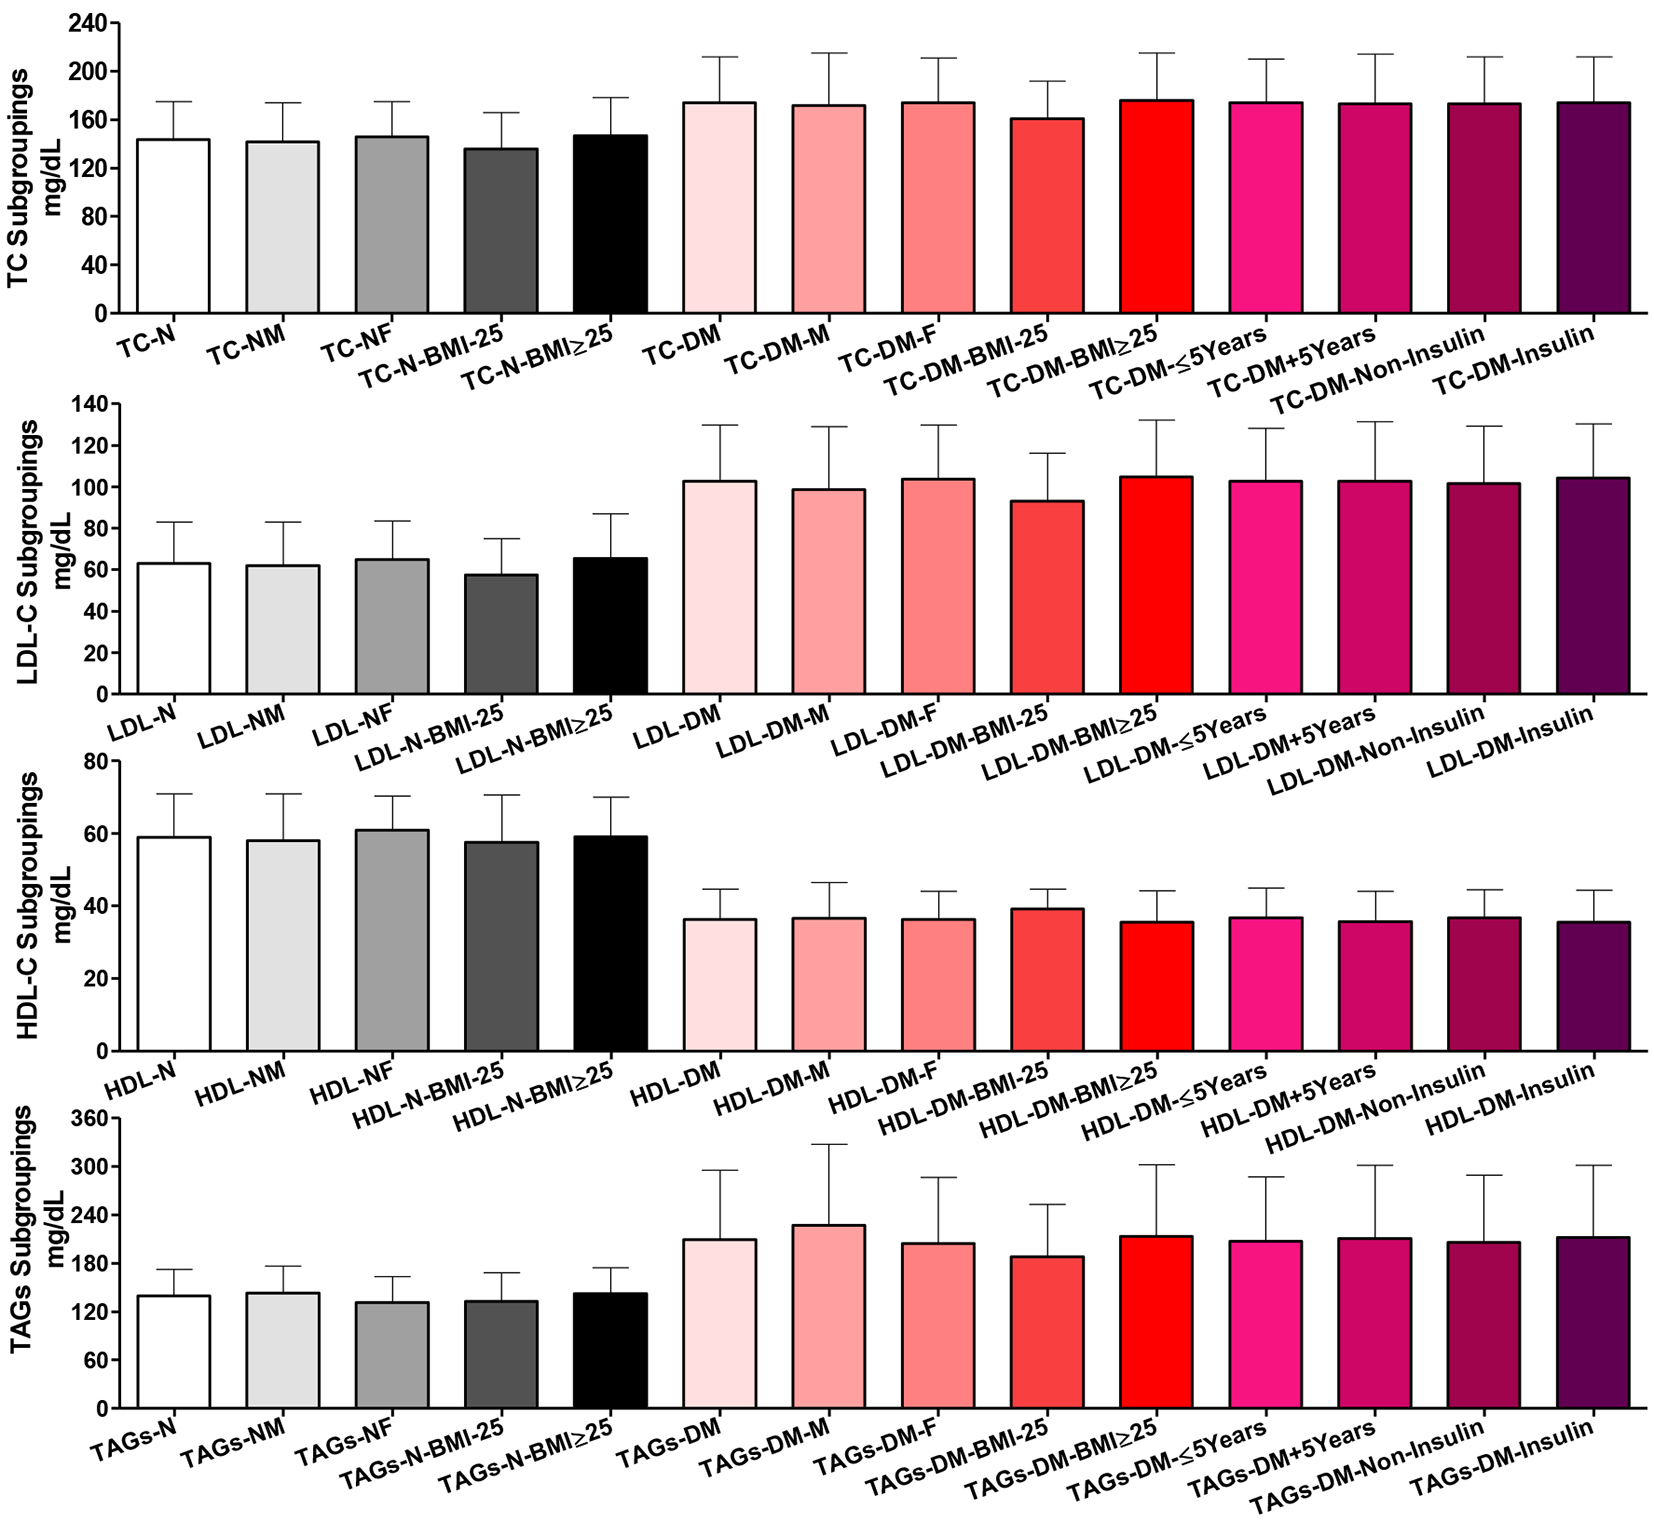
Figure 2. Plasma lipogram findings among all participants. Participants’ subgroups, abbreviations and color indication are the same as in Figure 1. TC: serum total cholesterol, LDL-C: LDL-cholesterol, HDL-C: HDL-cholesterol; TAGs: triacylglycerols. Data are shown as mean ± SEM.
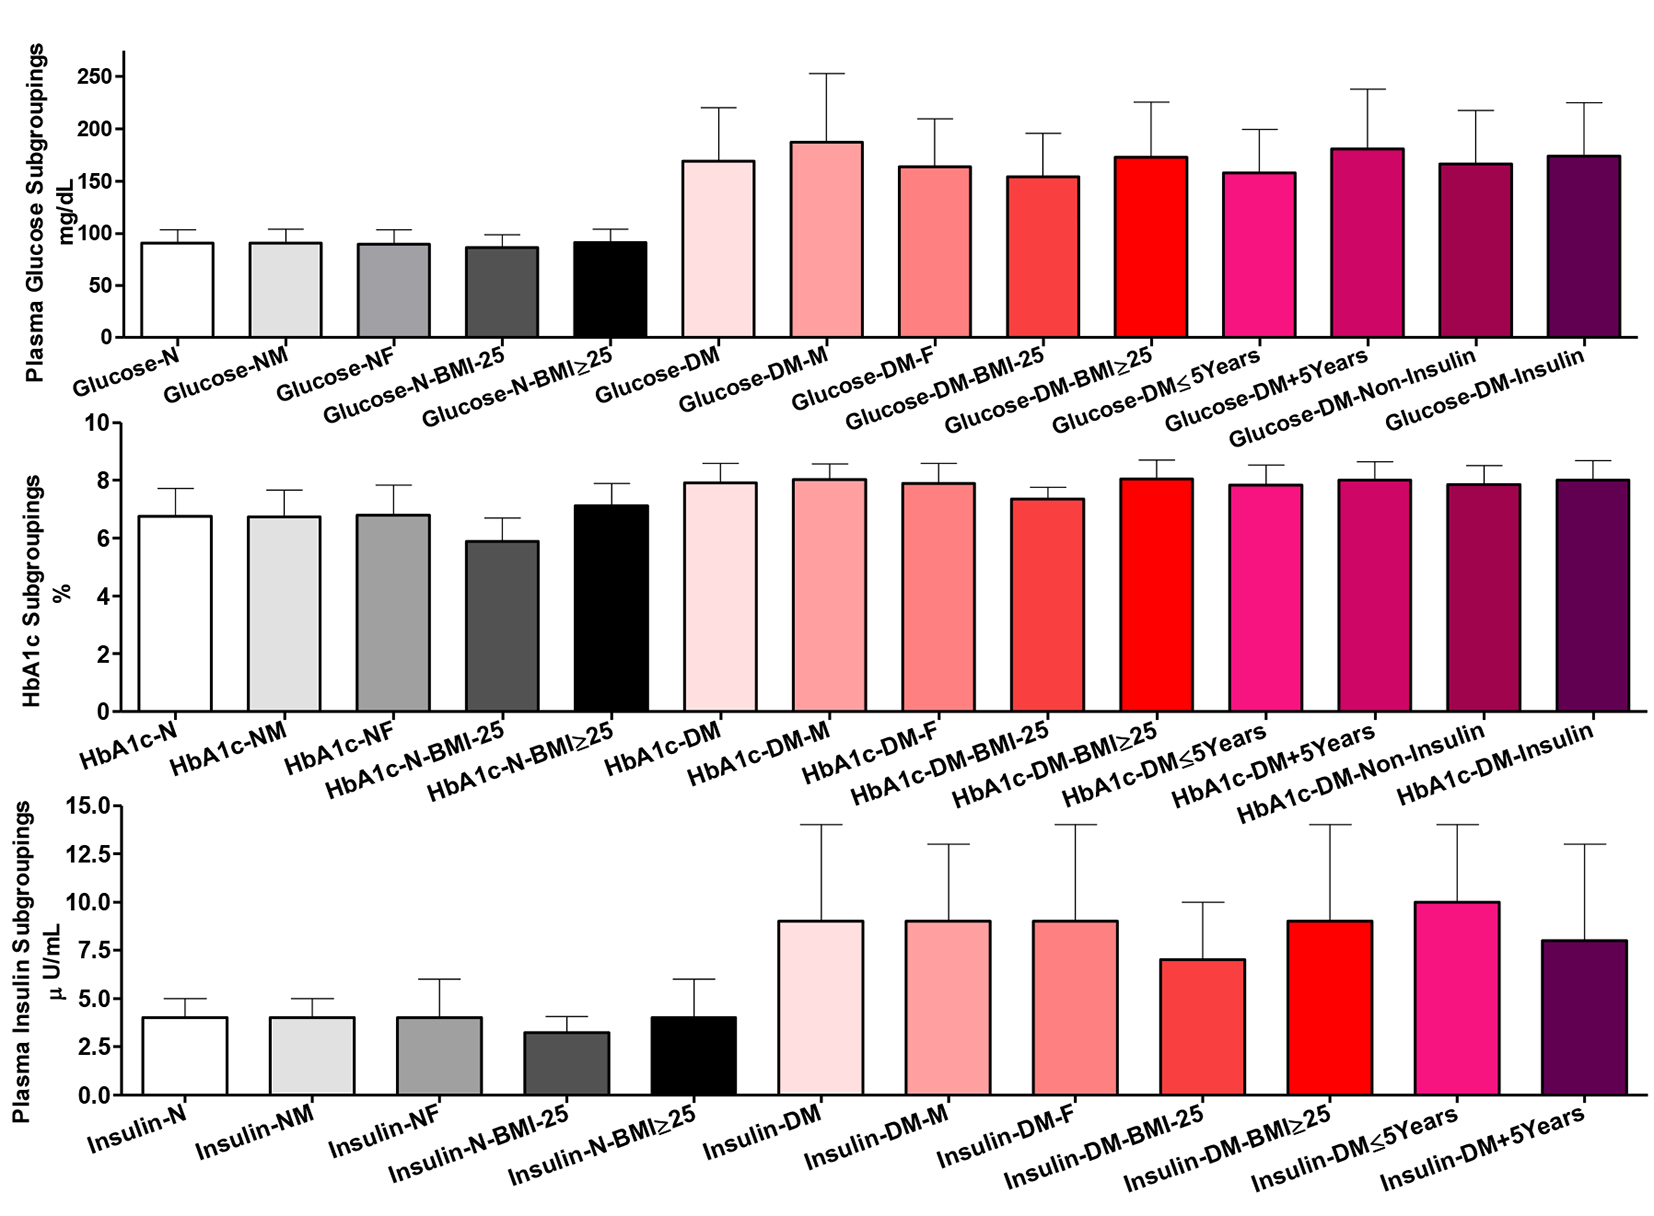
Figure 3. Glycemic control indices among all participants in plasma and whole blood. Participants’ subgroups, abbreviations and color indication are the same as in Figure 1. Data shown are mean ± SEM.
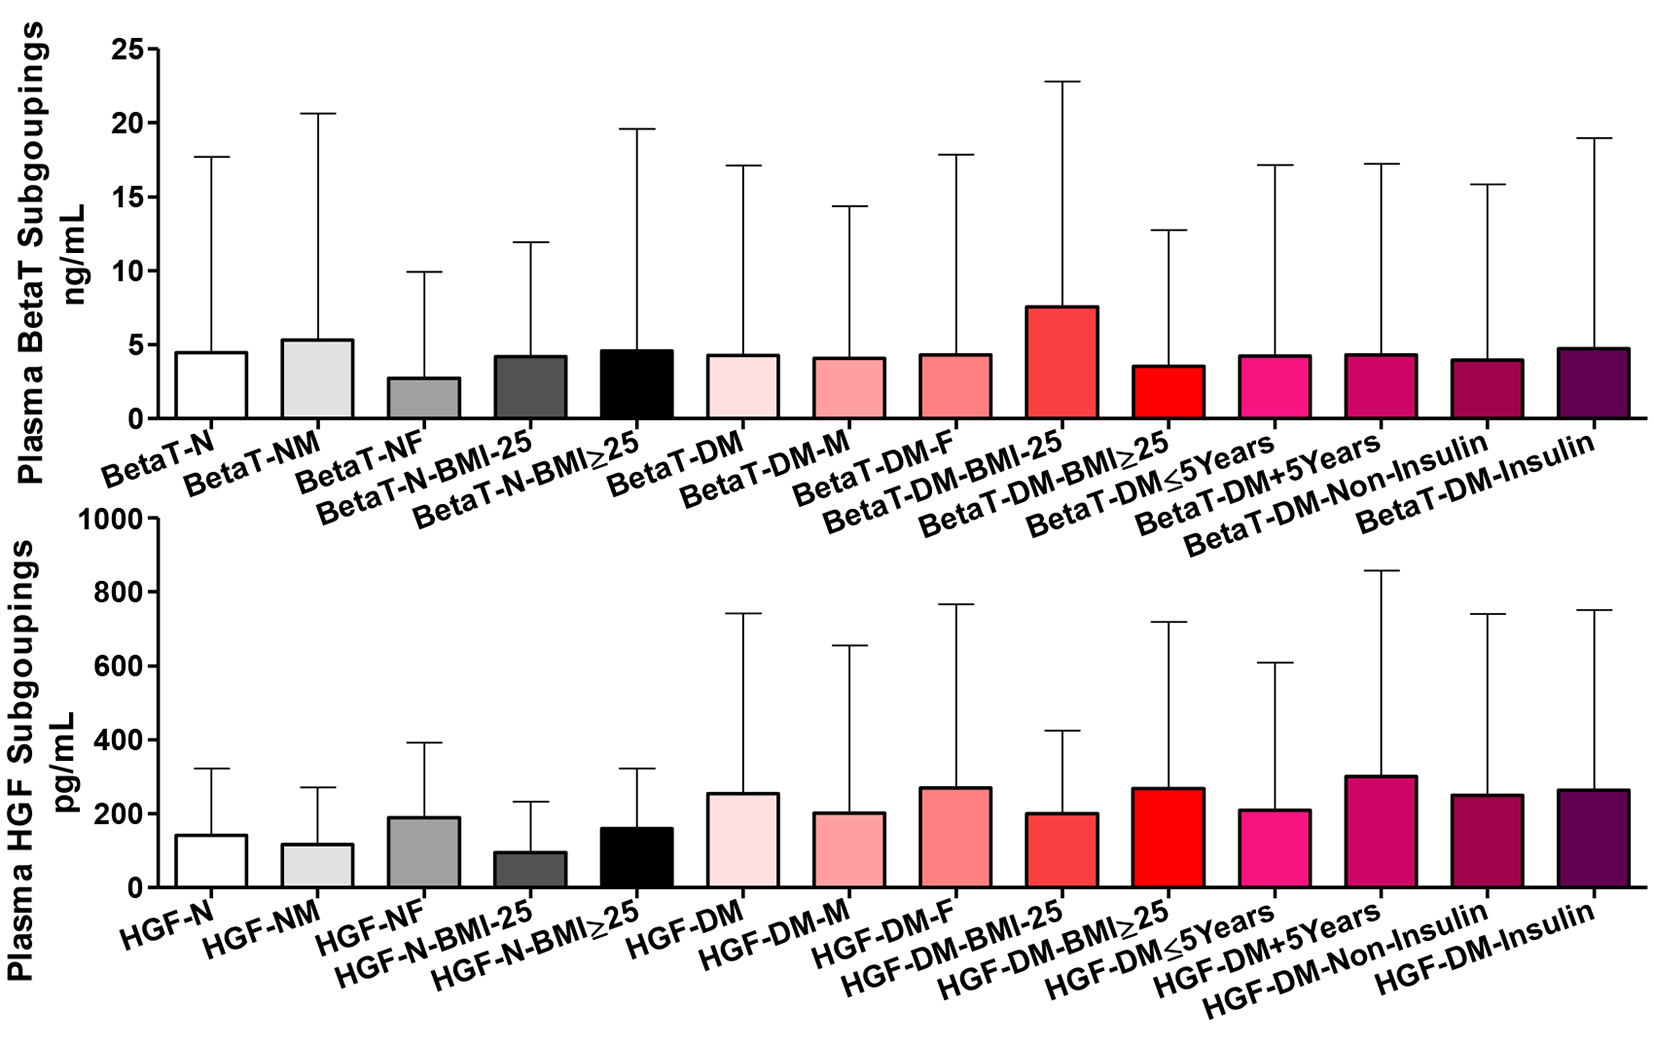
Figure 4. Plasma betatrophin (BetaT) and hepatocyte growth factors (HGF) among all participants. Participants’ subgroups, abbreviations and color indication are the same as in Figure 1. Data are shown as mean ± SEM.
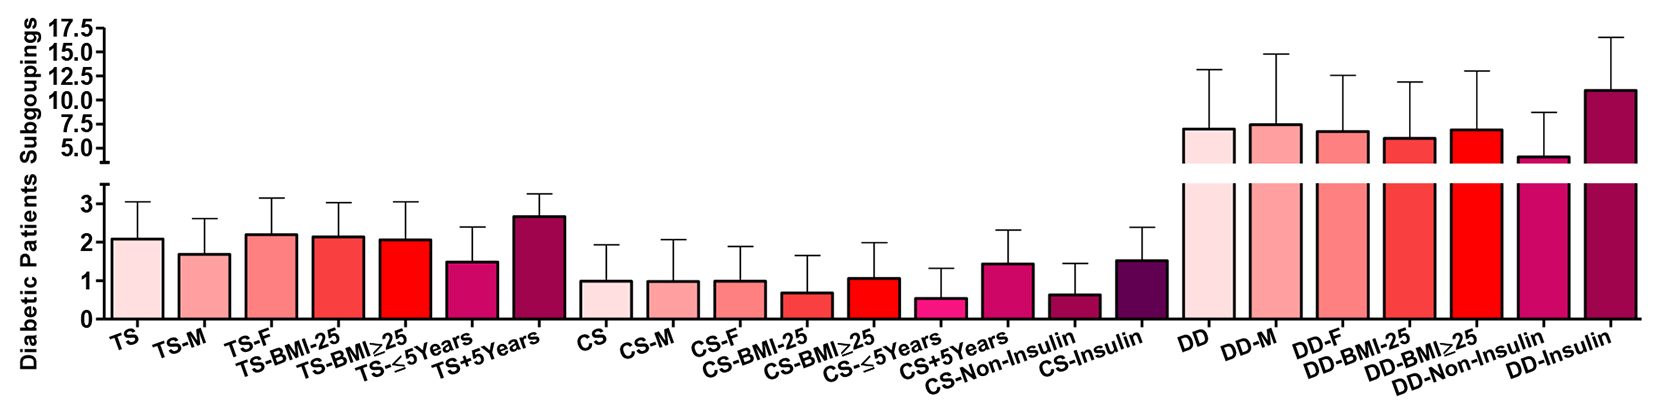
Figure 5. Subgroup of the type 2 diabetic patients according to their treatment score (TS), complication/severity score (CS) and their disease duration (DD). Data are shown as mean ± SEM.