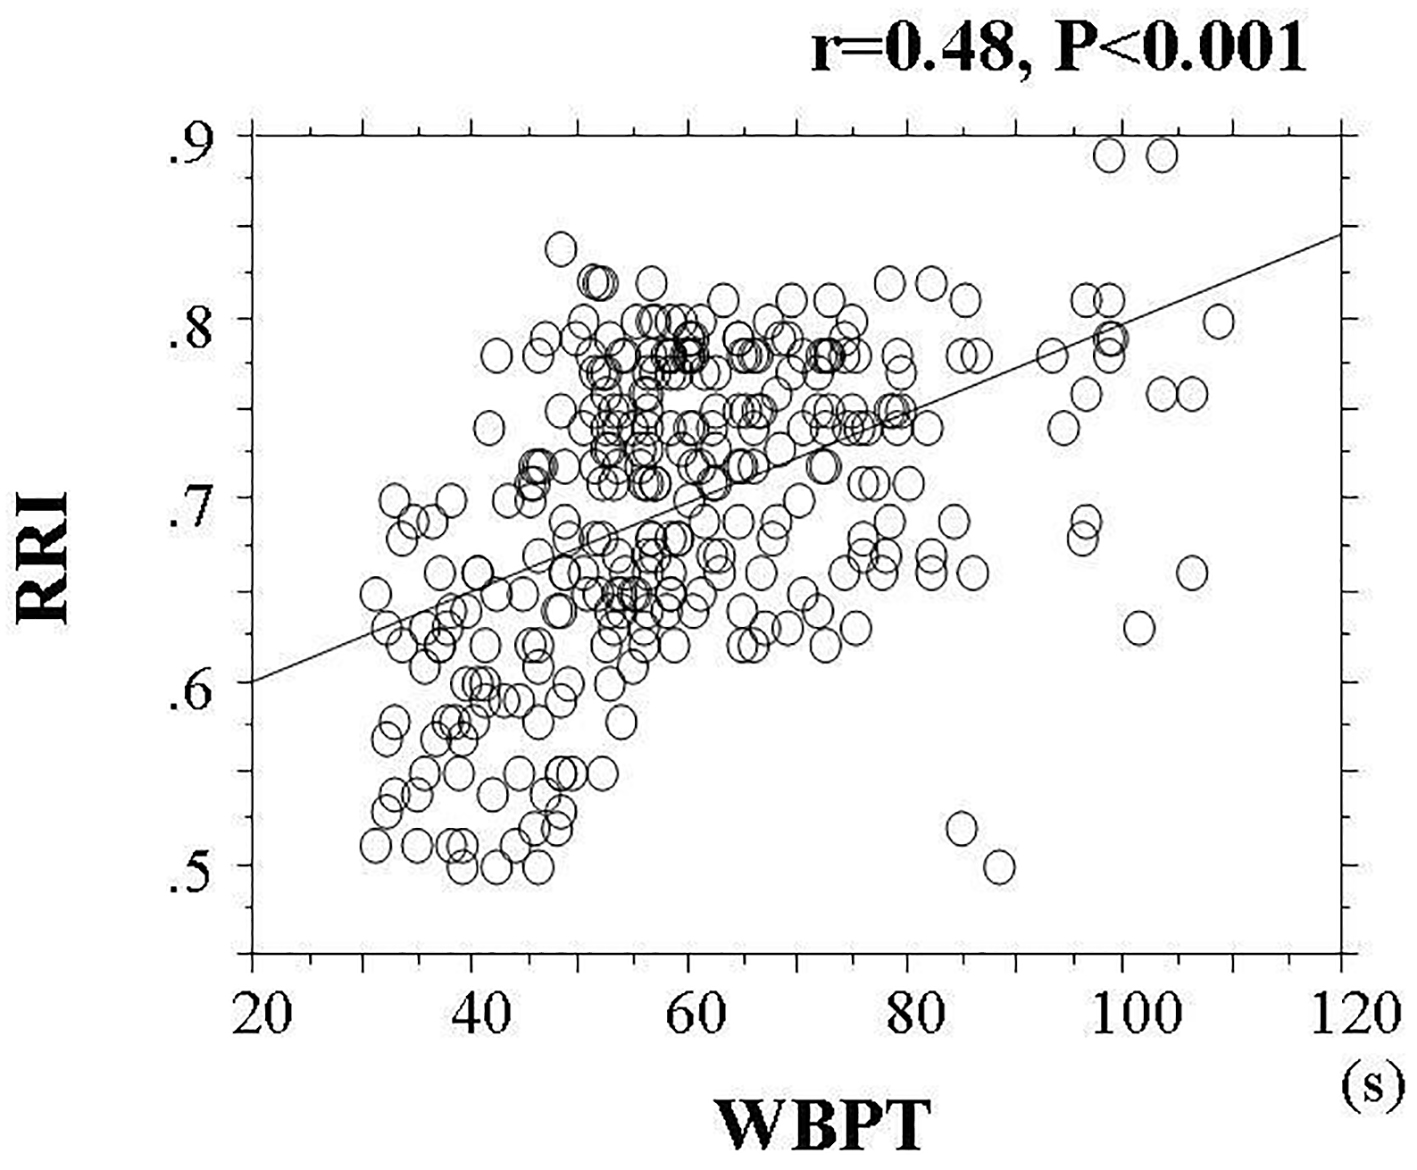
Figure 1. Correlation Between WBPT and RRI. The statistically significant positive correlation between WBPT and RRI (r = 0.48, P < 0.001). WBPT: whole blood passage time; RRI: renal resistive index.
| Journal of Endocrinology and Metabolism, ISSN 1923-2861 print, 1923-287X online, Open Access |
| Article copyright, the authors; Journal compilation copyright, J Endocrinol Metab and Elmer Press Inc |
| Journal website http://www.jofem.org |
Original Article
Volume 7, Number 5, October 2017, pages 146-152
Clinical Impact of Hemorheology Assessed Using the Microchannel Array Flow Analyzer on Renal Resistive Index in Patients With Type 2 Diabetes Mellitus
Figures
Tables
| Continuous values are mean ± SD. HOMA-IR: homeostasis assessment insulin resistance; LDL: low-density lipoprotein; HDL: high-density lipoprotein; eGFR: estimated glomerular filtration rate; d-ROMs: derivatives of reactive oxygen metabolites; RRI: renal resistive index; WBPT: whole blood passage time; RAS: renin-angiotensin system; DPP: dipeptidyl peptidase. | |
| n (male/female) | 302 (121/181) |
| Age (years) | 66 ± 12 |
| Body mass index | 23.6 ± 3.8 |
| Current smoker, n (%) | 57 (19) |
| Systolic blood pressure (mm Hg) | 143 ± 9 |
| Diastolic blood pressure (mm Hg) | 90 ± 12 |
| Pulse pressure (mm Hg) | 53 ± 13 |
| Pulse rate (/min) | 68 ± 11 |
| White blood cell (/µL) | 6,490 ± 1,220 |
| Red blood cell (104/µL) | 420 ± 40 |
| Hematocrit (%) | 38.0 ± 4.0 |
| Platelet (104/µL) | 21.2 ± 6.5 |
| Fasting blood glucose (mg/dL) | 134 ± 24 |
| Immunoreactive insulin (µg/mL) | 7.3 ± 4.4 |
| HOMA-IR | 2.5 ± 1.5 |
| Hemoglobin A1c (%) | 7.1 ± 1.3 |
| Skin autofluorescence (AU) | 2.6 ± 0.6 |
| Total cholesterol (mg/dL) | 213 ± 40 |
| LDL-cholesterol (mg/dL) | 135 ± 35 |
| Triglyceride (mg/dL) | 129 ± 63 |
| HDL-cholesterol (mg/dL) | 52 ± 15 |
| eGFR (mL/min/1.73 m2) | 63.5 ± 25.7 |
| Log-urinary albumin (mg/g Cr) | 1.52 ± 0.53 |
| d-ROMs test (U Carr) | 334 ± 99 |
| WBPT (s) | 59.3 ± 16.1 |
| RRI | 0.70 ± 0.08 |
| Medication | |
| Sulfonylurea, n (%) | 157 (52) |
| Metformin, n (%) | 81 (27) |
| DPP-4 inhibitor, n (%) | 172 (57) |
| Insulin, n (%) | 21 (7) |
| RAS inhibitor, n (%) | 166 (55) |
| Statin, n (%) | 163 (54) |
| r | ||
|---|---|---|
| RRI | WBPT | |
| r expressed correlation coefficient. HOMA-IR: homeostasis assessment insulin resistance; LDL: low-density lipoprotein; HDL: high-density lipoprotein; d-ROMs: derivatives of reactive oxygen metabolites; eGFR: estimated glomerular filtration rate; DPP: dipeptidyl peptidase; RAS: renin-angiotensin system. *P < 0.001, **P < 0.01, ***P < 0.05. | ||
| Sex (Female=0, Male=1) | -0.06 | 0.07 |
| Age | 0.26* | 0.06 |
| Body mass index | 0.09 | 0.16** |
| Current smoker (No=0, Yes=1) | 0.12*** | 0.13*** |
| Systolic blood pressure | 0.03 | 0.04 |
| Diastolic blood pressure | -0.28* | 0.05 |
| Pulse pressure | 0.36* | 0.04 |
| Pulse rate | 0.07 | 0.05 |
| White blood cell | 0.06 | 0.06 |
| Red blood cell | 0.10 | 0.10 |
| Hematocrit | 0.11 | 0.13*** |
| Platelet | 0.07 | 0.07 |
| Fasting blood glucose | 0.11 | 0.10 |
| Immunoreactive insulin | 0.05 | 0.05 |
| HOMA-IR | 0.06 | 0.08 |
| Hemoglobin A1c | 0.16** | 0.12*** |
| Skin autofluorescence | 0.41* | 0.41* |
| Total cholesterol | 0.03 | 0.02 |
| LDL-cholesterol | 0.02 | 0.03 |
| Triglyceride | 0.09 | 0.13*** |
| HDL-cholesterol | -0.08 | 0.08 |
| eGFR | -0.20* | -0.08 |
| Log-urinary albumin | 0.34* | 0.45* |
| d-ROMs test | 0.40* | 0.41* |
| Sulfonylurea (no = 0, yes = 1) | 0.03 | -0.08 |
| Metformin (no = 0, yes = 1) | -0.05 | -0.06 |
| DPP-4 inhibitor (no = 0, yes = 1) | -0.04 | -0.07 |
| Insulin (no = 0, yes = 1) | 0.08 | 0.09 |
| RAS inhibitor (no = 0, yes = 1) | -0.08 | -0.07 |
| Statin (no = 0, yes = 1) | -0.08 | -0.09 |
| Explanatory factor | β | P value |
|---|---|---|
| R2 = 0.33. RRI: renal resistive index; WBPT: whole blood passage time; d-ROMs: derivatives of reactive oxygen metabolites; eGFR: estimated glomerular filtration rate; β: standardized regression coefficient; R2: coefficient of determination. | ||
| WBPT | 0.37 | < 0.001 |
| Pulse pressure | 0.24 | < 0.001 |
| Log-urinary albumin | 0.22 | < 0.001 |
| Skin autofluorescence | 0.21 | < 0.001 |
| d-ROMs test | 0.15 | < 0.01 |
| Age | 0.12 | < 0.05 |
| eGFR | -0.09 | 0.061 |