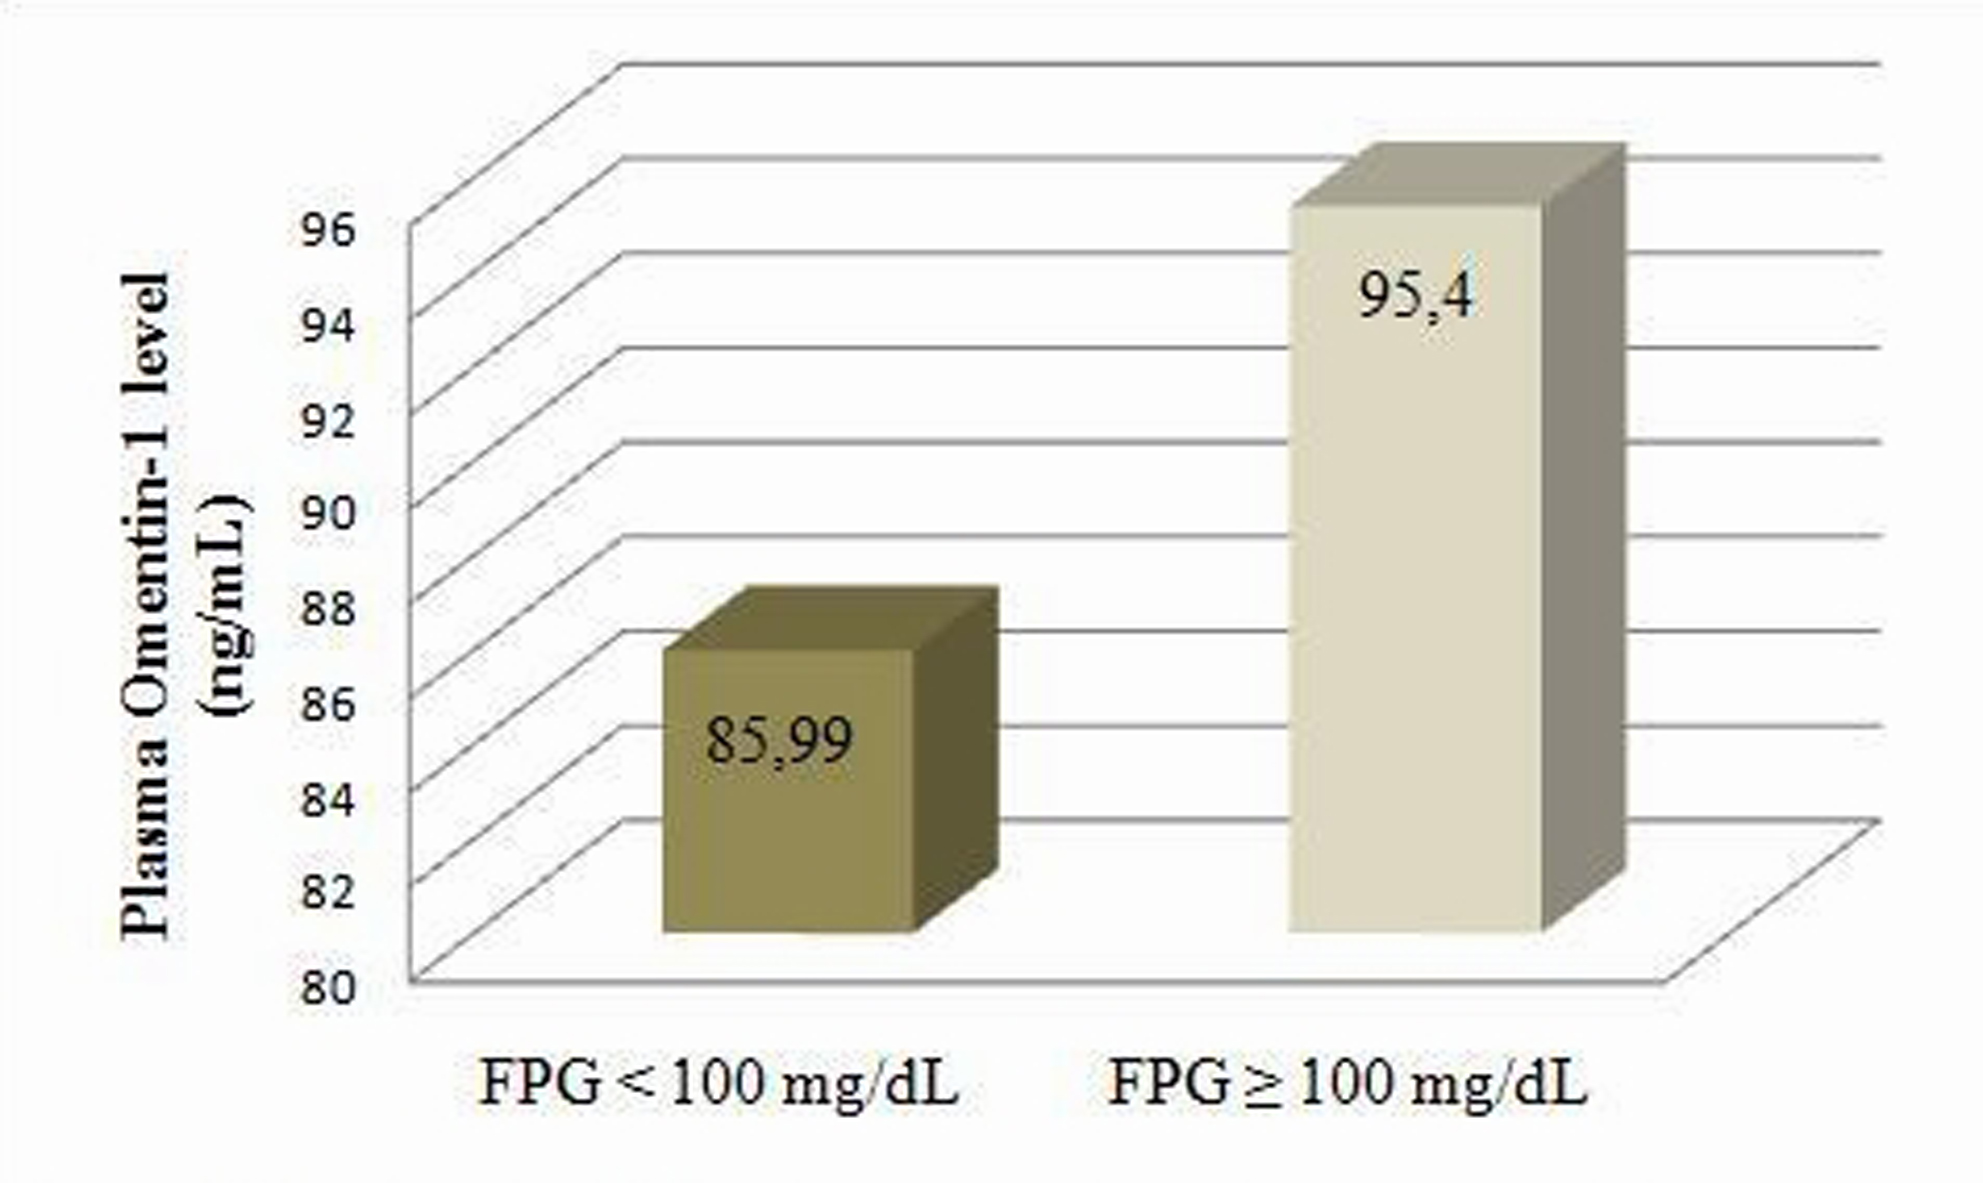
Figure 1. Plasma Omentin-1 levels according to fasting plasma glucose categories
| Journal of Endocrinology and Metabolism, ISSN 1923-2861 print, 1923-287X online, Open Access |
| Article copyright, the authors; Journal compilation copyright, J Endocrinol Metab and Elmer Press Inc |
| Journal website http://www.jofem.org |
Original Article
Volume 1, Number 4, October 2011, pages 182-187
Plasma Omentin-1 Levels Are Similar in Nondiabetic Metabolic Syndrome Patients and Healthy Subjects
Figures
Tables
| Group 1 | Group 2 | Group 3 | p | |
|---|---|---|---|---|
| Group 1: Prediabetic metabolic syndrome patients; Group 2: Normoglycemic metabolic syndrome patients; Group 3: Control subjects. | ||||
| Age (years) | 45.96 ± 4.85 | 43.36 ± 7.18 | 43.27 ± 5.36 | 0.178 |
| Weight (kg) | 85.34 ± 14.9 | 84.8 ± 10.98 | 69.39 ± 14.5 | < 0.0001 |
| BMI (kg/m2) | 31.29 ± 4.06 | 30.27 ± 4.08 | 26.01 ± 4.79 | < 0.0001 |
| Waist circumference (cm) | 105.08 ± 11.51 | 102.2 ± 9 | 84.83 ± 13.72 | < 0.0001 |
| Hip cicumference (cm) | 113.6 ± 7.07 | 110.32 ± 9.7 | 104.4 ± 10.97 | 0.002 |
| Waist/Hip ratio | 0.92 ± 0.07 | 0.93 ± 0.07 | 0.81 ± 0.07 | < 0.0001 |
| Systolic blood pressure (mmHg) | 132.4 ± 16.90 | 122.8 ± 15.68 | 116.67 ± 13.98 | 0.0027 |
| Diastolic blood pressure (mmHg) | 80 ± 9.13 | 76.2 ± 10.54 | 73.5 ± 11.68 | 0.085 |
| Group 1 | Group 2 | Group 3 | p | |
|---|---|---|---|---|
| Group 1: Prediabetic metabolic syndrome patients; Group 2: Normoglycemic metabolic syndrome patients; Group 3: Control subjects. | ||||
| Fasting plasma glucose (mg/dl) | 108.92 ± 7.2 | 90.04 ± 7.76 | 91.67 ± 9.6 | < 0.0001 |
| Total cholesterol (mg/dl) | 217.72 ± 52.42 | 209.72 ± 33.12 | 205.77 ± 36.48 | 0.79 |
| Triglyceride (mg/dl) | 213.64 ± 114.32 | 215.88 ± 87.3 | 94.07 ± 38.26 | < 0.0001 |
| HDL-C (mg/dl) | 47.04 ± 10.46 | 41.76 ± 7.95 | 61 ± 14.18 | < 0.0001 |
| LDL-C (mg/dl) | 150.04 ± 41.7 | 145.92 ± 26.88 | 134.07 ± 29.37 | 0.18 |
| HbA1C (%) | 5.85 ± 0.43 | 5.65 ± 0.29 | 5.44 ± 0.31 | 0.0001 |
| Group 1 | Group 2 | Group 3 | |
|---|---|---|---|
| Group 1: Prediabetic metabolic syndrome patients; Group 2: Normoglycemic metabolic syndrome patients; Group 3: Control subjects. | |||
| Plasma Omentin-1 (ng/mL) | 95.98 ± 25.85 | 85.08 ± 19.05 | 87.83 ± 17.10 |
| BMI groups | |||
|---|---|---|---|
| < 25 kg/m2 | 25 - 29.9 kg/m2 | ≥ 30 kg/m2 | |
| Plasma Omentin-1 (ng/mL) | 86.18 ± 14.67 | 90.60 ± 23.62 | 89.82 ± 20.82 |