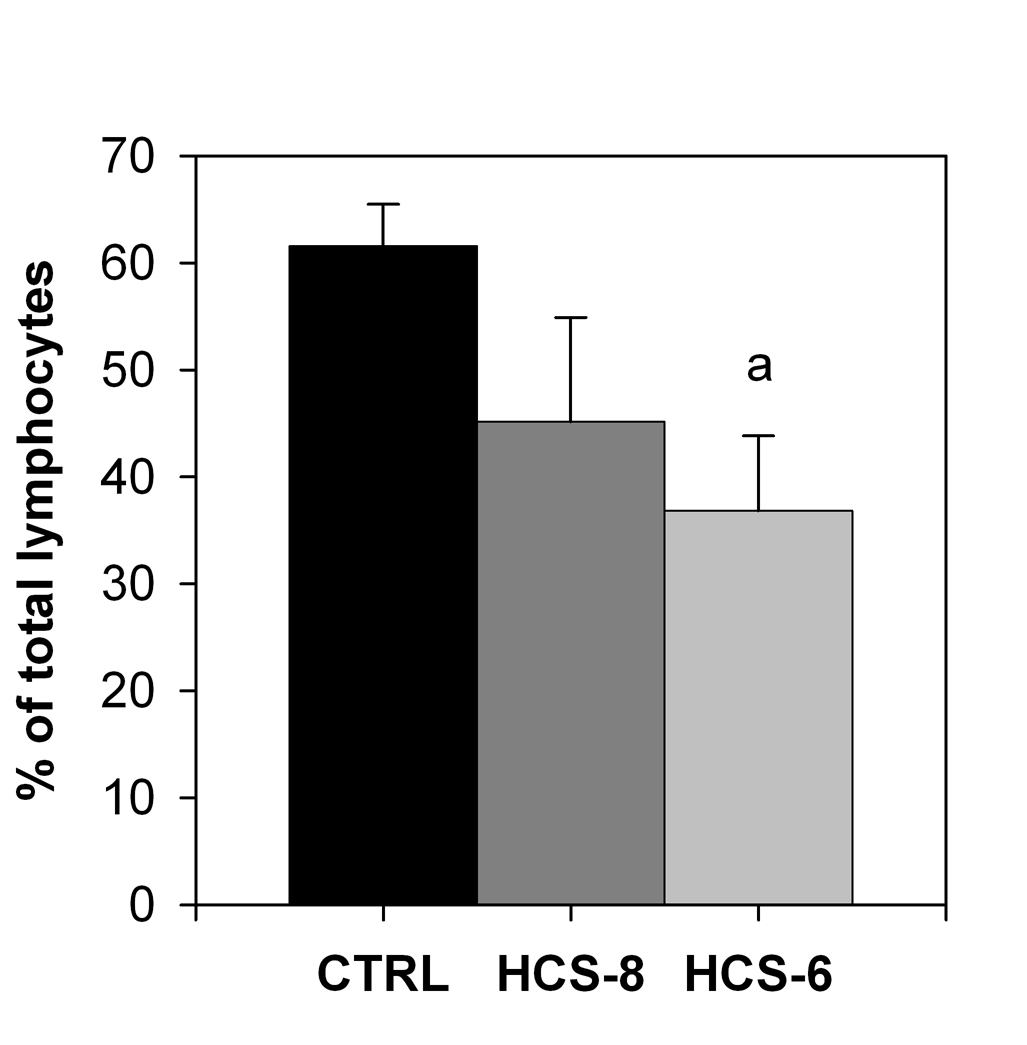
Figure 1. Effect of 10-8 M and 10-6 M hydrocortisone (HCS-8 and HCS-6, correspondingly) on the number of CD3+CD25+cells in 24-hour cell cultures stimulated with a PHA + LPS mixture for 24 hours. Values are means ± S.E.M. a: Significantly (P < 0.05) different from control (CTRL).
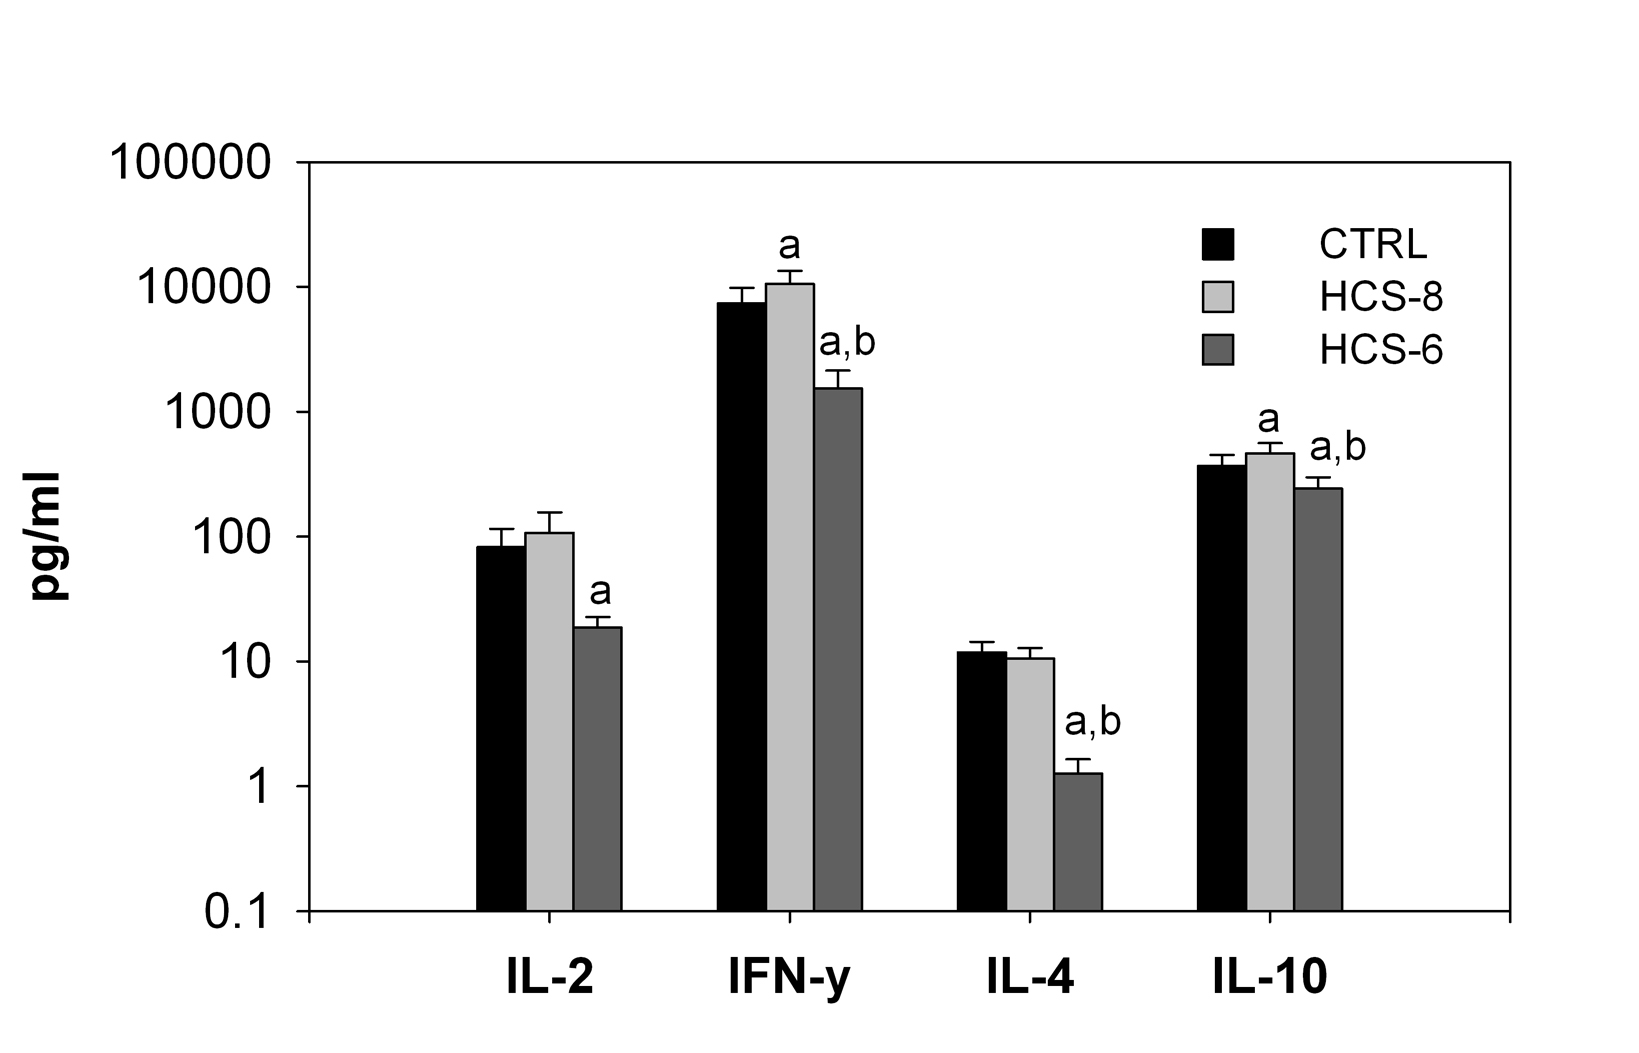
Figure 2. Effects of 10-8 M and 10-6 M hydrocortisone (HCS-8 and HCS-6, correspondingly) on cytokine secretion in 24-hour cell cultures stimulated with a PHA + LPS mixture. Values are means ± S.E.M. a: significantly different (P < 0.05) from CTRL culture. b: significant difference (P < 0.05) between HCS-8 and HCS-6 cultures.
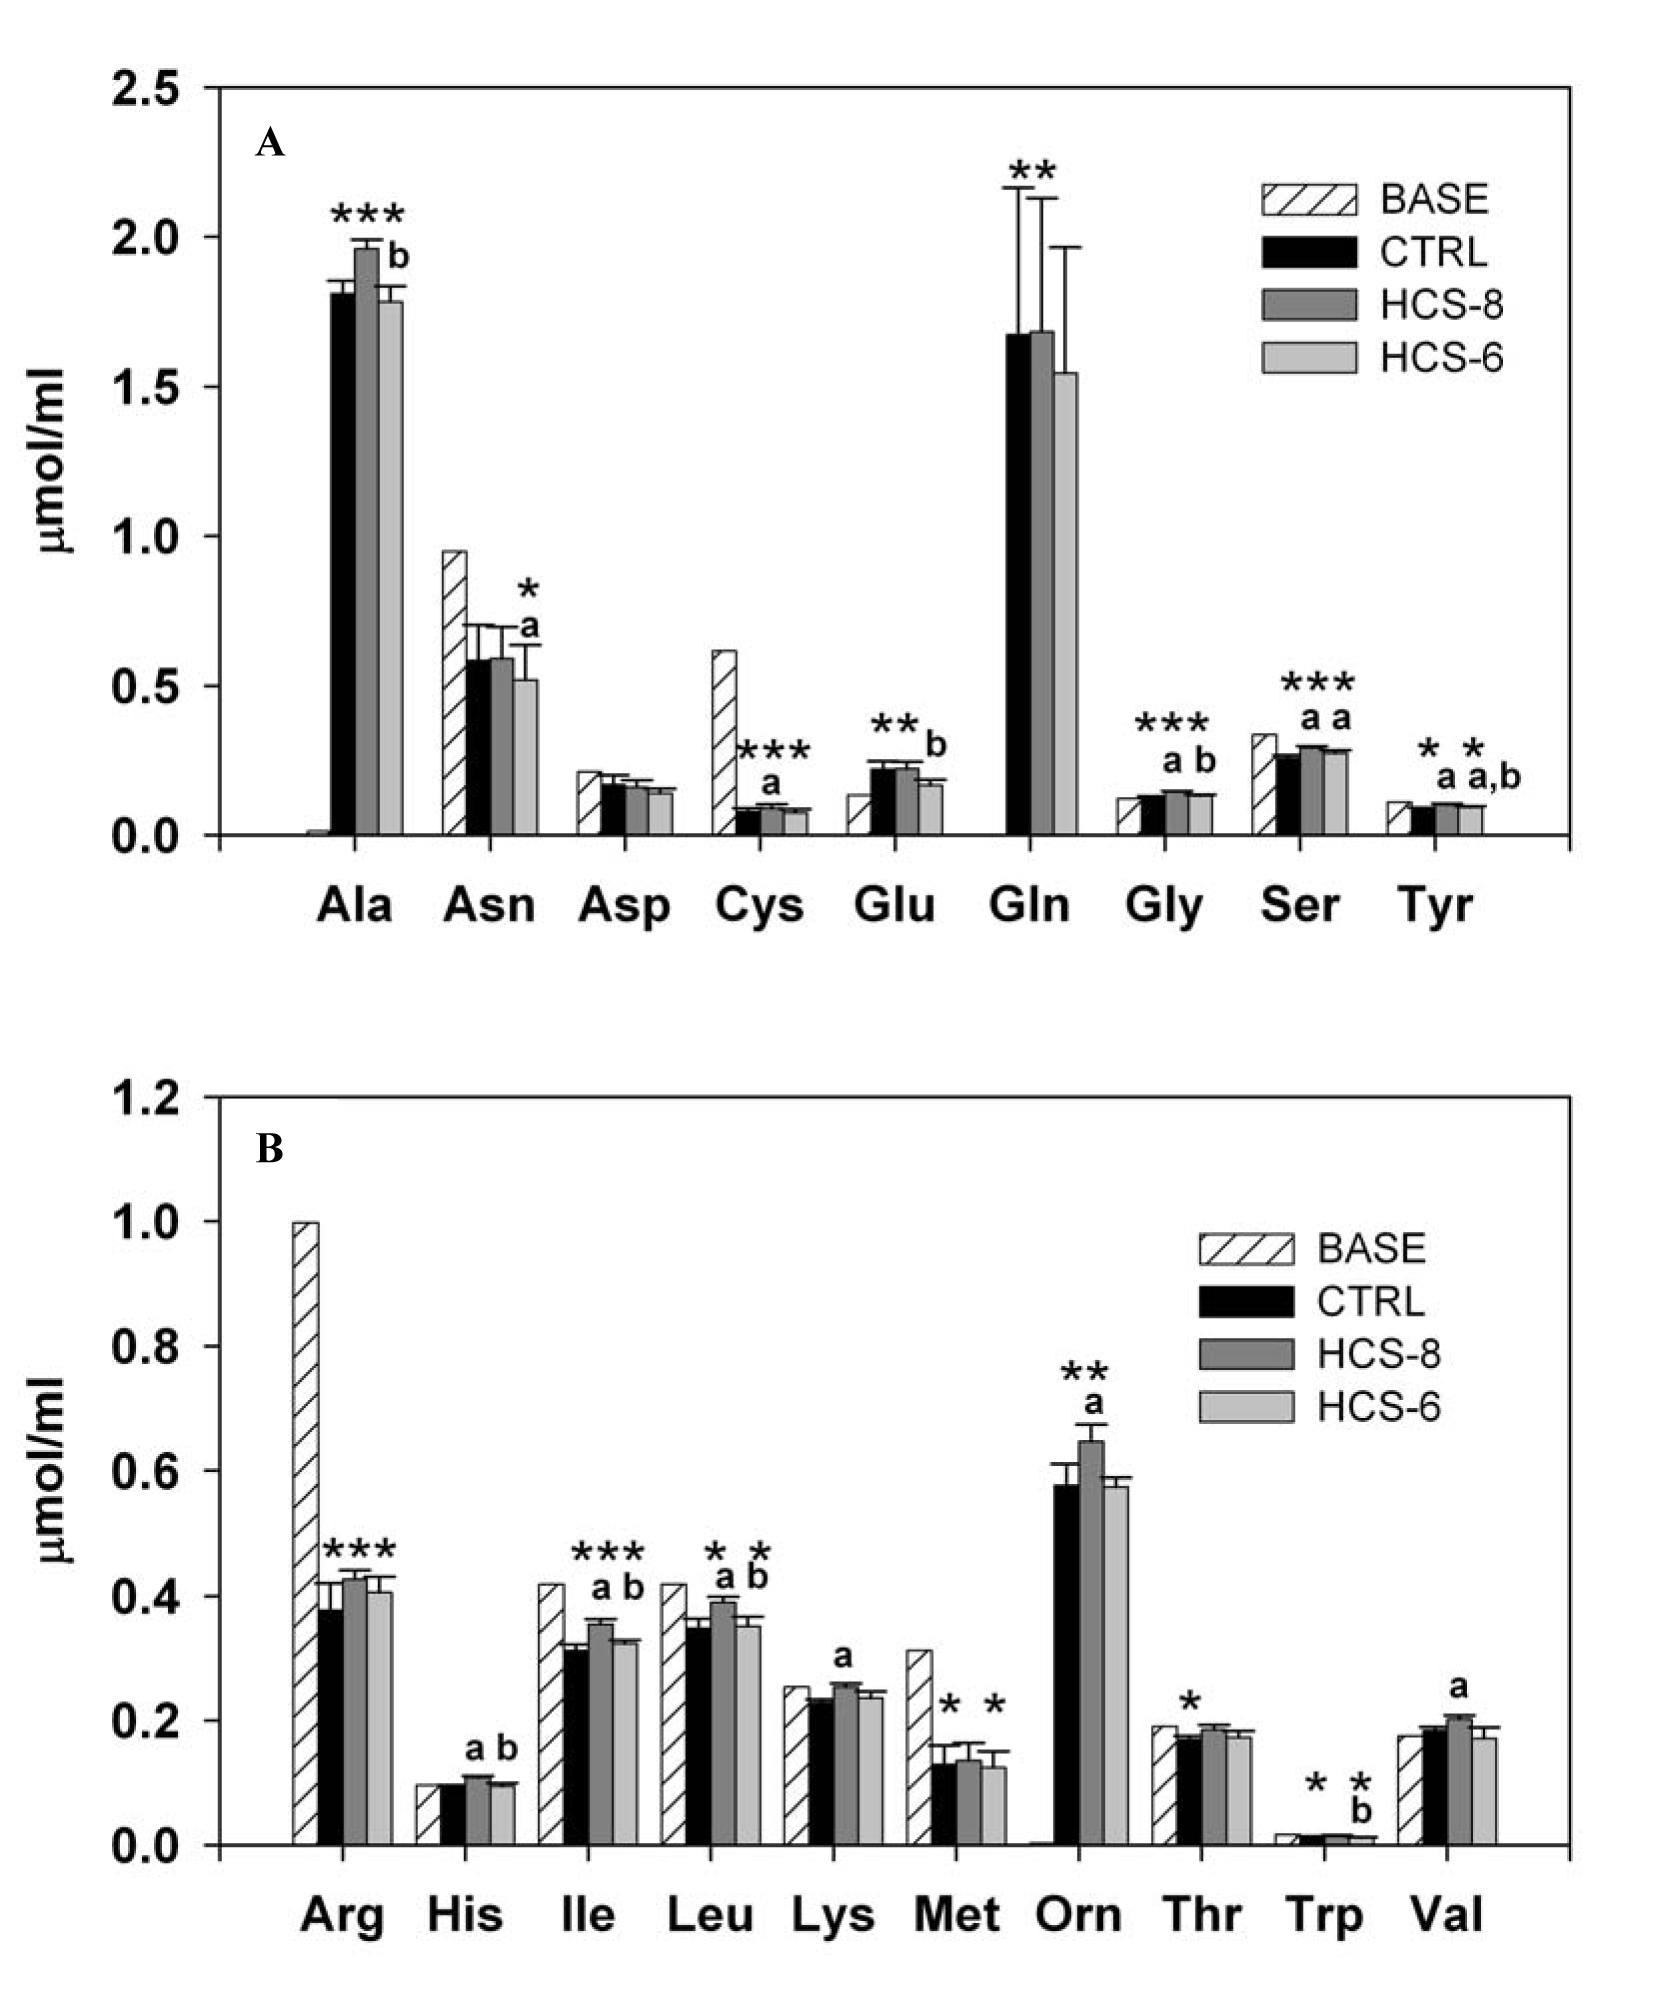
Figure 3. Effect of 10-8 M and 10-6 M hydrocortisone (HCS-8 and HCS-6, correspondingly) on the concentration of essential (A) and nonessential (B) amino acids in 24-hour cell cultures stimulated with a PHA + LPS mixture. Values are means ± S.E.M. Data are presented in comparison with the baseline (BASE) concentration measured in cell cultures before incubation.*, **, *** Statistically significant differences (P < 0.05) between cultures.*Significantly different from BASE; a: significantly different from CTRL; b: significant difference between HCS-8 and HCS-6 cultures.