Journal of Endocrinology and Metabolism, ISSN 1923-2861 print, 1923-287X online, Open Access
Article copyright, the authors; Journal compilation copyright, J Endocrinol Metab and Elmer Press Inc
Journal website http://www.jofem.org

Original Article

Volume 1, Number 5, December 2011, pages 220-226


Simultaneous Melatonin Administration Effectively Deprograms the Negative Influence of Neonatal Hypothyroidism on Immature Follicles but not on Mature Follicles and Body and Ovarian Weights

Figure

Figure 1.
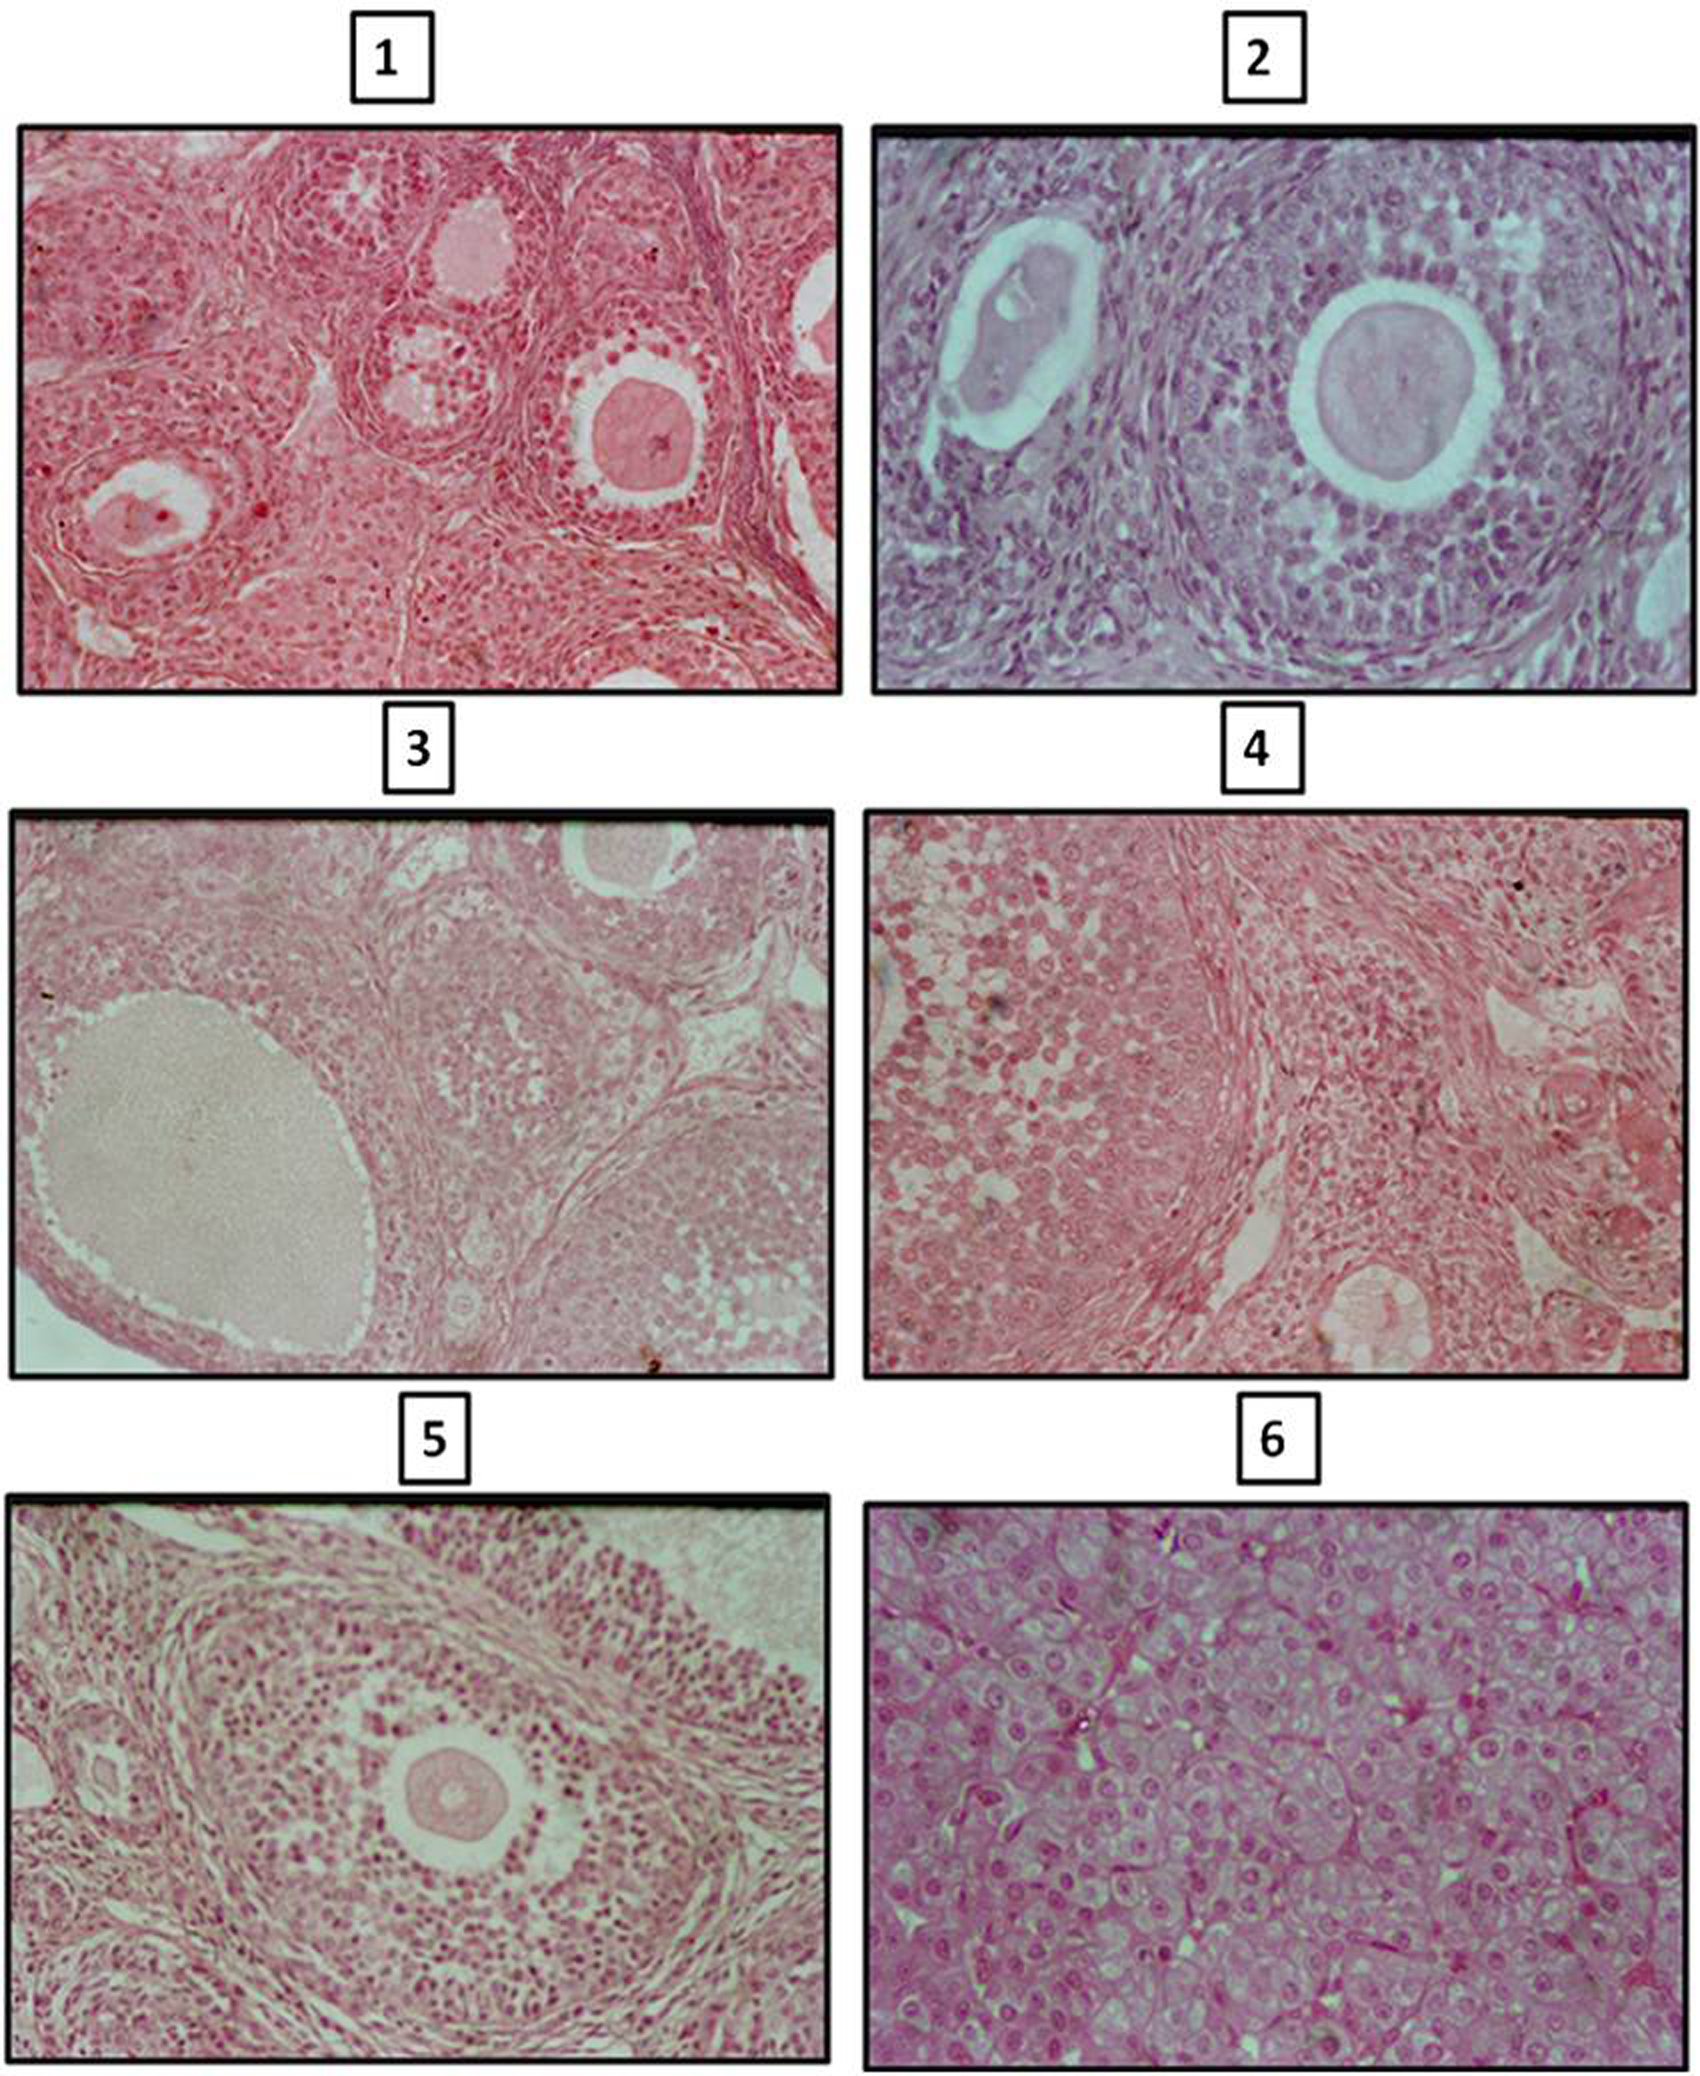
Figure 1. Photomicrographs of sections of ovary of control and melatonin treated hypothyroid rats. Sections of ovaries of 2 245 and 90 day old rats (1, 3, 5) showing less number of atretic follicles and number of primary, secondary and tertiary follicles compared to age matched melatonin treated hypothyroid rats (2, 4, 6).

Tables

Table 1. Chronological Alteration Showing Body Weight, Absolute and Relative Ovary Weight of Control and Melatonin Treated Hypothyroid Female Rats
 
TreatmentBody weightAbsolute ovary weightRelative ovary weight
22 days45 days90 days22 days45 days90 days22 days45 days90 days
C: Control; HPOT + MT: Melatonin treated Hypothyroid. Values expressed as mean ± SEM of six animals; aP < 0.01; bP < 0.005; cP < 0.0005.
C51.33 ± 1.87136.66 ± 4.17226.16 ± 9.570.024 ± 0.00030.062 ± 0.00690.076 ± 0.0070.046 ± 0.00060.045 ± 0.00150.034 ± 0.0025
HPOT + MT30.83 ± 0.47c82.00 ± 0.93c166.83 ± 4.47c0.014 ± 0.0012c0.026 ± 0.0022c0.048 ± 0.005b0.047 ± 0.00430.031 ± 0.0022c0.028 ± 0.0031


Table 2. Differential Total Follicular Count in Ovary of Control and Melatonin Treated Hypothyroid Female Rats
 
TreatmentAge in DaysFollicle typeOvarian Volume (mm3)
PrimordialPrimarySecondaryAntralCLAtretic
C: Control; HPOT + MT: Melatonin treated Hypothyroid. Values expressed as mean ± SEM of six animals; aP < 0.01; bP < 0.005; cP < 0.0005.
C22821 ± 48531 ± 25350 ± 20181 ± 04-10 ± 0.80.58
45426 ± 17162 ± 11245 ± 10142 ± 08-29 ± 020.68
90300 ± 13168 ± 0896 ± 0472 ± 0548 ± 0536 ± 031.31
HPOT + MT22678 ± 36523 ± 29417 ± 2473 ± 05c-166 ± 21c0.41c
45452 ± 23239 ± 19b298 ± 17a93 ± 09b-209 ± 18c0.50c
90339 ± 16177 ± 13159 ± 09c58 ± 0342 ± 04221 ± 26c0.87c


Table 3. Hormonal Status of Control and Melatonin Treated Hypothyroid Female Rats
 
TreatmentEstradiolProgesterone
22 days45 days90 days22 days45 days90 days
C: Control; HPOT + MT: Melatonin treated Hypothyroid. Values expressed as mean± SEM of six animals; aP < 0.01; bP < 0.005; cP < 0.0005.
C2.04 ± 0.317.83 ± 0.7513.07 ± 1.554.75 ± 0.6821.75 ± 2.3931.59 ± 4.36
HPOT + MT3.10 ± 0.925.68 ± 0.529.39 ± 1.847.80 ± 0.35c21.75 ±1.3920.27 ± 3.47


Table 4. Hormonal Status of Control and Melatonin Treated Hypothyroid Female Rats
 
TreatmentT3T4
22 days45 days90 days22 days45 days90 days
C: Control; HPOT + MT: Melatonin treated Hypothyroid. Values expressed as mean ± SEM of six animals; aP < 0.01; bP < 0.005; cP < 0.0005.
C2.51 ± 0.513.03 ± 0.716.53 ± 0.6538.0 ± 1.3117.0 ± 6.1236.8 ± 25.5
HPOT + MT1.39 ± 0.435.50 ± 0.867.98 ± 0.3728.2 ± 3.7c268.2 ± 8.6c324.4 ± 18.5c