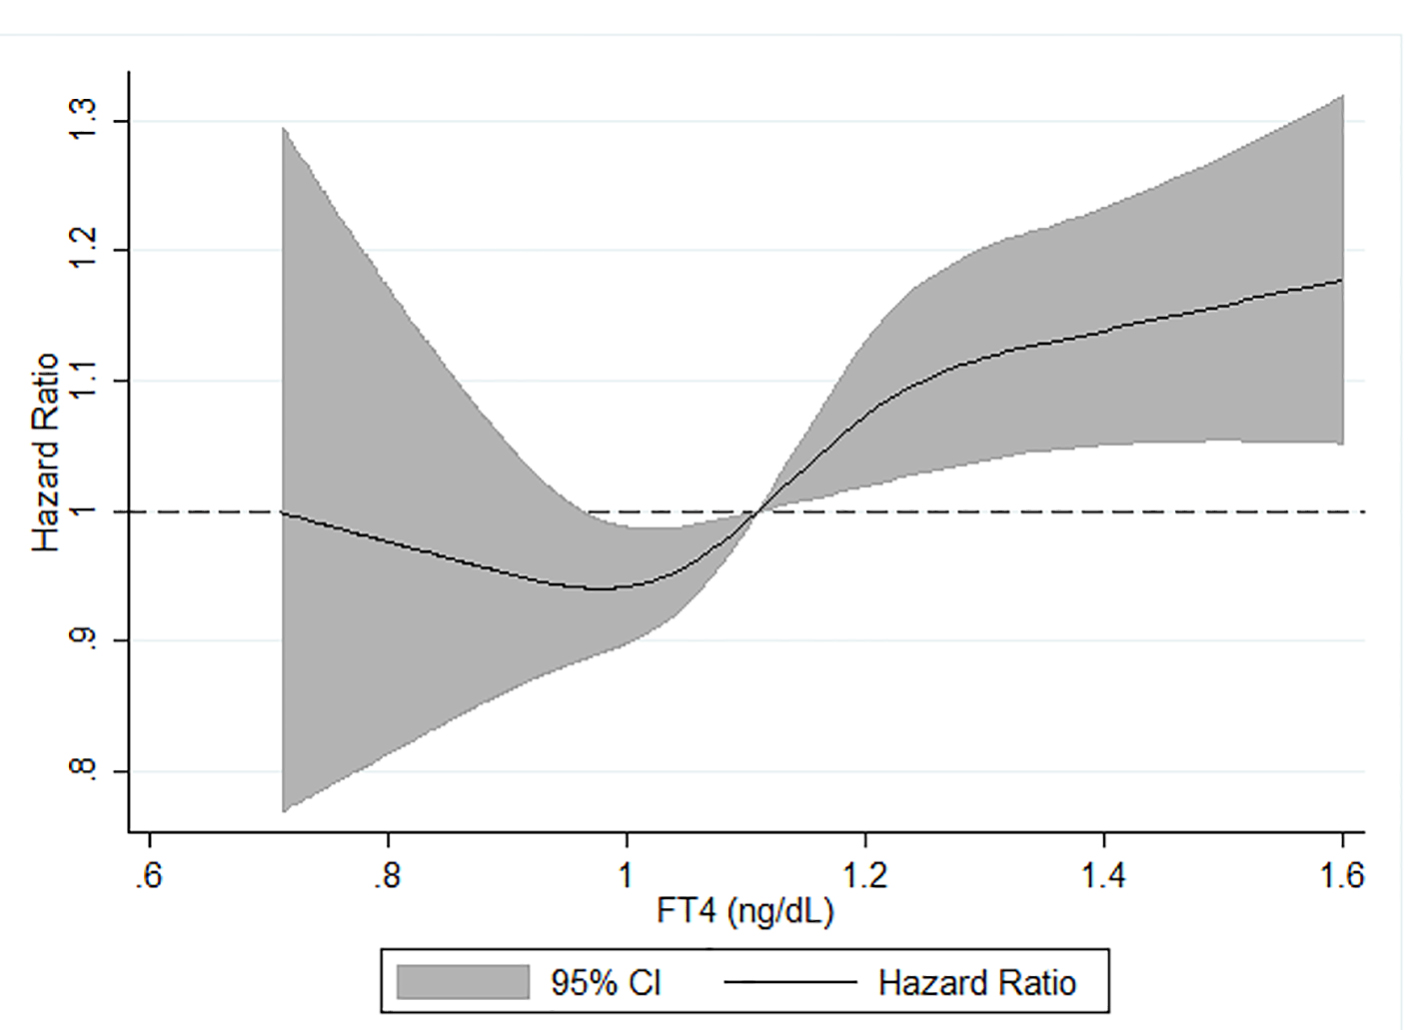
Journal of Endocrinology and Metabolism, ISSN 1923-2861 print, 1923-287X online, Open Access |
Article copyright, the authors; Journal compilation copyright, J Endocrinol Metab and Elmer Press Inc |
Journal website http://www.jofem.org |
Original Article
Volume 9, Number 4, August 2019, pages 82-89
Association Between Thyroid Dysfunction and Incident Dementia in the Atherosclerosis Risk in Communities Neurocognitive Study
Figure
Tables
Risk factors | Hypothyroidism | Euthyroidism (n = 10,956) | Hyperthyroidism | ||
---|---|---|---|---|---|
Overt (n = 281) | Subclinical (n = 581) | Subclinical (n = 429) | Overt (n = 234) | ||
TSH > 5.1 mIU/L; FT4 < 0.85 ng/dL | TSH > 5.1 mIU/L; FT4 = 0.85 - 1.4 ng/dL | TSH = 0.56 - 5.1 mIU/L; FT4 = 0.85 - 1.4 ng/dL | TSH < 0.56 mIU/L; FT4 = 0.85 - 1.4 ng/dL | TSH < 0.56 mIU/L; FT4 > 1.4 ng/dL | |
Mean ± standard deviation. aBased on self-report of some high school education or less at visit 1 (1987 - 1989). bBased on self-report of family income at visit 1 (1987 - 1989). cDefined as diastolic blood pressure ≥ 90 mm Hg, systolic blood pressure ≥ 140 mm Hg, or use of hypertensive medication. dDefined as non-fasting blood glucose ≥ 200 mg/dL, fasting blood glucose ≥ 126 mg/dL, self-report of diabetes, or reporting taking medication for diabetes or high blood sugar. eDefined as prevalent stroke, coronary heart disease, myocardial infarction, or atrial fibrillation at visit 2. fParticipants who reported thyroid medication use at baseline. ARIC: Atherosclerosis Risk in Communities; BMI: body mass index; HDL: high-density lipoprotein; CVD: cardiovascular disease; TSH: thyroid-stimulating hormone; FT4: free thyroxine; TPO: thyroid peroxidase. | |||||
Age, years | 58.4 ± 5.4 | 58.4 ± 5.7 | 56.8 ± 5.7 | 56.5 ± 5.8 | 57.1 ± 5.8 |
Men, % | 22.8 | 33.4 | 45.9 | 33.6 | 19.7 |
African American, % | 12.8 | 11.0 | 25.1 | 41.5 | 23.1 |
APOE4 carriers, % | 29.2 | 29.6 | 29.9 | 27.3 | 28.2 |
Basic educationa, % | 23.1 | 16.8 | 21.5 | 29.2 | 16.2 |
Family income < $16,000b, % | 24.2 | 21.3 | 25.2 | 34.3 | 22.2 |
Current alcohol drinker, % | 48.8 | 58.7 | 57.1 | 49.2 | 56.0 |
Current tobacco smoker, % | 13.9 | 12.9 | 22.3 | 29.6 | 25.2 |
BMI, kg/m2 | 28.9 ± 5.7 | 27.7 ± 5.5 | 28.0 ± 5.4 | 27.6 ± 5.4 | 27.4 ± 5.4 |
Hypertensionc, % | 34.1 | 30.9 | 35.8 | 40.0 | 32.6 |
Diabetesd, % | 7.5 | 10.3 | 11.3 | 15.9 | 12.8 |
HDL cholesterol, mg/dL | 49.4 ± 16.6 | 49.7 ± 16.3 | 49.4 ± 16.8 | 52.8 ± 17.9 | 52.1 ± 15.7 |
Total cholesterol, mg/dL | 229.2 ± 48.9 | 214.3 ± 41.2 | 209.7 ± 39.2 | 208.1 ± 38.0 | 199.5 ± 35.2 |
Prevalent CVDe, % | 8.5 | 8.1 | 8.8 | 11.0 | 9.8 |
Thyroid medication usef, % | 40.9 | 28.6 | 2.8 | 27.5 | 71.4 |
TSH, mIU/L | 26.3 ± 32.7 | 8.0 ± 4.4 | 2.0 ± 1.0 | 0.3 ± 0.2 | 0.1 ± 0.2 |
FT4, ng/dL | 0.7 ± 0.2 | 1.0 ± 0.1 | 1.1 ± 0.1 | 1.2 ± 0.1 | 1.8 ± 0.6 |
Anti-TPO positive (> 34 IU/L), % | 79.4 | 51.1 | 9.3 | 13.8 | 27.4 |
Anti-TPO negative ≤ 34 IU/L (number of total = 10,821; number of events = 1,932) | Anti-TPO positive > 34 IU/L (number of total = 1,660; number of events = 303) | |
---|---|---|
Model 1: age, sex, race-center, APOE ε4, income and education. Model 2: model 1 + BMI, smoking status, hypertension, diabetes, drinking status, HDL cholesterol and total cholesterol. Model 3: model 2 + prevalent CVD and baseline thyroid medication use. HR: hazard ratio; CI: confidence interval; TPO: thyroid peroxidase; ARIC: Atherosclerosis Risk in Communities; BMI: body mass index; HDL: high-density lipoprotein; CVD: cardiovascular disease. | ||
Model 1 HR | 1 (Ref) | 0.92 (0.82 - 1.04) |
Model 2 HR | 1 (Ref) | 0.93 (0.82 - 1.05) |
Model 3 HR | 1 (Ref) | 0.90 (0.80 - 1.03) |
Hypothyroidism | Euthyroidism | Hyperthyroidism | |||
---|---|---|---|---|---|
Overt | Subclinical | Subclinical | Overt | ||
TSH > 5.1 mIU/L; FT4 < 0.85 ng/dL (number of total = 281; number of events = 60) | TSH > 5.1 mIU/L; FT4 = 0.85 - 1.4 ng/dL (number of total = 581; number of events = 98) | TSH = 0.56 - 5.1 mIU/L; FT4 = 0.85 - 1.4 ng/dL (number of total = 10,956; number of events = 1,952) | TSH < 0.56 mIU/L; FT4 = 0.85 - 1.4 ng/dL (number of total = 429; number of events = 74) | TSH < 0.56 mIU/L; FT4 > 1.4 ng/dL (number of total = 234; number of events = 51) | |
*P-value < 0.05. Model 1: age, sex, race-center, APOE ε4, income and education. Model 2: model 1 + BMI, smoking status, hypertension, diabetes, drinking status, HDL cholesterol and total cholesterol. Model 3: model 2 + prevalent CVD and baseline thyroid medication use. HR: hazard ratio; CI: confidence interval; ARIC: Atherosclerosis Risk in Communities; BMI: body mass index; HDL: high-density lipoprotein; CVD: cardiovascular disease. | |||||
Model 1 HR | 1.03 (0.80 - 1.33) | 0.78* (0.64 - 0.96) | 1 (Ref) | 1.07 (0.85 -1.35) | 1.51* (1.14 - 1.99) |
Model 2 HR | 1.01 (0.78 - 1.31) | 0.76* (0.61 - 0.93) | 1 (Ref) | 1.03 (0.81 - 1.31) | 1.49* (1.12 - 1.98) |
Model 3 HR | 0.96 (0.73 - 1.26) | 0.74* (0.60 - 0.92) | 1 (Ref) | 1.01 (0.79 - 1.29) | 1.40* (1.02 - 1.92) |
TSH | Lowest 5%, ≤ 0.54 mIU/L (number of total = 626; number of events = 116) | Middle 90%, 0.55 - 5.97 mIU/L (number of total = 11,226; number of events = 1,998) | Highest 5%, ≥ 5.98 mIU/L (number of total = 629; number of events = 121) | TSH per 6.35 mIU/L (number of total = 12,481; number of events = 2,235) |
---|---|---|---|---|
*P-value < 0.05. Model 1: age, sex, race-center, APOE ε4, income, education and TSH or FT4. Model 2: model 1 + BMI, smoking status, hypertension, diabetes, drinking status, HDL cholesterol and total cholesterol. Model 3: model 2 + prevalent CVD and baseline thyroid medication use. HR: hazard ratio; CI: confidence interval; ARIC: Atherosclerosis Risk in Communities; TSH: thyroid-stimulating hormone; FT4: free thyroxine; BMI: body mass index; HDL: high-density lipoprotein; CVD: cardiovascular disease. | ||||
Model 1 HR | 1.24* (1.03 - 1.50) | 1 (Ref) | 0.93 (0.77 - 1.12) | 1.03 (0.98 - 1.07) |
Model 2 HR | 1.13 (0.92 - 1.39) | 1 (Ref) | 0.94 (0.77 - 1.14) | 1.03 (0.98 - 1.07) |
Model 3 HR | 1.09 (0.87 - 1.36) | 1 (Ref) | 0.90 (0.73 - 1.11) | 1.02 (0.97 - 1.07) |
FT4 | Lowest 5%, ≤ 0.89 ng/dL (number of total = 628; number of events = 123) | Middle 90%, 0.90 - 1.35 ng/dL (number of total = 11,170; number of events = 1,981) | Highest 5%, ≥ 1.36 ng/dL (number of total = 683; number of events = 131) | FT4 per SD (0.19 ng/dL) (number of total = 12,481; number of events = 2,235) |
Model 1 HR | 0.96 (0.79 - 1.18) | 1 (Ref) | 1.30* (1.08 - 1.55) | 1.06* (1.02 - 1.09) |
Model 2 HR | 0.96 (0.78 - 1.17) | 1 (Ref) | 1.26* (1.05 - 1.51) | 1.05* (1.01 - 1.09) |
Model 3 HR | 0.95 (0.77 - 1.16) | 1 (Ref) | 1.23* (1.02 - 1.48) | 1.05* (1.01 - 1.09) |