Journal of Endocrinology and Metabolism, ISSN 1923-2861 print, 1923-287X online, Open Access
Article copyright, the authors; Journal compilation copyright, J Endocrinol Metab and Elmer Press Inc
Journal website http://www.jofem.org

Original Article

Volume 2, Number 1, February 2012, pages 1-10


Apparent Sex-Specific Divergence of Acylation Stimulating Protein Levels With Respect to Metabolic Parameters of Pathogenetic and Clinical Relevance

Figure

Figure 1.
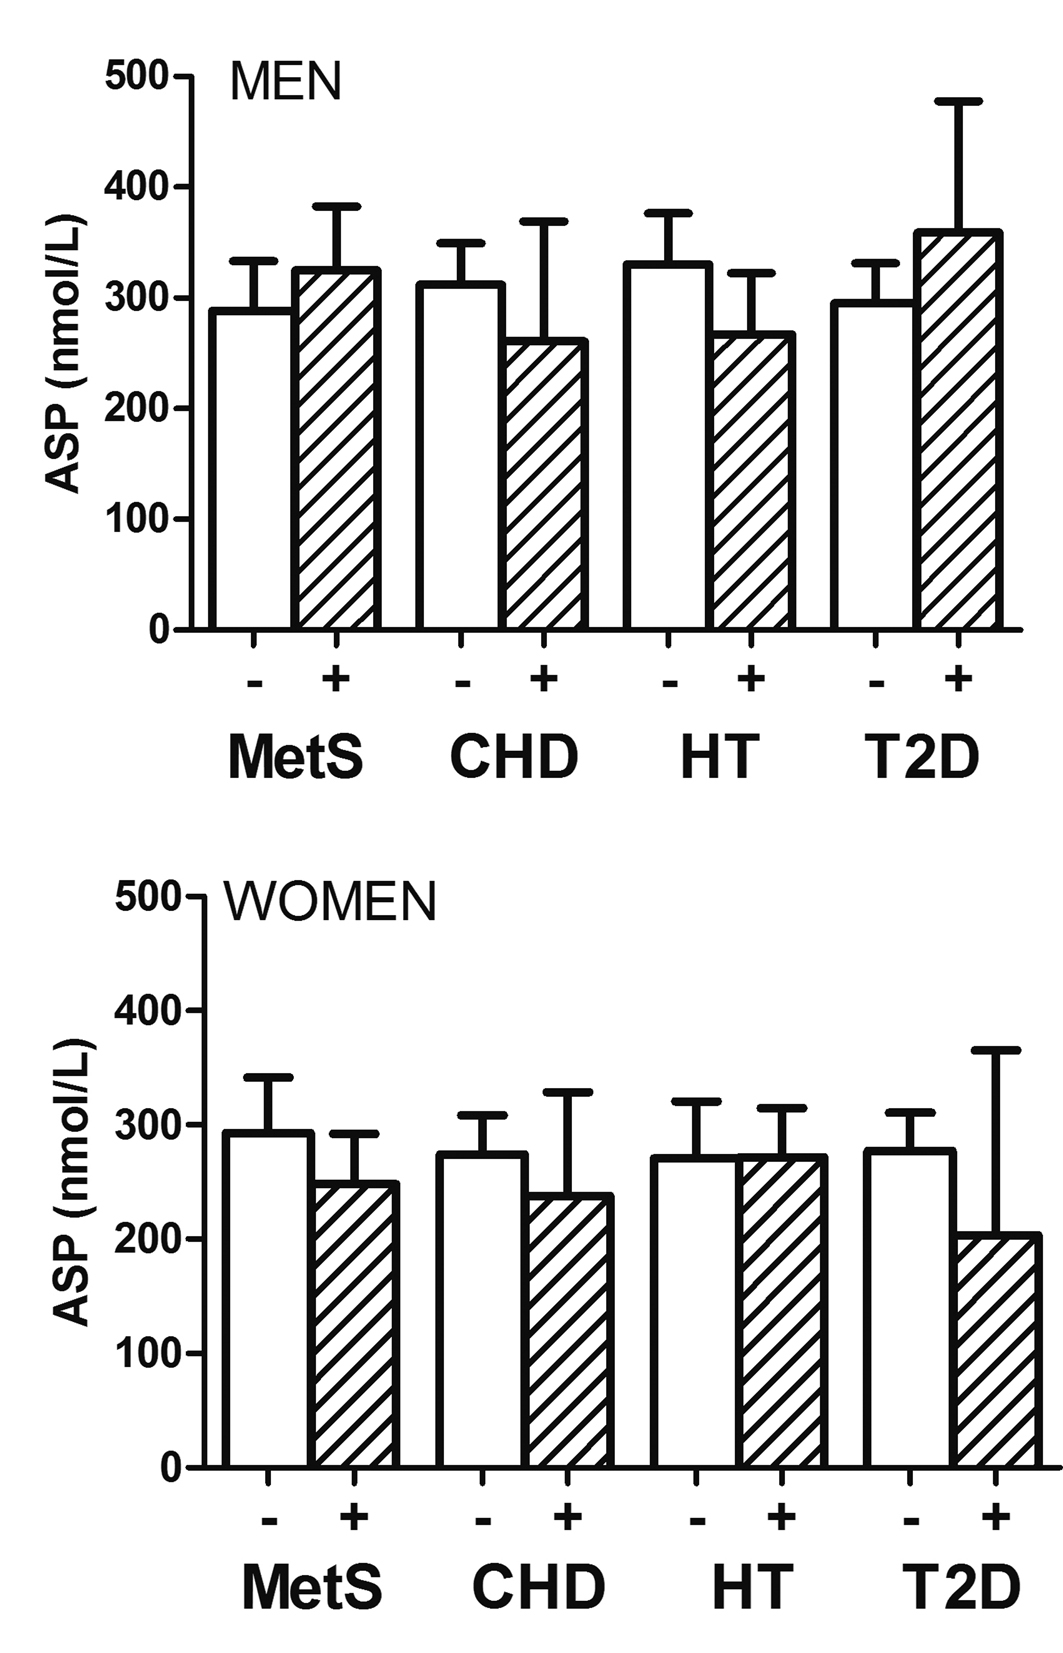
Figure 1. Geometric mean of plasma ASP concentrations in women (lower panel) and men (upper panel) without and with CHD, metabolic syndrome (MetS), Type-2 diabetes (T2D) and hypertension (HT). Levels were non-significantly higher in men with MetS and Type-2 diabetes than without. Otherwise, including overall in women, ASP concentrations were non-significantly lower in the presence of cardiometabolic disorders. Analysis used log-transformed ASP values.

Tables

Table 1. Characteristics of the Study Population According to Sex
 
UnitWomen n = 94Men n = 130P-value
MeanSDMeanSD
Ageyear52.212.951.011.1NS
Waistcm95.315.597.810.4NS
Heightcm156.26.6168.56.7< 0.001
BMIkg/m229.95.228.13.9< 0.01
Systolic BPmmHg127.022.5125.421.5NS
Diastolic BPmmHg76.410.576.510.6NS
Total Cmg/dl200.642.6188.843.0< 0.05
HDL Cmg/dl51.111.841.410.8< 0.001
LDL Cmg/dl120.735.3114.836.8NS
TGmg/dl148.076.6181.9119.4< 0.01
Glucosemg/dl97.222.0106.941.5< 0.05
Creatininemg/l0.750.150.930.16< 0.001
ApoAImg/dl145.023.2128.822.6< 0.001
ApoBmg/dl103.034.0100.131.9NS
Insulin¶µIU/ml8.972.097.761.89NS
CRPmg/l3.13.33.95.4NS
Fibrinogenmg/dl3.20.83.11.0NS
SHBGnmol/l61.137.742.524.5< 0.001
Testosteronenmol/l0.560.7410.09.1< 0.05
ASP *nmol/l271(242 - 303)305(274 - 339)0.059
Metabolic disordersN/%N/%Fisher
¶log-transformed values. Mean and SD are provided for men and women (*for ASP, geometric mean and 95th confidence limits are provided), where Apo apolipoprotein, BP blood pressure, C cholesterol, CHD coronary heart disease, CRP C-reactive protein, HT hypertension, MetS metabolic syndrome, T2D type 2 diabetes, TG triglyceride, SHBG sex hormone binding globulin.
CHD7/7.4%
44/47%
16/12.3%
61/47%
NS
MetSNS
T2D7/7.4%
45/48%
22/17%
49/38%
0.044
HTNS


Table 2. Spearman Correlation Coefficients of ASP With Certain Variables According to Metabolic Disorders
 
ALL subjects (n = 224)
RP valueRP value
Height0.170.01
SHBG-0.100.08
Healthy (88)Non-healthy (136)
SHBG0.040.77-0.300.002
Height0.170.120.160.07
Non-MetS (119)With MetS (105)
Glucose-0.170.080.130.22
Height0.100.290.150.03
HDL-C-0.090.31-0.200.03
SHBG-0.020.86(78)-0.310.01
Without HT (130)With HT (94)
Spearman Correlation (R values) and significance level (P values) are provided according to metabolic disorder where CRP C reactive protein, HT hypertension, MetS metabolic syndrome, SHBG sex hormone binding globulin. Values with P < 0.1 are underlined.
Height0.190.030.070.47
HDL-C-0.160.07-0.060.56
LDL-C-0.180.040.130.21
SHBG-0.030.77-0.330.005
CRP0.050.52(86)0.210.04
FIBRINOGEN-0.040.68(127)0.250.04
CREATININE0.130.17(96)-0.210.05
AGE0.060.47(117)-0.190.06


Table 3. Spearman Correlation Coefficients of ASP With Certain Variables According to Gender
 
AllMen (130)Women (94)
RP valueRP value
Age-0.190.030.080.47
Glucose0.190.03-0.230.03
Triglyceride0.190.03-0.180.09
CRP0.160.070.040.73(91)
SHBG-0.190.07-0.010.95(68)
Testosterone0.050.63-0.260.04
Height0.260.003-0.030.79
Healthy(51)(37)
LDL-C-0.000.96-0.360.03
Creatinine0.260.07-0.120.49(33)
Non-healthy(79)(57)
Age-0.290.010.130.35
Height0.270.01-0.170.20
BMI0.220.040.130.33
Triglyceride0.240.04-0.150.26(55)
HDL-C-0.030.020.160.22
SHBG-0.320.01-0.190.23(41)
Glucose0.210.06-0.270.05
With MetS(61)(44)
Glucose0.310.02-0.210.17(42)
Fibrinogen0.280.060.040.83(28)
SHGB-0.280.06-0.20.26(33)
CRP0.230.070.030.86(43)
Height0.230.07-0.210.18
Without MetS(69)(50)
Spearman Correlation (R values) and significance level (P values) are provided according to metabolic disorder where BMI body mass index, BP blood pressure, C cholesterol, CRP C reactive protein, HT hypertension, MetS metabolic syndrome, SHBG sex hormone binding globulin, WC waist circumference. Values with P < 0.1 are underlined.
Height0.270.02-0.060.70
Age-0.210.080.160.28
WC-0.100.390.310.03
Diastolic BP-0.120.330.330.02
Systolic BP-0.090.490.260.07
Total C0.070.56-0.240.09