Journal of Endocrinology and Metabolism, ISSN 1923-2861 print, 1923-287X online, Open Access
Article copyright, the authors; Journal compilation copyright, J Endocrinol Metab and Elmer Press Inc
Journal website http://www.jofem.org

Original Article

Volume 9, Number 6, December 2019, pages 186-192


Increased Ratio of Total Testosterone to Dihydrotestosterone May Predict an Adverse Metabolic Outcome in Polycystic Ovary Syndrome

Figures

Figure 1.
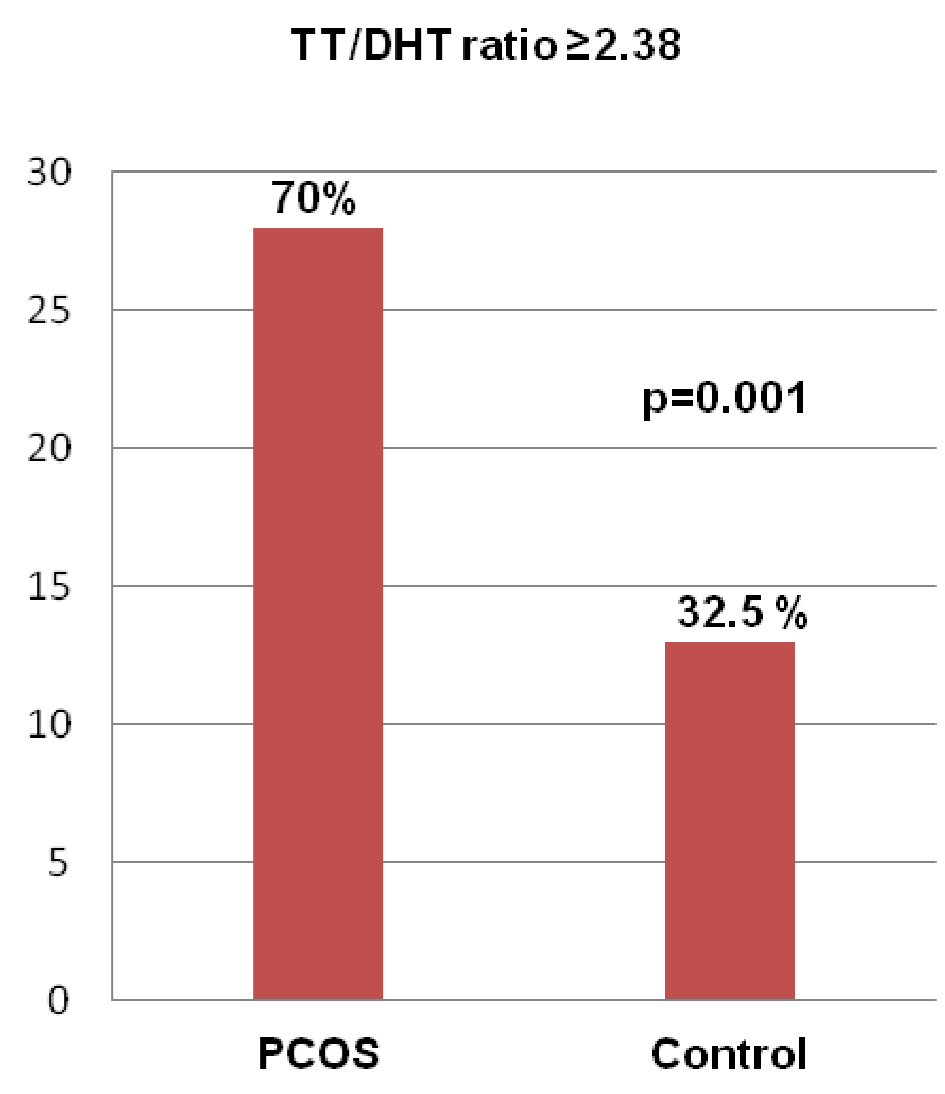
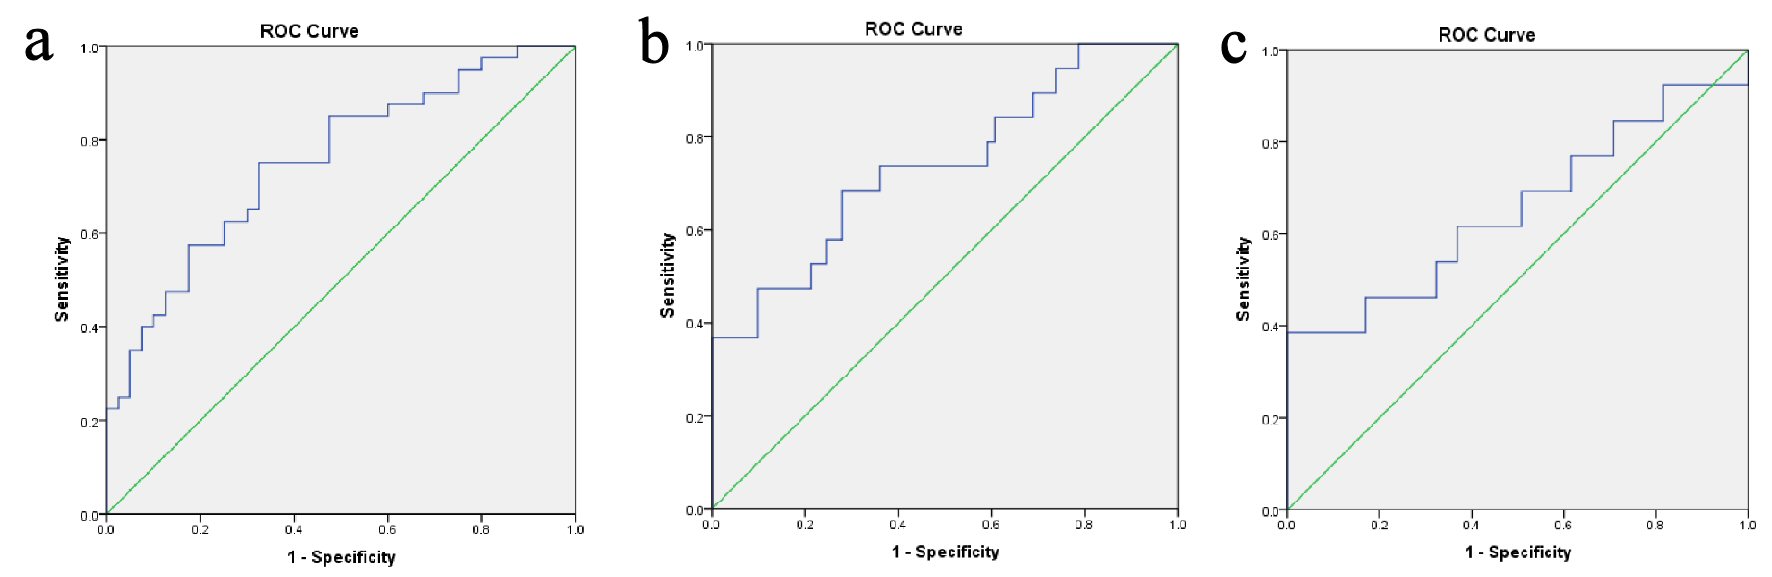
Figure 1. (a) ROC curves analyses revealed the best cutoff value of TT/DHT ratio of 2.38 for the diagnosis of PCOS (sensitivity: 70%, specificity: 32.5%, and AUC: 0.753). In PCOS patients, ROC curves analyses were conducted for best cutoff values of TT/DHT ratio for the diagnosis of (b) metabolic syndrome (2.53, sensitivity: 73.7%, specificity: 39.3%, and AUC: 0.738) and (c) impaired glucose tolerance (2.78, sensitivity: 61.5%, specificity: 38.5%, and AUC: 0.653). PCOS: polycystic ovary syndrome; AUC: area under the curve; ROC: receiver operating characteristics; TT/DHT: total testosterone/dihydrotestosterone ratio.
Figure 2.
Figure 2. Frequency of a raised TT/DHT ratio (≥ 2.38) in the PCOS and control groups. (Data were expressed as frequency and percentage; comparison between PCOS and control groups was done by Chi-square test. PCOS: polycystic ovary syndrome; TT/DHT ratio: total testosterone/dihydrotestosterone ratio.

Tables

Table 1. Clinical and Metabolic Characteristics of Studied Subjects
 
ParametersPCOS (n = 40)Control (n = 40)P value
Data were expressed as frequency, percentage, and mean ± SD. Comparison between PCOS and control was done by Student’s t-test and Chi-square test. PCOS: polycystic ovary syndrome; PCO: polycystic ovaries; HOMA-IR: homeostatic model assessment of insulin resistance; SD: standard deviation.
Age (years)23.18 ± 4.6623.00 ± 4.320.862
Body mass index (kg/m2)26.14 ± 4.1620.84 ± 3.48< 0.001
Waist circumference (cm)84.05 ± 10.8571.15 ± 5.82< 0.001
Hip circumference (cm)100.98 ± 10.1788.38 ± 7.40< 0.001
Waist/hip ratio0.83 ± 0.060.80 ± 0.040.046
Systolic blood pressure (mm Hg)111.5 ± 14.24104.50 ± 10.850.055
Diastolic blood pressure (mm Hg)72.50 ± 10.5669.38 ± 9.350.097
Menstrual disturbance36 (90%)0-
Hirsutism22 (55%)0-
Acanthosis nigricans23 (57.5%)0-
PCO in ultrasonogram31 (77.5%)0-
Fasting insulin (µU/mL)23.01 ± 21.578.54 ± 3.80< 0.001
Fasting plasma glucose (mmol/L)4.50 ± 0.673.67 ± 0.40< 0.001
2-h post 75-g glucose (mmol/L)7.40 ± 1.956.10 ± 1.23< 0.001
HOMA-IR4.44 ± 3.701.40 ± 0.70< 0.001
Total cholesterol (mg/dL)165.50 ± 24.34160.78 ± 24.120.386
Triglyceride (mg/dL)134.90 ± 76.3091.88 ± 28.870.002
High-density lipoprotein (mg/dL)37.39 ± 7.2449.65 ± 9.54< 0.001
Low-density lipoprotein (mg/dL)101.38 ± 24.7992.73 ± 18.900.083


Table 2. Hormone Profile of PCOS and Control Groups
 
ParametersPCOS (n = 40)Control (n = 40)P value
Data were expressed as mean ± SD. P values were calculated using Student’s t-test. PCOS: polycystic ovary syndrome; TT: total testosterone; DHT: dihydrotestosterone; TT/DHT: total testosterone/dihydrotestosterone ratio; SHBG: sex hormone binding globulin; FAI: free androgen index; TSH: thyroid stimulating hormone; SD: standard deviation.
TT (ng/mL)0.69 ± 0.260.30 ± 0.13< 0.001
DHT (ng/mL)0.252 ± 0.1800.207 ± 0.1800.261
TT/DHT ratio3.51 ± 1.952.02 ± 1.03< 0.001
SHBG (nmol/L)32.16 ± 21.3347.66 ± 24.700.004
FAI10.93 ± 8.522.93 ± 2.17< 0.001
TSH (µIU/mL)2.55 ± 1.431.67 ± 0.930.002
Prolactin (ng/mL)12.67 ± 11.4015.43 ± 6.190.183


Table 3. Glycemic Status and Insulin Resistance in PCOS and Control Groups
 
ParametersPCOS (n = 40)Control (n = 40)P value
Data were expressed as frequency, percentage. P values were calculated using Chi-square test. PCOS: polycystic ovary syndrome.
Prediabetes13 (32.5)2 (5)0.002
Diabetes mellitus2 (5)0-
Insulin resistance26 (65)3 (7.5)< 0.001
Metabolic syndrome17 (42.5)2 (5)< 0.001


Table 4. Level of TT/DHT Ratio in PCOS and Control Groups With Metabolic Parameters
 
Metabolic parametersTT/DHT ratio
PCOS (n = 40)Control (n = 40)Pa
Data were expressed as mean ± SD, compared using Student’s t-test. P: comparison within PCOS group; Pa: comparison between PCOS vs. control; N/D: not done because this category was not sufficient in control group. PCOS: polycystic ovary syndrome; TT/DHT ratio: testosterone/dihydrotestosterone ratio.
Metabolic syndromeYes (n = 17, 2)4.33 ± 2.543.06 ± 0.41N/D
No2.90 ± 1.061.96 ± 1.03
P0.0410.146
Impaired glucose toleranceYes (n = 13, 2)4.73 ± 2.731.55 ± 1.79N/D
No2.92 ± 1.082.04 ± 1.01
P0.0370.521
Insulin resistanceYes (n = 26, 3)3.74 ± 2.102.10 ± 1.18N/D
No3.07 ± 1.612.00 ± 1.03
P0.3040.876
ObesityYes (n = 28,10)3.71 ± 2.162.10 ± 1.090.032
No3.05 ± 1.321.99 ± 1.03
P0.3390.764


Table 5. Correlations of TT/DHT Ratio With Clinical and Biochemical Parameters in PCOS and Control Groups
 
Determinants of “r”PCOS (n = 40)Control (n = 40)
TT/DHT ratiorPrP
Correlation was done between the two groups by Pearson correlation. PCOS: polycystic ovary syndrome; TT/DHT ratio: total testosterone/dihydrotestosterone ratio, HOMA-IR: homeostatic measurement of assessment of insulin resistance. *P < 0.05.
Weight (kg)0.3230.042*0.0070.966
Body mass index (kg/m2)0.1650.253-0.0020.991
Waist circumference (cm)0.3720.018*0.0130.939
Fasting plasma glucose (mmol/L)0.0720.6600.0560.733
2-h post 75-g glucose (mmol/L)0.4130.008*0.2410.134
Fasting insulin (µIU/L)0.3050.0560.1880.246
HOMA-IR0.3850.014*0.1620.317
Triglyceride (mg/dL)0.4020.010*0.3070.054
High-density lipoprotein (mg/dL)-0.1870.247-0.1240.445