Figures
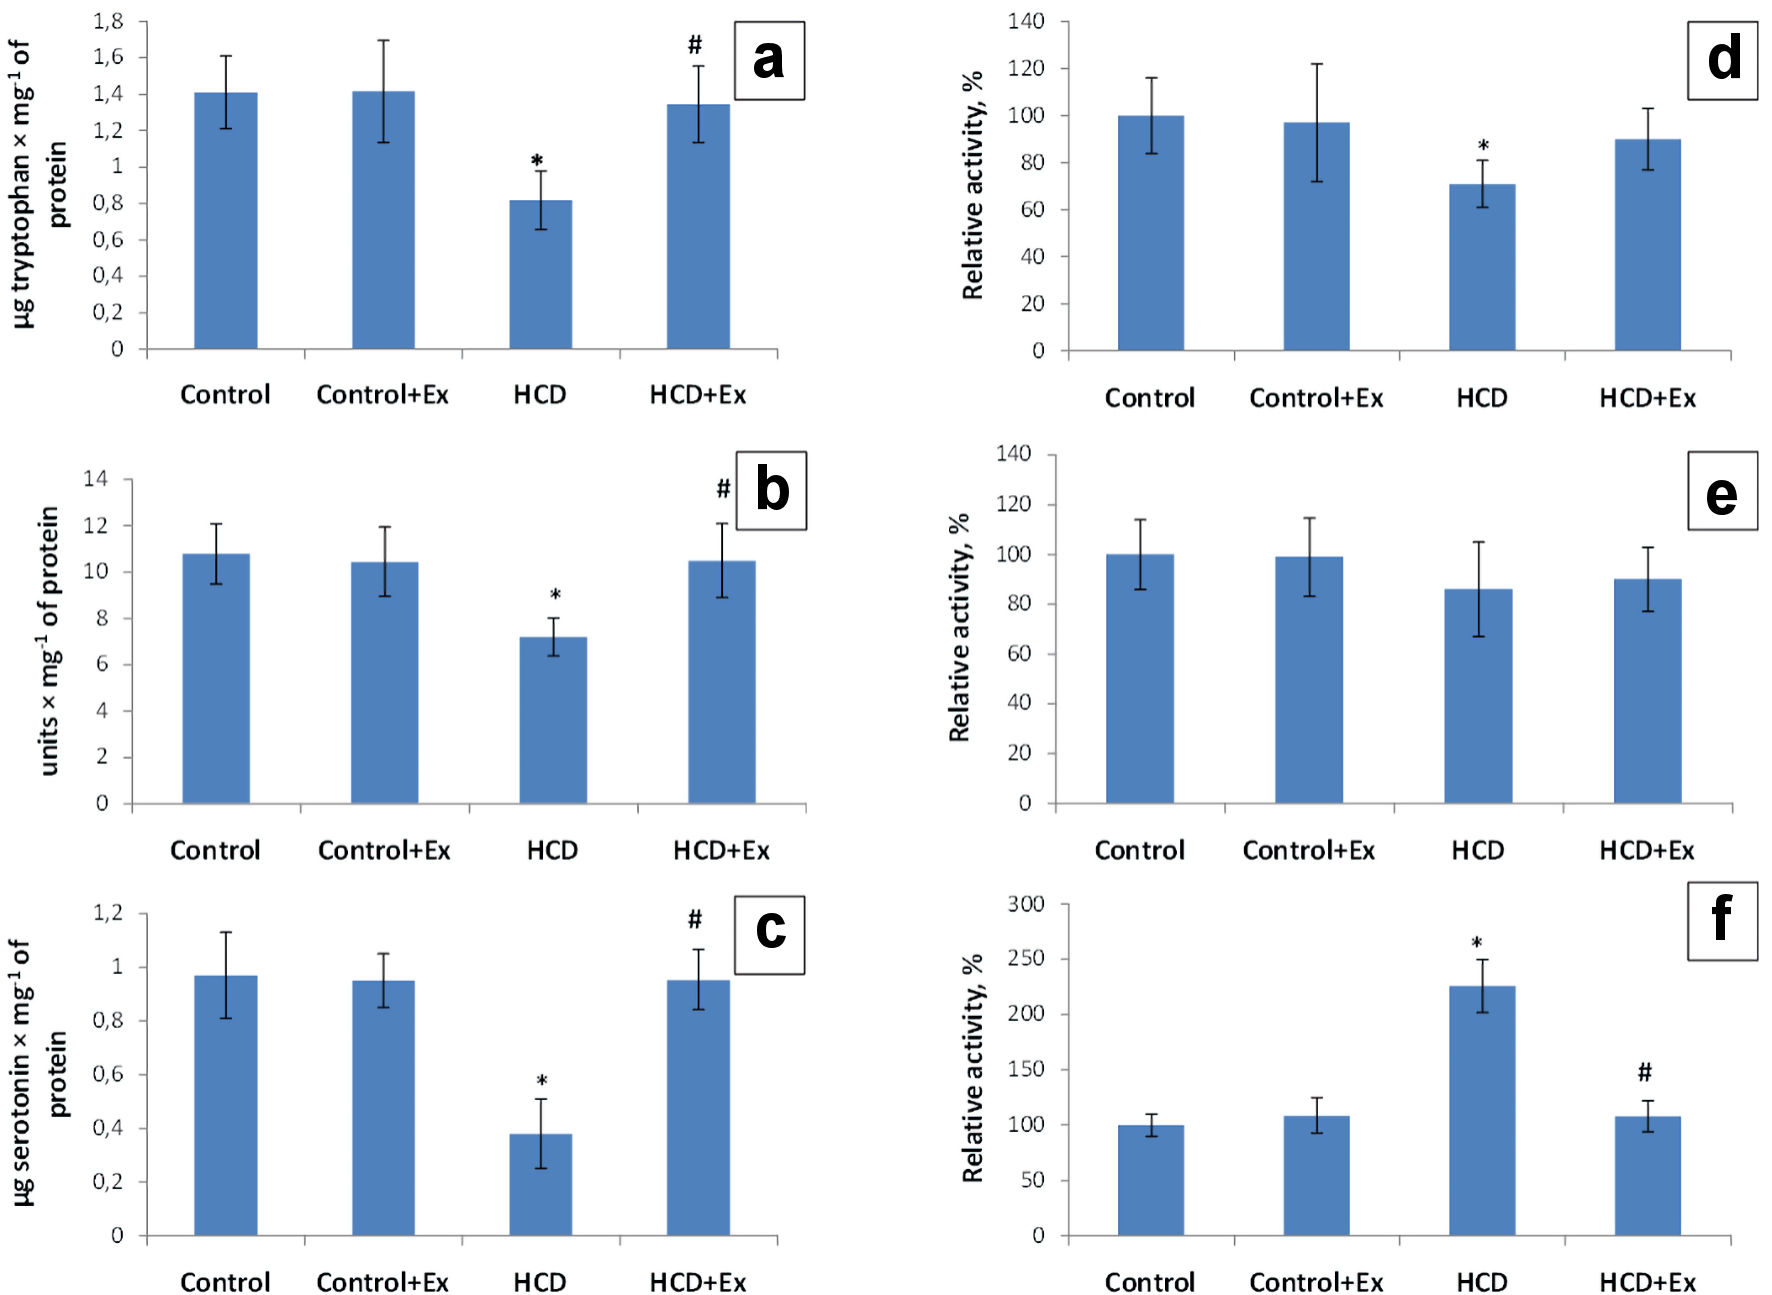
Figure 1. The content of tryptophan (µg/mg of protein) (a), 5-hydroxytryptophan (units/mg of proteins) (b) and serotonin (µg/mg of protein) (c), tryptophan hydroxylase (TPH) activity (d), tryptophan decarboxylase (TPD) activity (e) and monoamine oxidase (MAO) activity (f) in duodenum mucosa in control and HCD-induced obese rats with or without consumption of kidney beans (Phaseolus vulgaris) pods extract (mean ± SEM, n = 10 in each group). *P < 0.05, significant differences compared to the control; #P < 0.05, significant differences compared to the HCD-induced obesity. SEM: standard error of the mean; HCD: high-calorie diet.
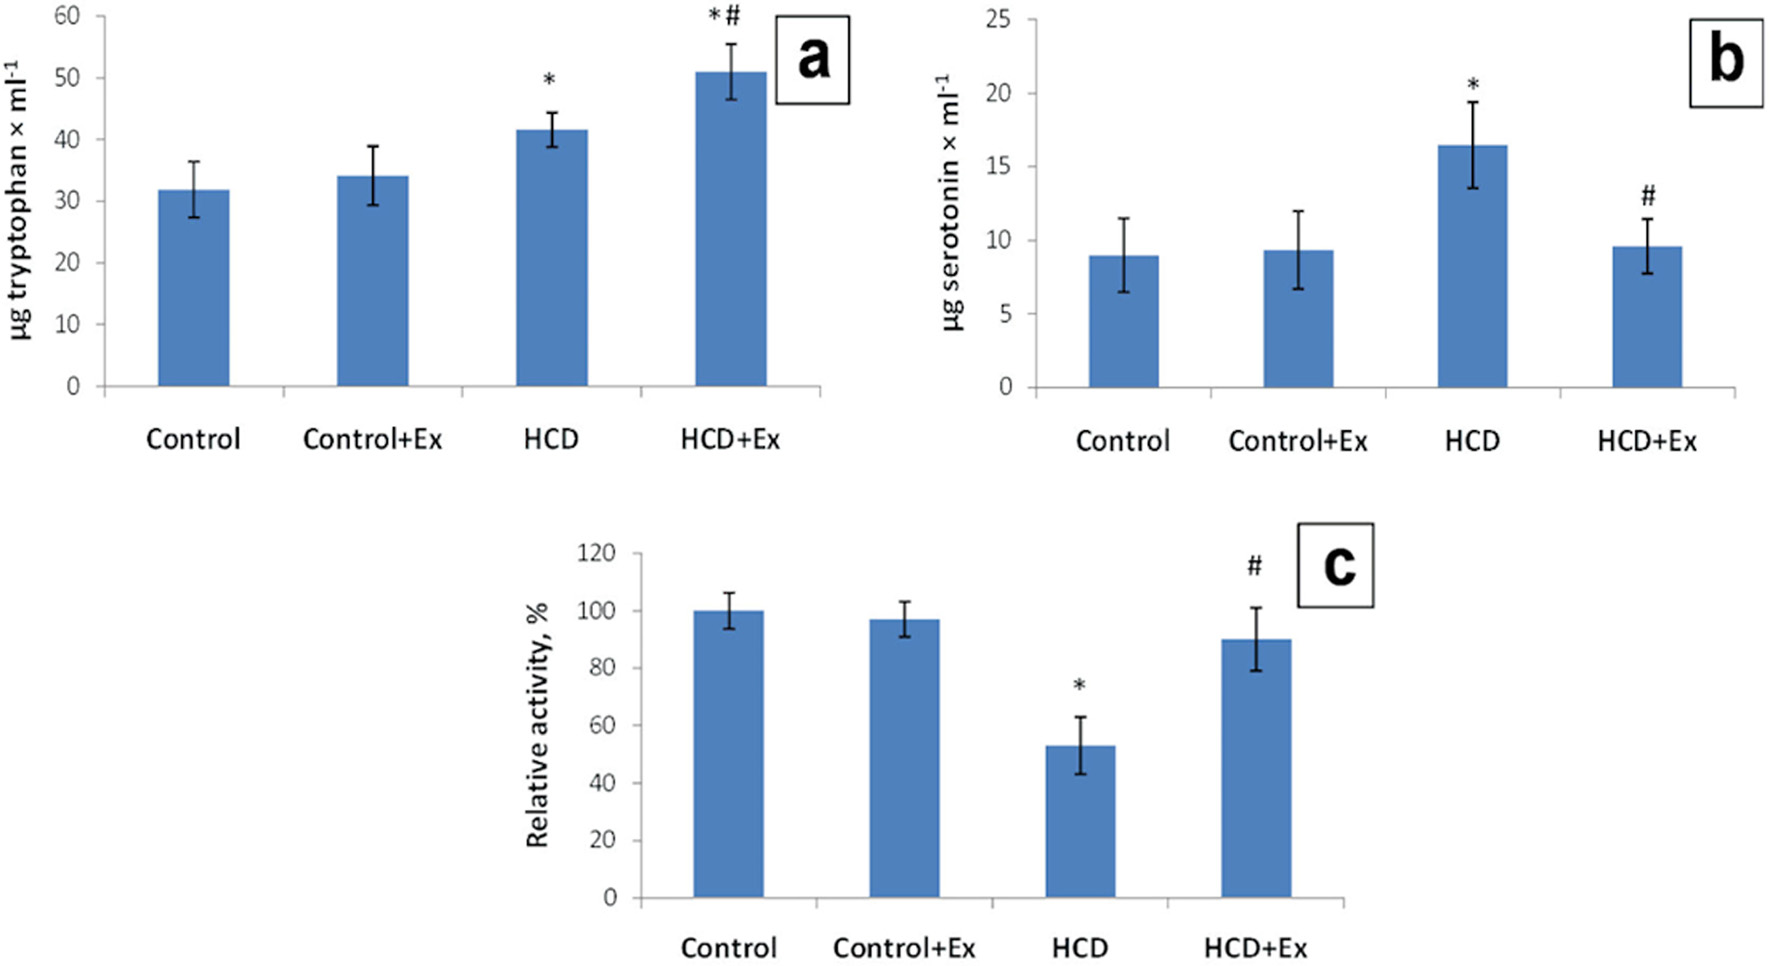
Figure 2. The content of tryptophan (µg/mL) (a), serotonin (µg/mL) (b), and monoamine oxidase (MAO) activity (c) in blood serum in control and HCD-induced obese rats with or without consumption of kidney beans (Phaseolus vulgaris) pods extract (mean ± SEM, n = 10 in each group). *P < 0.05, significant differences compared to the control; #P < 0.05, significant differences compared to the HCD-induced obesity. SEM: standard error of the mean; HCD: high-calorie diet.
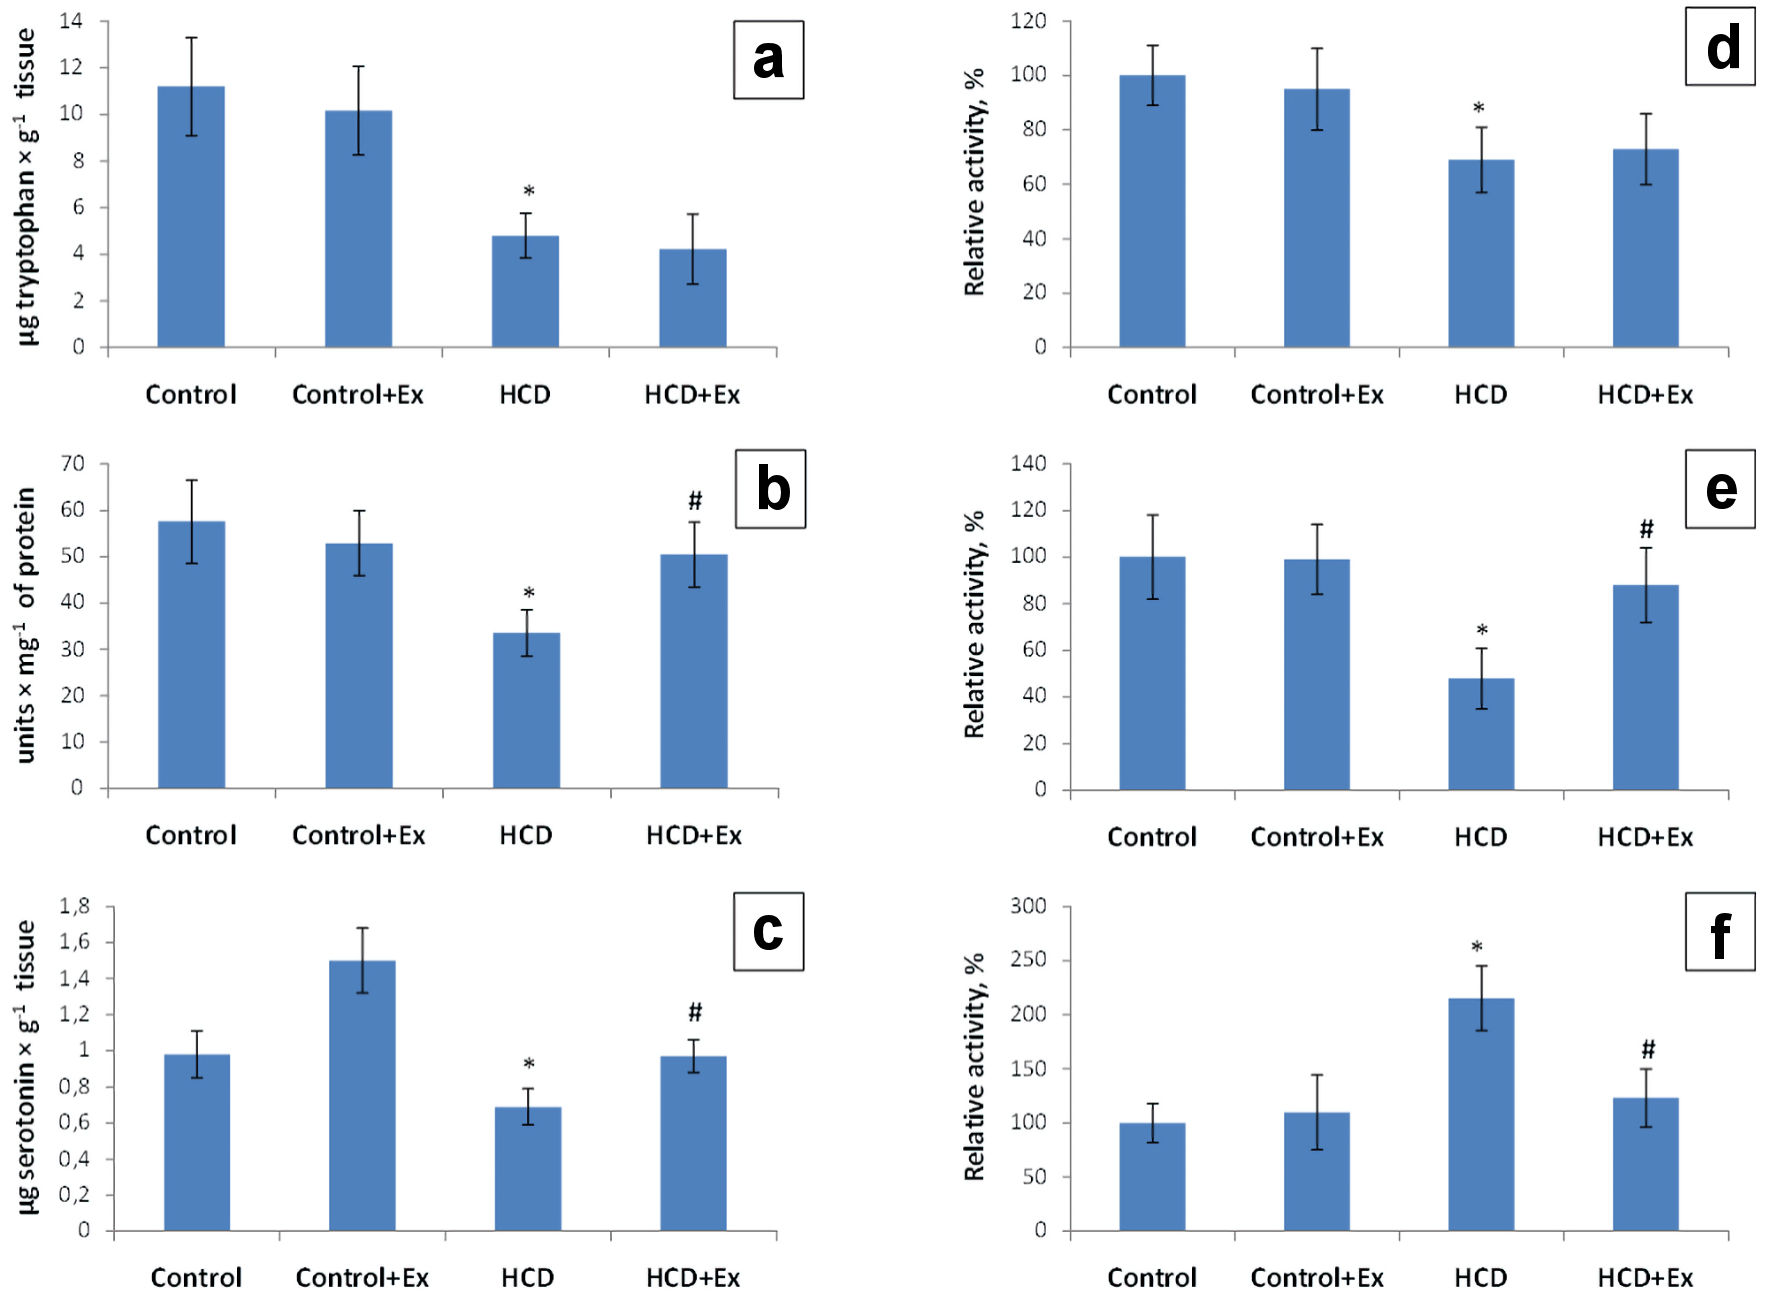
Figure 3. The content of tryptophan (µg/g tissue) (a), 5-hydroxytryptophan (units/mg of proteins) (b) and serotonin (µg/g tissue) (c); tryptophan hydroxylase (TPH) activity (d), tryptophan decarboxylase (TPD) activity (e) and monoamine oxidase (MAO) activity (f) in brain tissue in control and HCD-induced obese rats with or without consumption of kidney beans (Phaseolus vulgaris) pods extract (mean ± SEM, n = 10 in each group). *P < 0.05, significant differences compared to the control; #P < 0.05, significant differences compared to the HCD-induced obesity. SEM: standard error of the mean; HCD: high-calorie diet.
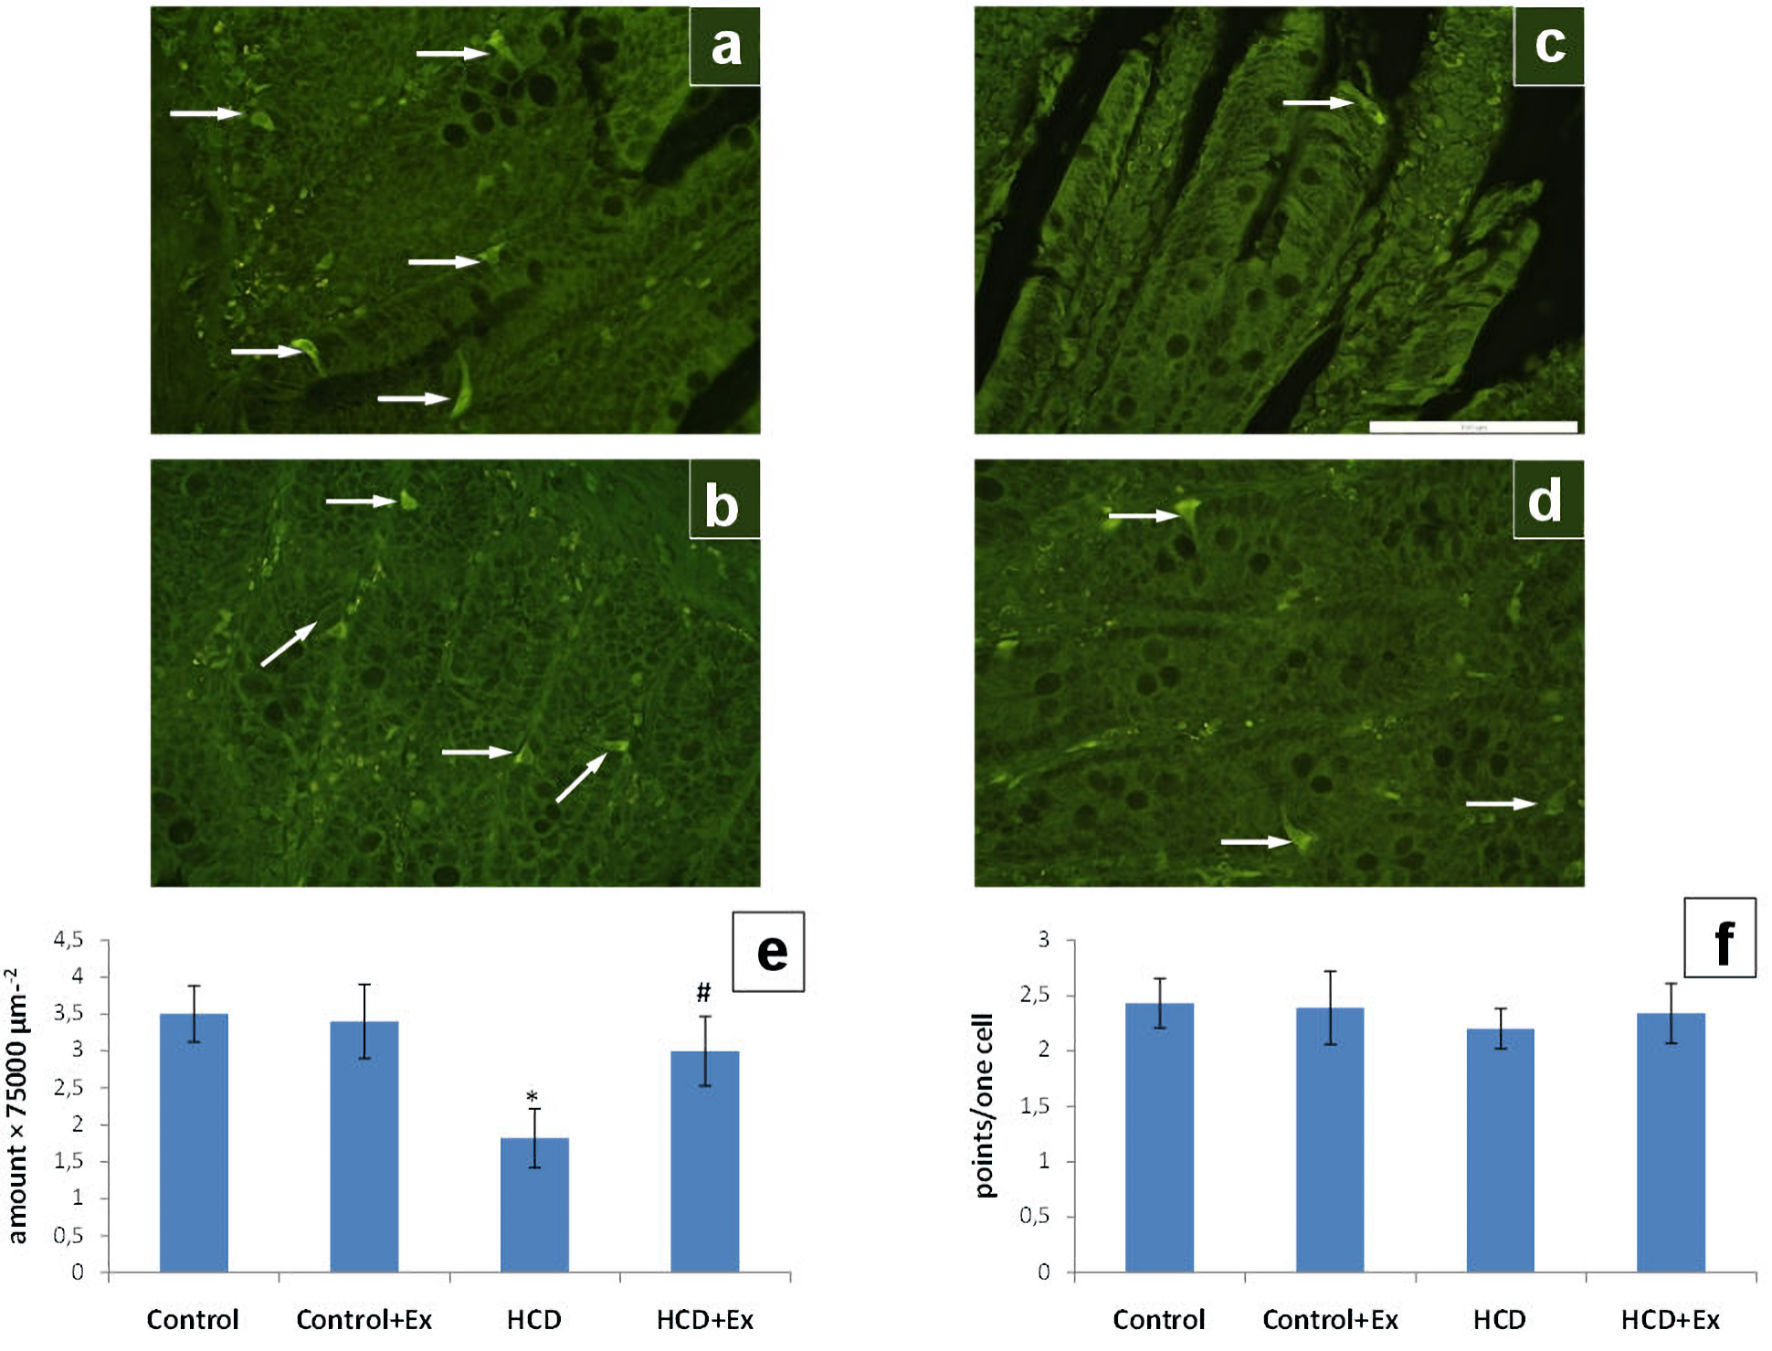
Figure 4. The photomicrographs of the duodenum slices of control (a), control + Ex (b), HCD (c) and HCD + Ex (d) groups (formaldehyde-induced fluorescence, Falck-Hillarp technique, fixation in FAGLU). Enterochromaffin cells are indicated by arrows (scale bar: 100 µm). Results of morphometric analysis of the state of the enterochromaffin cells amount in duodenum (e) and the enterochromaffin cells serotonin content in duodenum (f) (mean ± SEM, n = 10 in each group). *P < 0.05, significant differences compared to the control; #P < 0.05, significant differences compared to the HCD-induced obesity. SEM: standard error of the mean; HCD: high-calorie diet.
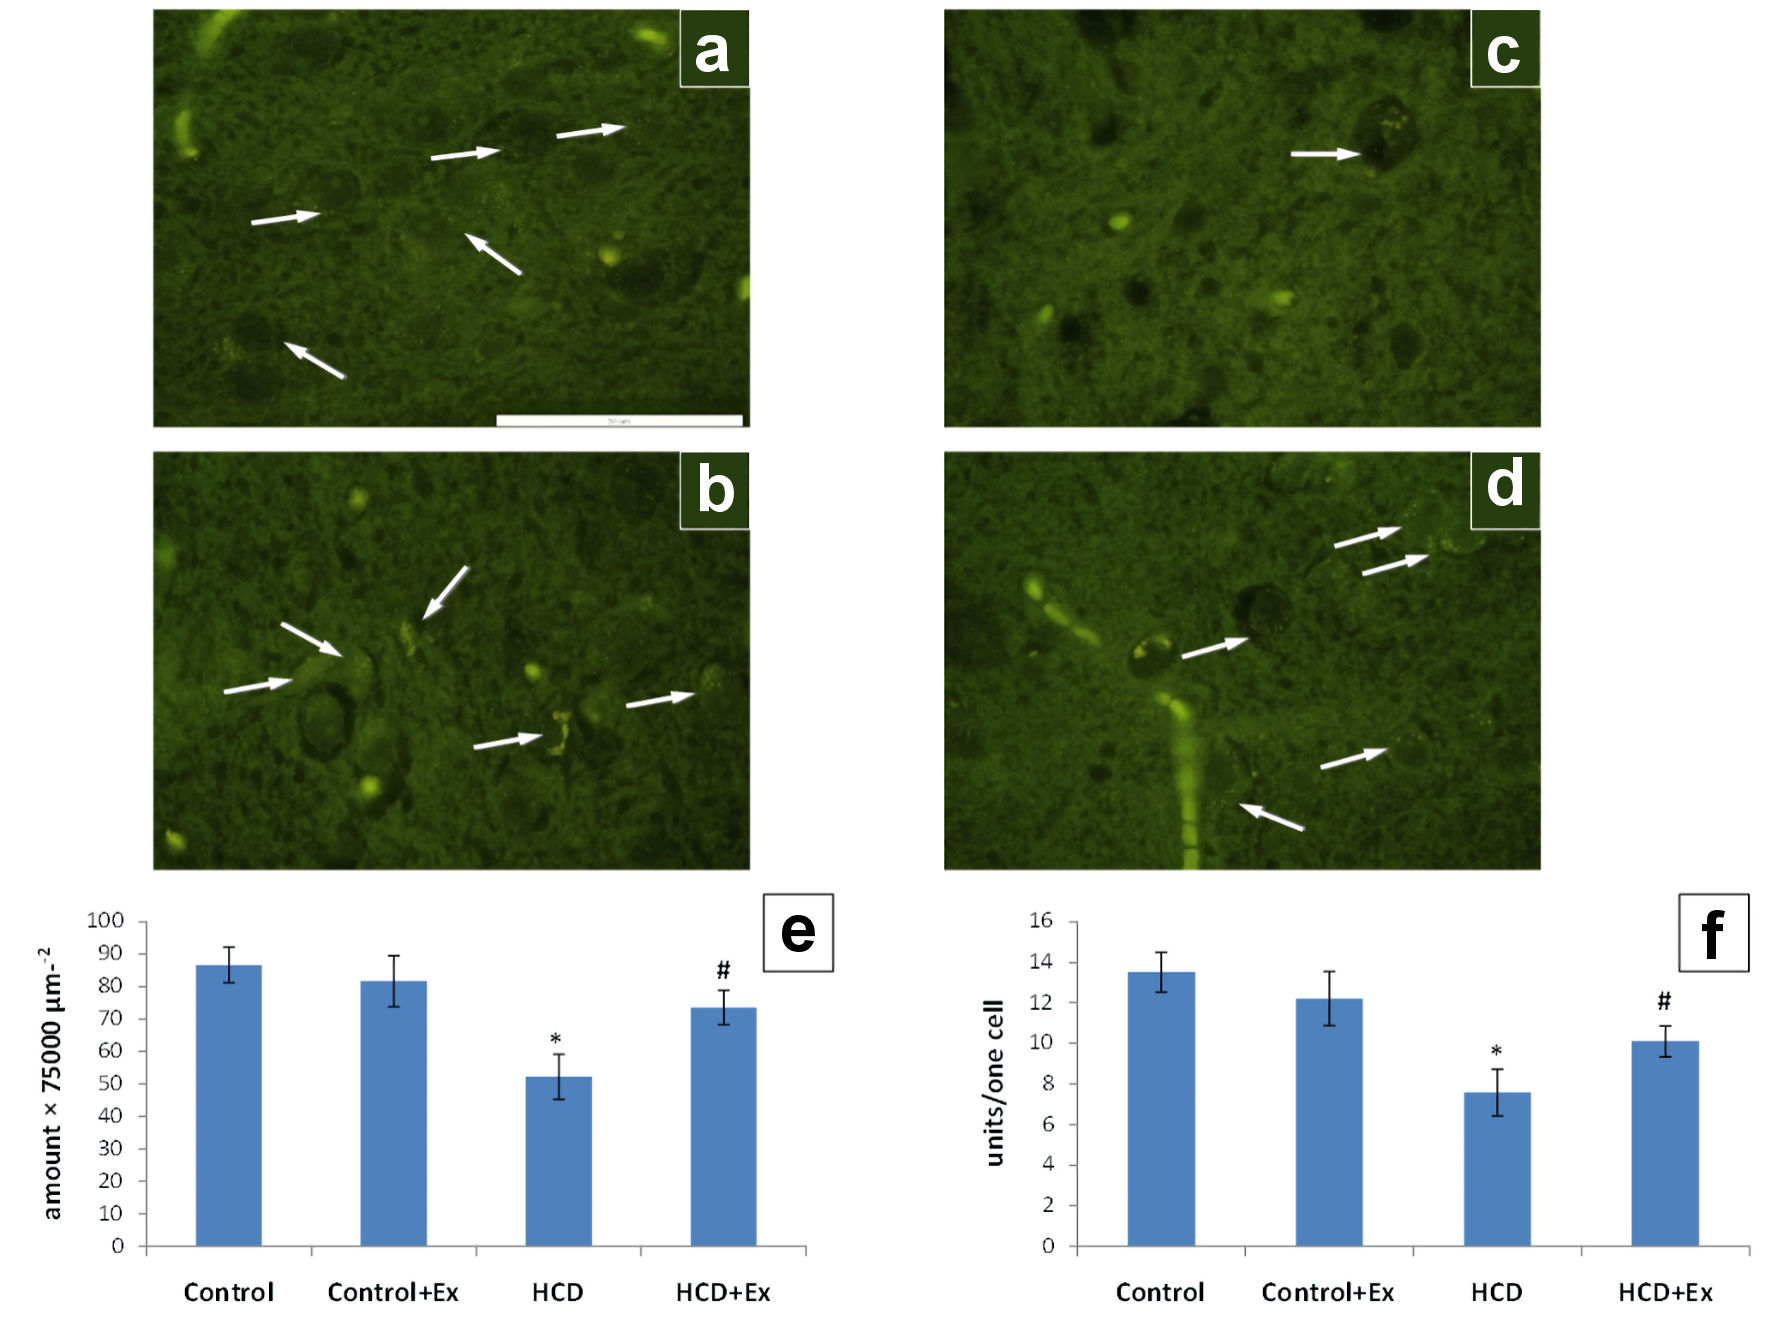
Figure 5. The photomicrographs of the hypothalamic arcuate nucleus slices of control (a), control + Ex (b), HCD (c) and HCD + Ex (d) groups (formaldehyde-induced fluorescence, Falck-Hillarp technique, fixation in FAGLU). Serotonin-positive neurons are indicated by arrows (scale bar: 50 µm). Results of morphometric analysis of the state of the serotonergic neurons in the hypothalamic arcuate nucleus: density of serotonin-positive neurons (e); the number of serotonin-positive vesicles per one neuron of the nucleus (f) (mean ± SEM, n = 10 in each group). *P < 0.05, significant differences compared to the control; #P < 0.05, significant differences compared to the HCD-induced obesity. SEM: standard error of the mean; HCD: high-calorie diet.
Table
Table 1. The Organometric Parameters of Control and HCD-Induced Obese Rats With or Without Consumption of Kidney Beans (Phaseolus vulgaris) Pods Extract (Ex)
| Control | Control + Ex | HCD | HCD + Ex |
|---|
| aP < 0.05, significant differences compared to the control. bP < 0.05, significant differences compared to HCD-induced obesity. BMI: body mass index; HCD: high-calorie diet. |
| Body weight (g) | 296.00 ± 14.31 | 302.00 ± 22.55 | 404.00 ± 22.10a | 336.00 ± 19.10a, b |
| Body length (cm) | 24.00 ± 0.92 | 24.90 ± 0.75 | 24.70 ± 0.68 | 24.60 ± 0.51 |
| BMI (g/cm2) | 0.54 ± 0.01 | 0.58 ± 0.01 | 0.74 ± 0.02a | 0.56 ± 0.02b |
| Index Lee | 2.31 ± 0.04 | 2.29 ± 0.06 | 2.54 ± 0.04a | 2.39 ± 0.07b |
| Visceral adipose tissue (g/100 g body weight) | 0.58 ± 0.19 | 0.81 ± 0.21 | 2.38 ± 0.29a | 1.59 ± 0.25a, b |
| Subcutaneous adipose tissue (g/100 g body weight) | 0.53. ± 0.08 | 0.52 ± 0.13b | 0.80 ± 0.10a | 0.49 ± 0.09b |