Figures
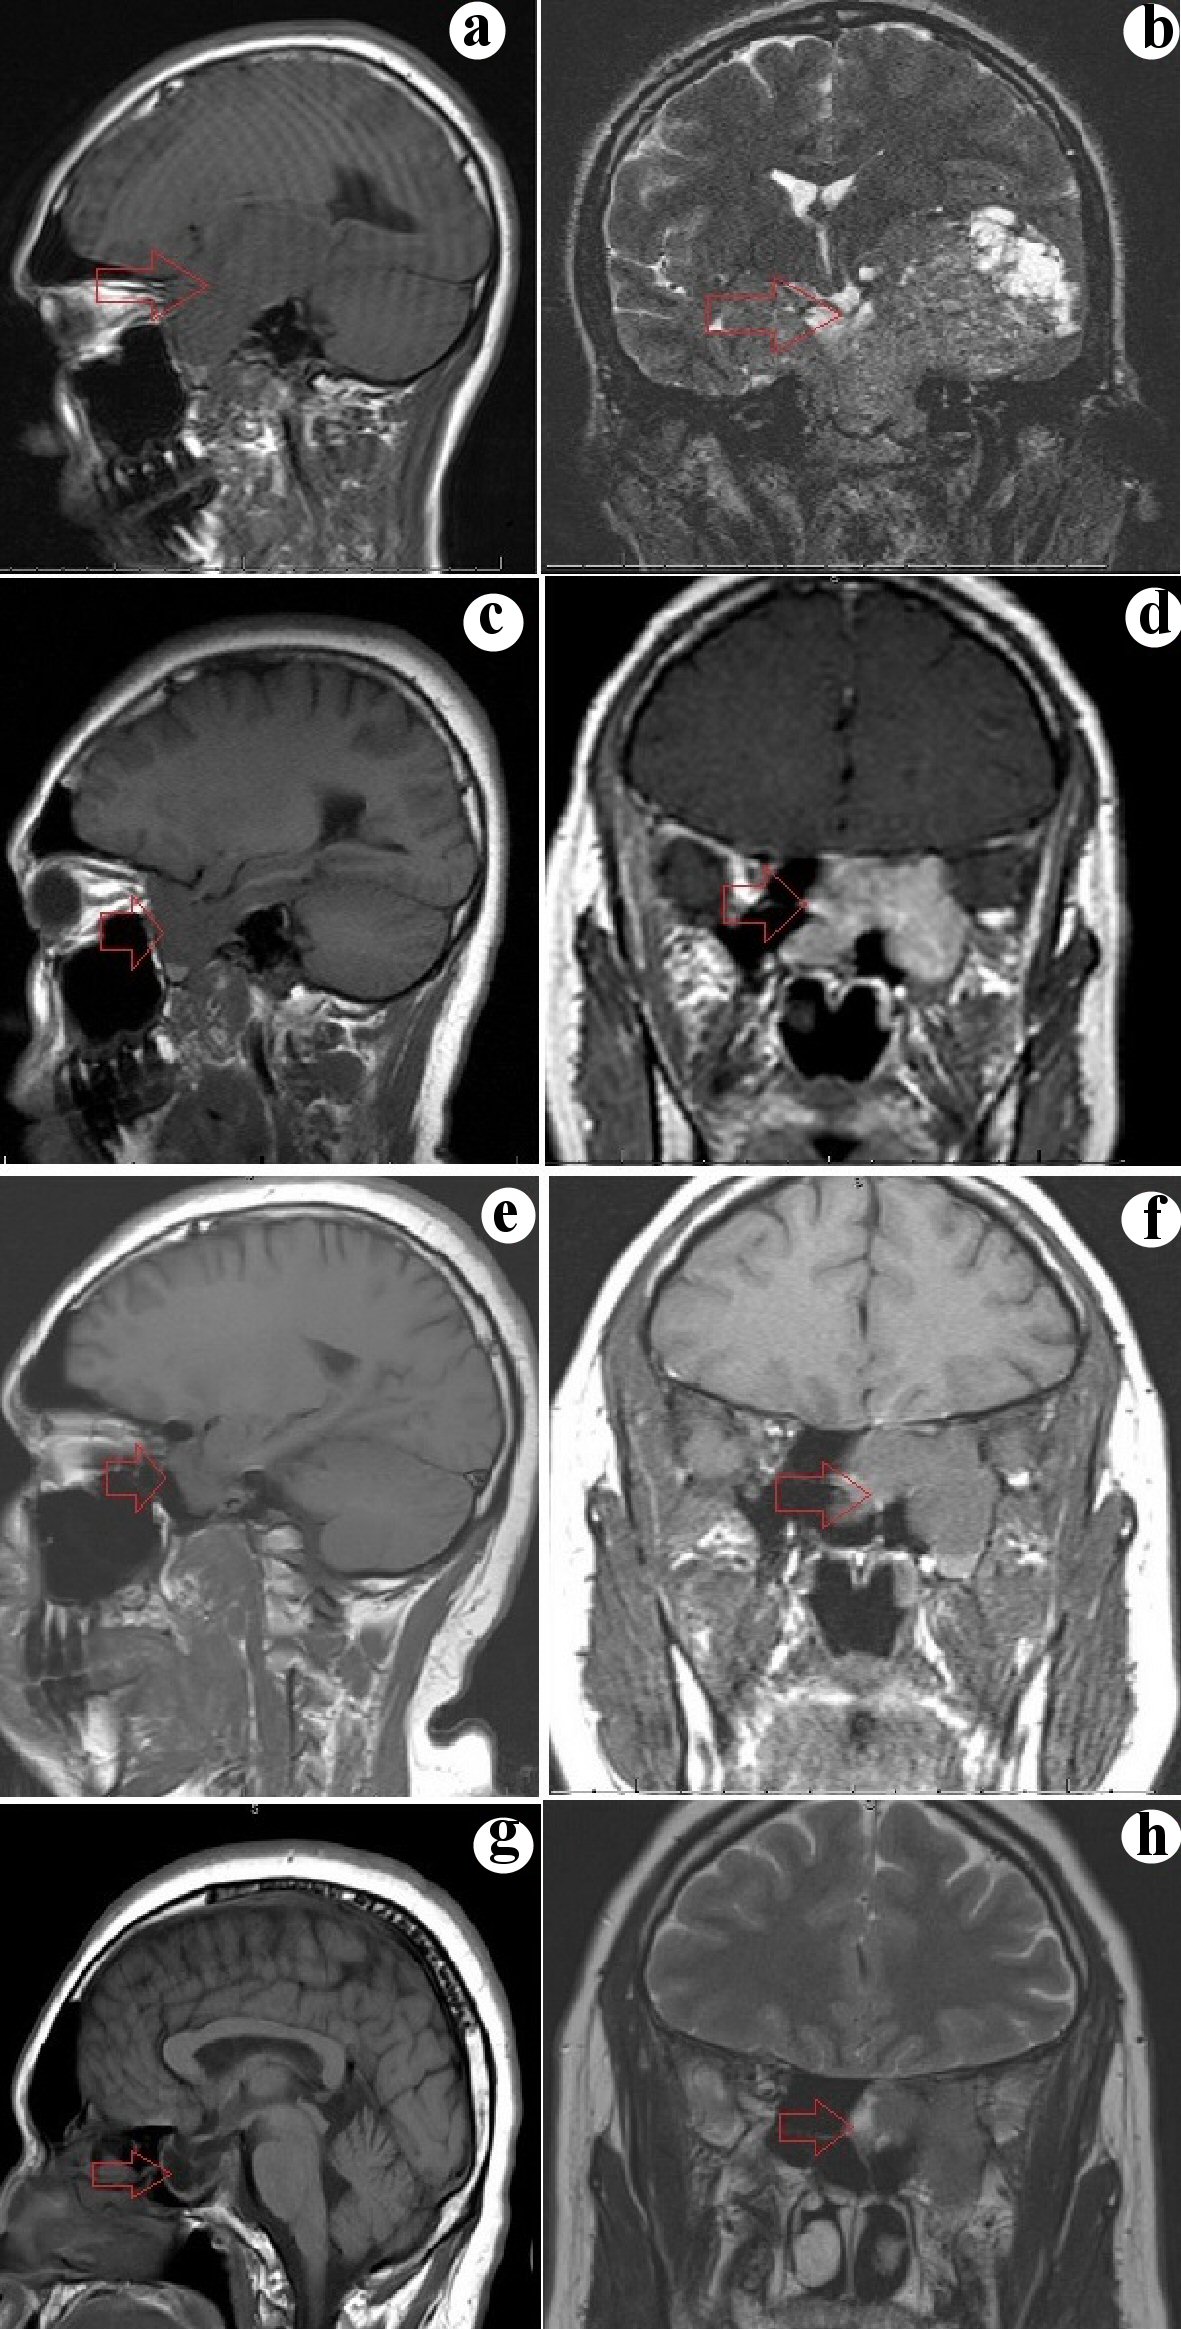
Figure 1. (a, b) Sagittal and coronal section of MRI showing a huge mass replacing the sphenoid sinus, extending laterally through the cavernous sinus and middle cranial fossa, compressing bilateral temporal lobe and left midbrain, superiorly involving the inferior third ventricle and ethmoid sinuses anteriorly. (c, d) Sagittal and coronal section of MRI 6 months after initiation of treatment show a significant reduction in the size of the tumor with clearance of the third ventricle and ethmoid sinus and persistent involvement of cavernous sinus and left temporal lobe. (e, f) Sagittal and coronal section of MRI showing a further decrease in the size of the tumor (3.2 cm) and a reduction in the involvement of the left temporal lobe. (g, h) Sagittal and coronal section of MR showing a further decrease in the size of the tumor (2.5 cm) and a reduction in the involvement of the left temporal lobe. MRI: magnetic resonance imaging.
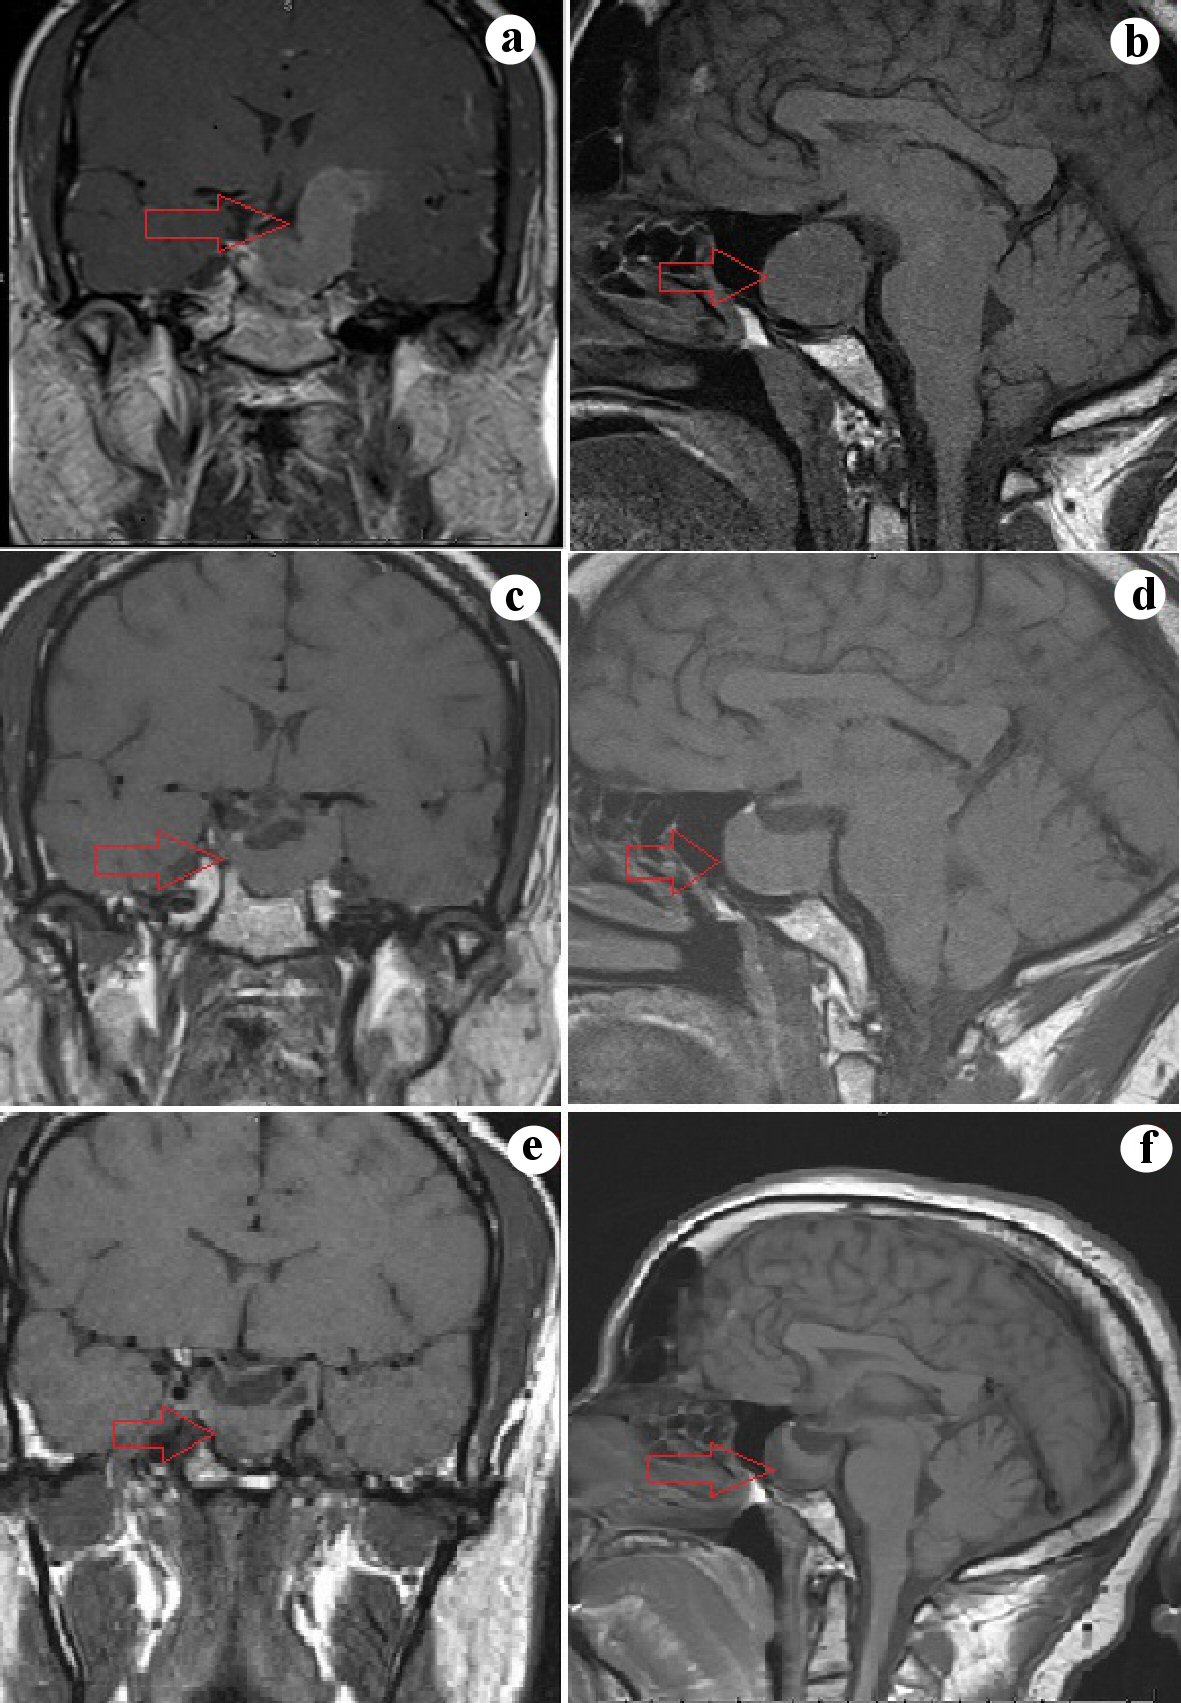
Figure 2. (a, b) Sagittal and coronal sections of the MRI showing a 4.3 cm sellar mass exerting mass effect on the optic chiasma and involving bilateral cavernous sinus and extending into the left temporal lobe. (c, d) Sagittal and coronal sections of the MRI 3 months later showing a decrease in the size of the sellar mass (2.7) and a decrease in the extent of temporal lobe involvement. (e, f) Sagittal and coronal sections of the MRI after 6 years shows a persistent sellar mass (2.5 cm) with the continued involvement of the left cavernous sinus. MRI: magnetic resonance imaging.
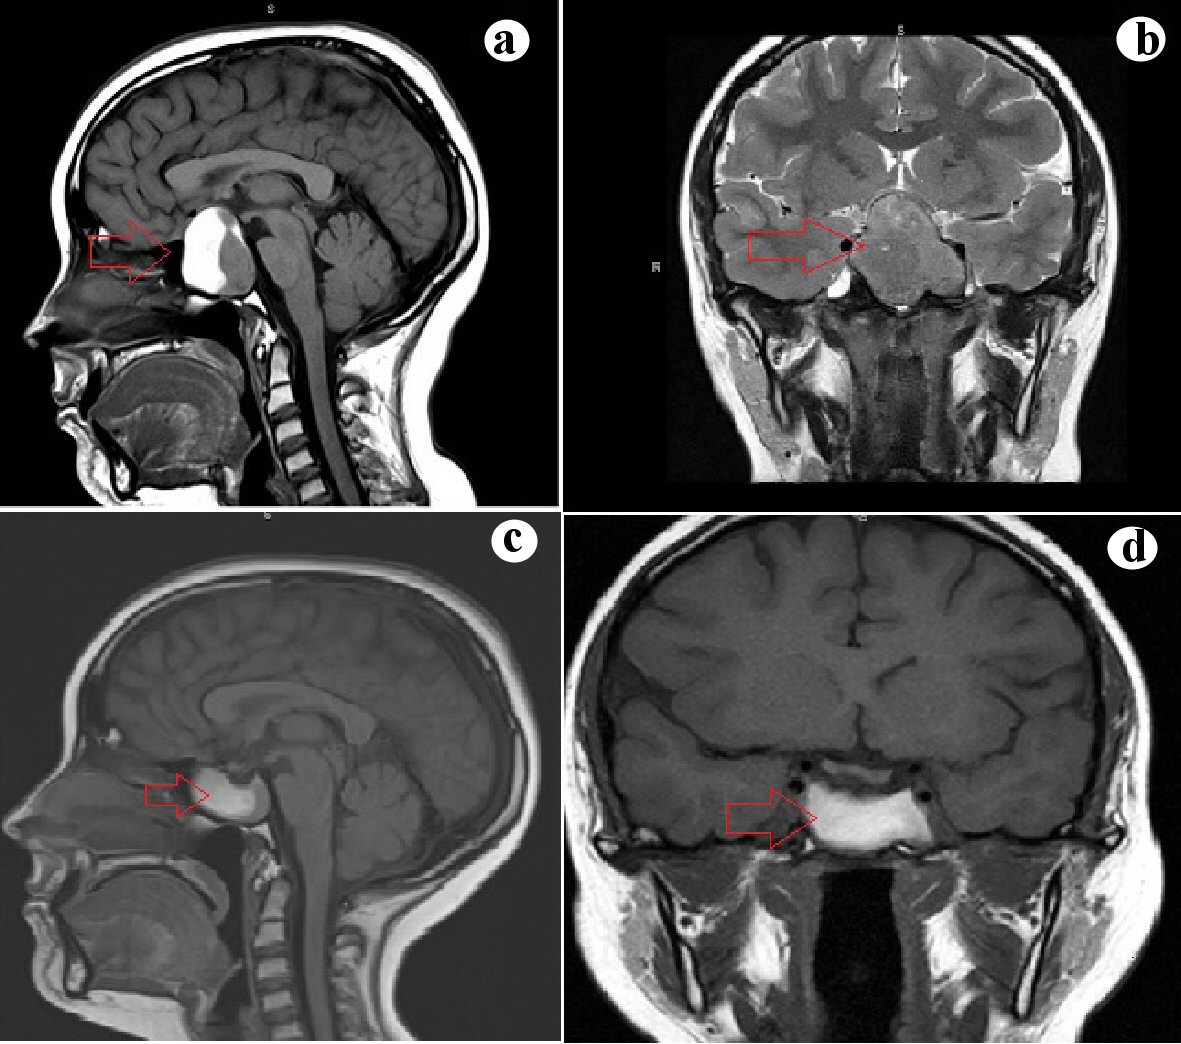
Figure 3. (a, b) Sagittal and coronal sections of the MRI showing a 4 cm sellar mass involving the left cavernous sinus and exerting mass effect on the optic chiasma and prechiasmatic optic nerves. (c, d) Sagittal and coronal section of MRI 3 months later showing a decrease in the size of the mass (3 cm) without the involvement of the cavernous sinus and no mass effect on the optic chiasma. MRI: magnetic resonance imaging.
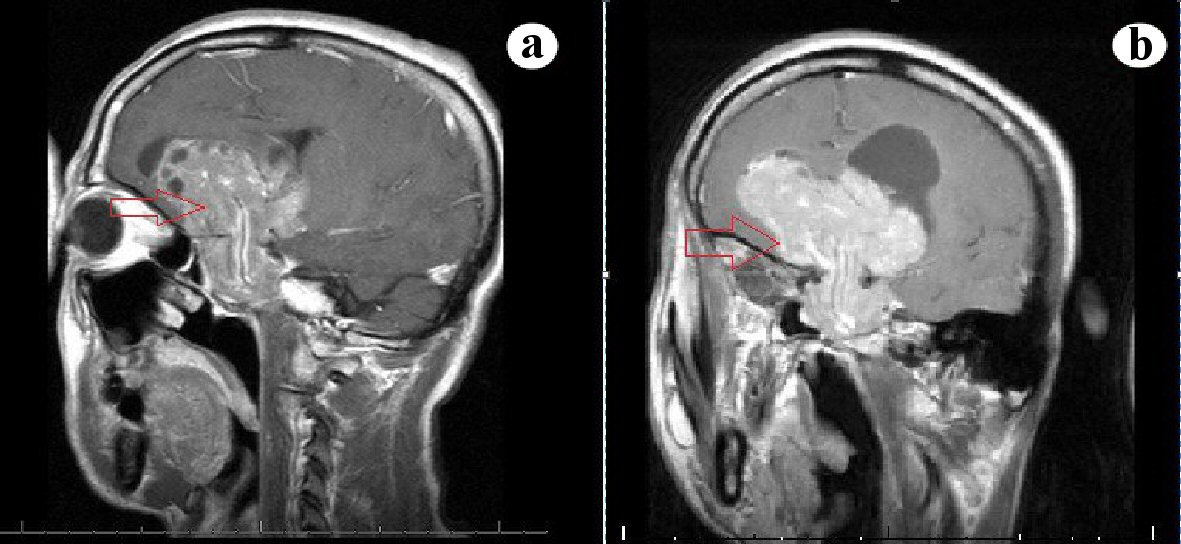
Figure 4. (a, b) Sagittal and coronal sections of MRI showing a giant sellar mass compressing the suprasellar structures and ventricular system. MRI: magnetic resonance imaging.
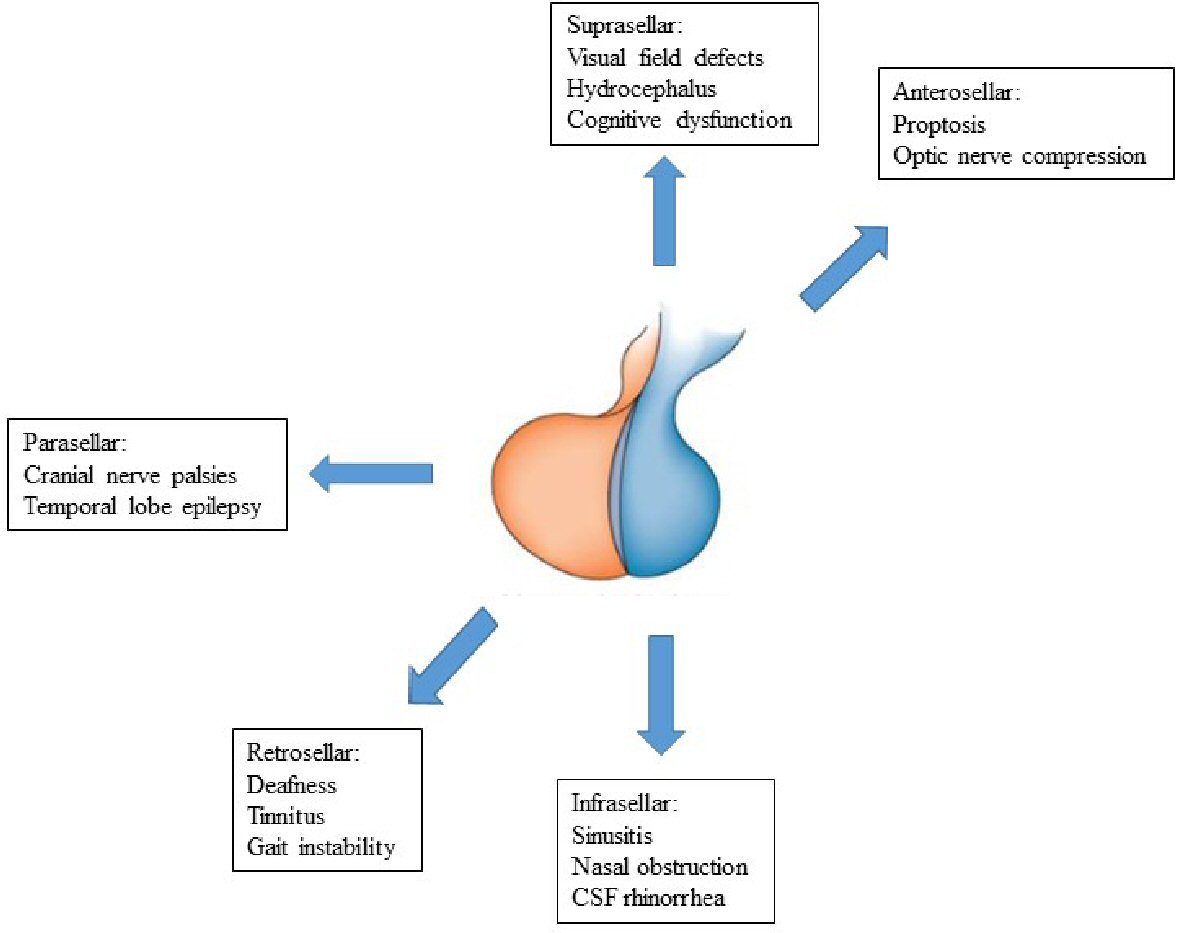
Figure 5. Symptoms and complications of giant prolactinomas. MRI: magnetic resonance imaging. CSF: cerebrospinal fluid.
Table
Table 1. Pituitary Hormonal Assessment at the Time of Diagnosis
| Case 1 | Case 2 | Case 3 | Case 4 |
|---|
| IGF-1: insulin like growth factor-1; T4: thyroxine; ACTH: adrenocorticotropic hormone. |
| Prolactin (0 - 25 ng/mL) | > 4,700 | 4,568 | > 4,700 | 1.4 |
| IGF-1 (116 - 341 ng/mL) | 256 | 257 | 119 | 122 |
| Total testosterone (240 - 950 ng/dL) | 170 | 363.4 | - | 70 |
| Free T4 (0.9 - 1.7 ng/dL) | 1.64 | 0.82 | 0.54 | 1.2 |
| ACTH (7.2 - 63.3 pg/mL) | 55 | 43 | 19 | 5.7 |
| Cortisol (6.2 - 19.4 µg/dL) | 15 | 20.7 | 0.65 | 0.86 |
| Luteinizing hormone (1.14 - 8.75 mIU/mL) | 5.4 | 1.2 | 1.39 | 4.83 |
| Follicle stimulating hormone (0.95 - 11.95 mIU/mL) | 3 | 1.1 | 5.02 | 6.14 |