Journal of Endocrinology and Metabolism, ISSN 1923-2861 print, 1923-287X online, Open Access
Article copyright, the authors; Journal compilation copyright, J Endocrinol Metab and Elmer Press Inc
Journal website http://www.jofem.org

Original Article

Volume 2, Number 2, April 2012, pages 88-95


Derivation and Validation of a Risk Index to Predict All-Cause Mortality in Type 2 Diabetes Mellitus

Figure

Figure 1.
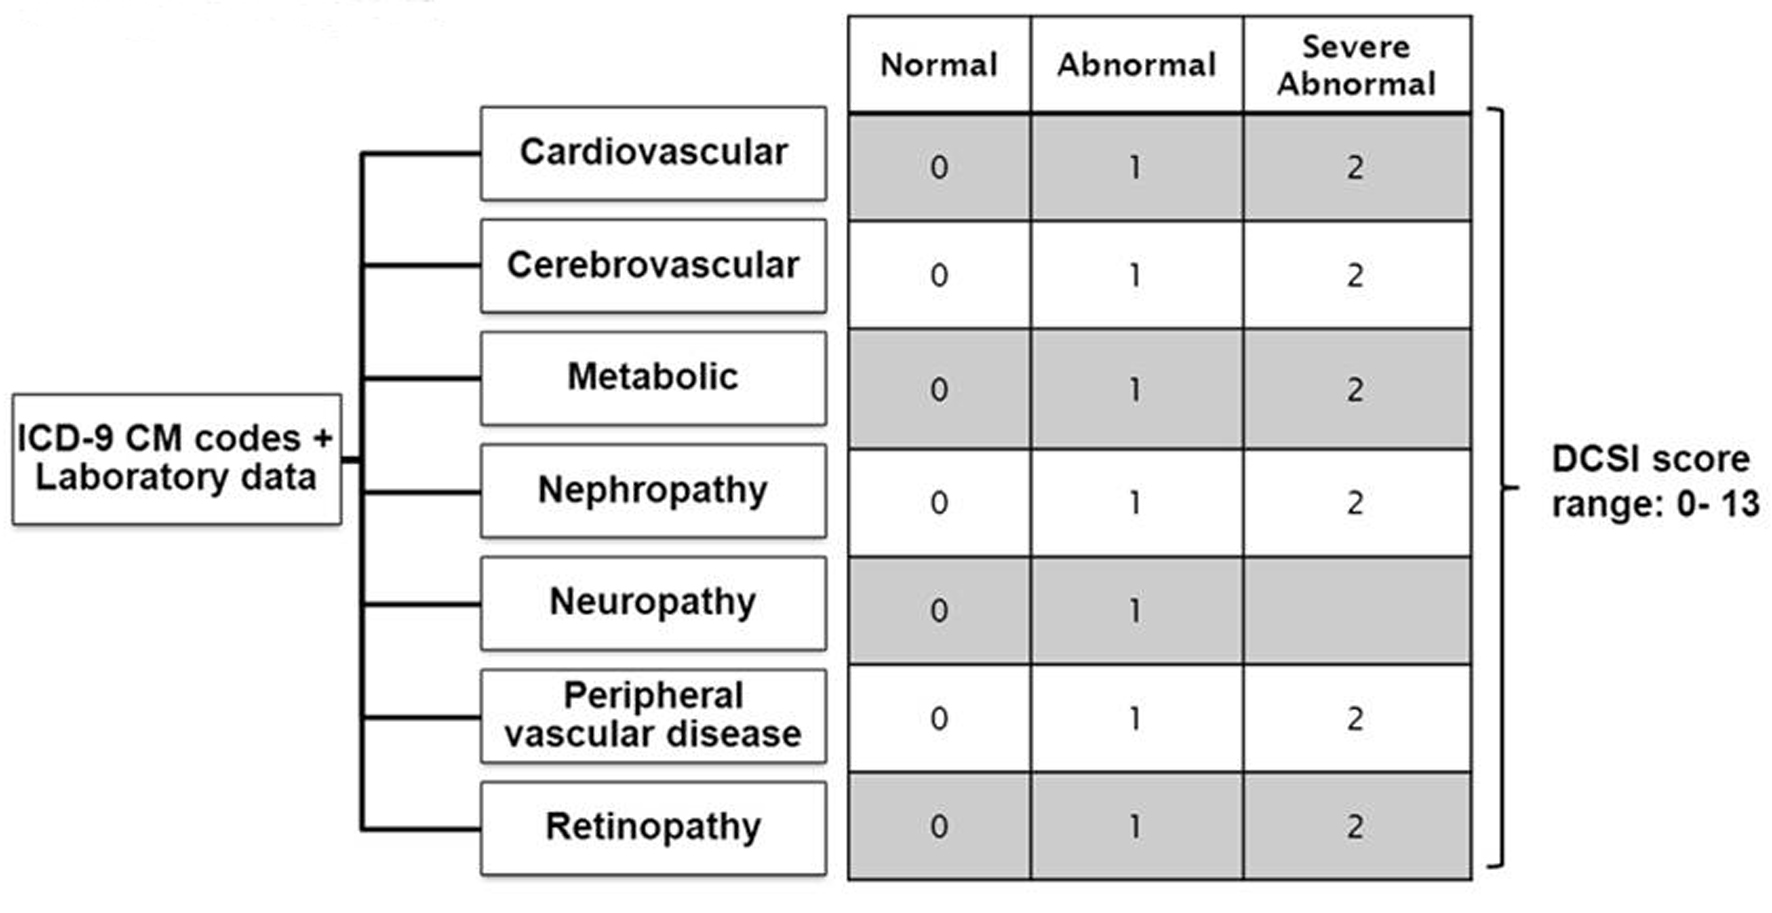
Figure 1. Constructing Diabetes Complication Severity Index in Chronic Disease Management System. *ICD-9 CM codes indicate International Classification of Disease, Ninth Revision, Clinical Modification. *Severity index is based on a severity scale for each complication (ICD-9 CM codes) as follows: 0 = normal, 1 = abnormal, 2 = severe abnormal. *Diabetes complication severity score was developed and validated by Yong et al, 2008 [8].

Tables

Table 1. Characteristics of Type 2 Diabetes Mellitus in National Healthcare Group Polyclinics in 2007
 
2 years all-cause mortality, no. (%) of patients
Overall (n = 59,767)Derivation (n = 29,890)Validation (n = 29,877)
Patient Variable
Age Group, yr
< 453764 (6.3)1838 (6.2)1926 (6.4)
45 - 5411581 (19.4)5828 (19.5)5753 (19.2)
55 - 6418124 (30.3)9053 (30.3)9071 (30.3)
65 - 7416110 (27)8041 (26.9)8069 (27)
75 - 848497 (14.2)4233 (14.2)4264 (14.3)
85+1691 (2.8)884 (3)807 (2.7)
Female32088 (53.7)16101 (53.9)15987 (53.5)
Race
Chinese42268 (70.7)21176 (70.8)21092 (70.6)
Indian7854 (13.1)3882 (13.0)3972 (13.3)
Malay7675 (12.8)3841 (12.9)3834 (12.8)
Others1970 (3.3)991 (3.3)979 (3.3)
Cancer History1601 (2.7)827 (2.8)774 (2.6)
Diabetes Complication Severity Score
033227 (55.6)16549 (55.4)16678 (55.8)
112272 (20.5)6133 (20.5)6139 (20.5)
27970 (13.3)4015 (13.4)3955 (13.2)
33123 (5.2)1592 (5.3)1531 (5.1)
41783 (3.0)909 (3.0)874 (2.9)
5+1392 (2.3)692 (2.3)700 (2.3)
Hypertension47087 (78.8)23464 (78.5)23623 (79.1)
Dyslipidiaemia57071 (95.5)28542 (95.5)28529 (95.5)
HbA1c, %
< 7.127115 (45.4)13589 (45.5)13526 (45.3)
7.1 - 8.018870 (31.6)9473 (31.7)9397 (31.5)
8.1 - 9.06616 (11.1)3292 (11.0)3324 (11.1)
9.1 - 102886 (4.8)1459 (4.9)1427 (4.8)
10.1+3247 (5.4)1589 (5.3)1658 (5.5)
Missing1033 (1.7)488 (1.6)545 (1.8)
LDL-c, mmol/L
< 2.624541 (41.1)12368 (41.4)12173 (40.7)
2.6 - 3.317910 (30)8952 (29.9)8958 (30)
3.4 - 4.06570 (11)3304 (11.1)3266 (10.9)
4.1+3386 (5.7)1683 (5.6)1703 (5.7)
Missing7360 (12.3)3583 (12.0)3777 (12.6)
eGFR, mL/min/1.73m2
Stage 113407 (22.4)6654 (22.3)6753 (22.6)
Stage 225926 (43.4)13023 (43.6)12903 (43.2)
Stage 310642 (17.8)5394 (18.0)5248 (17.6)
Stage 41155 (1.9)581 (1.9)574 (1.9)
Stage 5331(0.6)159 (0.5)172 (0.6)
Missing8306 (13.9)4079 (13.6)4227 (14.1)
HDL-c, mmol/L, mean (SD)1.26 (0.34)1.26 (0.34)1.26 (0.34)
Triglycerides, mmol/L, mean (SD)1.55 (0.92)1.55 (0.94)1.54 (0.89)
Body Mass Index (BMI), kg/m2
Underweight21110 (35.3)10575 (35.4)10535 (35.3)
Normal960 (1.6)456 (1.5)504 (1.7)
Obese I19867 (33.2)9967 (33.3)9900 (33.1)
Obese II6660 (11.1)3343 (11.2)3317 (11.1)
Overweight2126 (3.6)1035 (3.5)1091 (3.7)
Missing9044 (15.1)4514 (15.1)4530 (15.2)
Systolic BP, mm Hg, mean (SD)132 (14)132 (14)132 (14)
Diastolic BP, mm Hg, mean (SD)77 (8)77 (8)78 (8)
Insulin use5958 (10.0)2934 (9.8)3024 (10.1)
Admission Variable
  Hospitalization during previous 1 year6934 (11.6)3512 (11.7)3422 (11.5)
  Visits to emergency department during previous 1 year9757 (16.4)4891 (16.4)4866 (16.3)
  Visits to specialist outpatient consultation27251 (45.6)13836 (46.3)13415 (44.9)


Table 2. Final Logistic Regression Model for Risk of Mortality (Derivation Group Only, n = 29,877)
 
VariableOdds ratio (95% CI)
Age1.07 (1.06 - 1.07)
Cancer history6.97 (5.81 - 8.36)
Diabetes Complication Severity Score
Category
  11.95 (1.65 - 2.30)
  22.69 (2.28 - 3.18)
  33.93 (3.22 - 4.80)
  47.13 (5.79 - 8.80)
  5+13.88 (11.28 - 17.09)


Table 3. ACC Index for the Quantification of Risk of 2-Year All-Cause Mortality
 
Risk factorValuePoints
Age ("A")< 400
40 - 491
50 - 593
60 - 695
70 - 796
80+8
Cancer history ("C")
Diabetes-related Complication (Diabetes Complication Severity Score ) ("C")
Yes5
00
12
23
34
45
5+7


Table 4. Sensitivity-Specificity Tradeoff
 
ACC scoreObserved probabilityExpected probabilitySensitivitySpecificity
00.20.399.91.8
10.30.499.410.2
21.60.699.310.7
30.70.999.310.7
41.71.396.232.2
51.41.990.254.6
63.72.890.254.6
73.04.077.373.6
85.85.863.785.2
99.28.454.490.0
1013.511.941.694.3
1119.716.630.096.8
1224.022.822.898.0
1331.230.311.899.3
1425.739.111.899.3
1548.548.74.199.8
1649.158.34.199.8
1741.967.41.4100.0
1859.175.31.4100.0
2080.086.90.0100.0