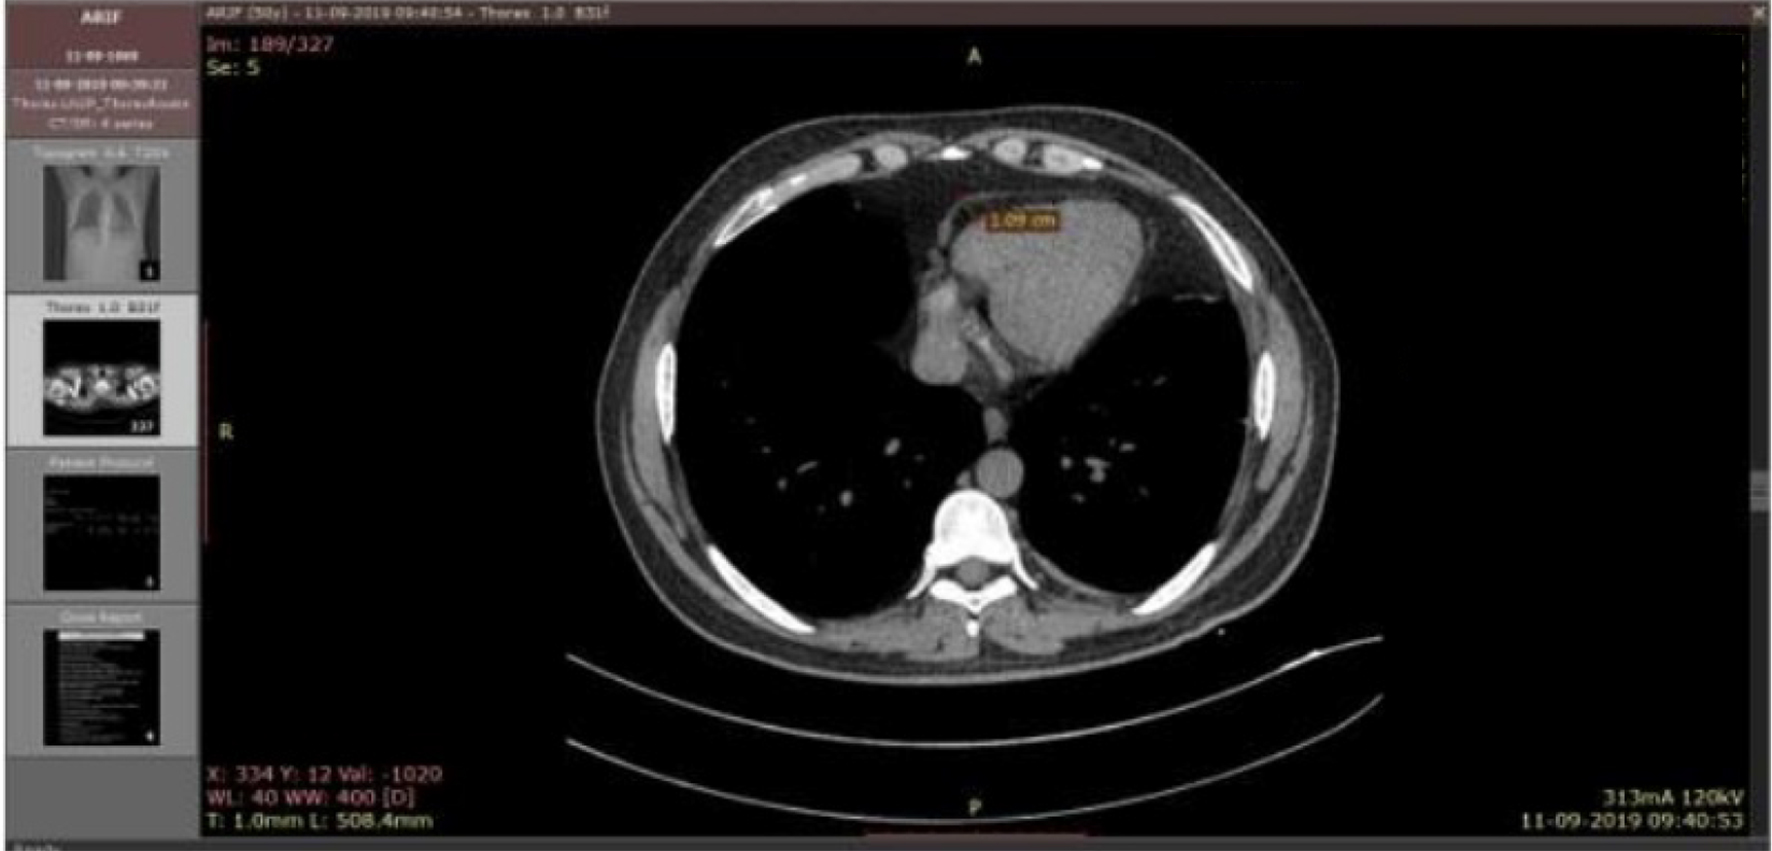
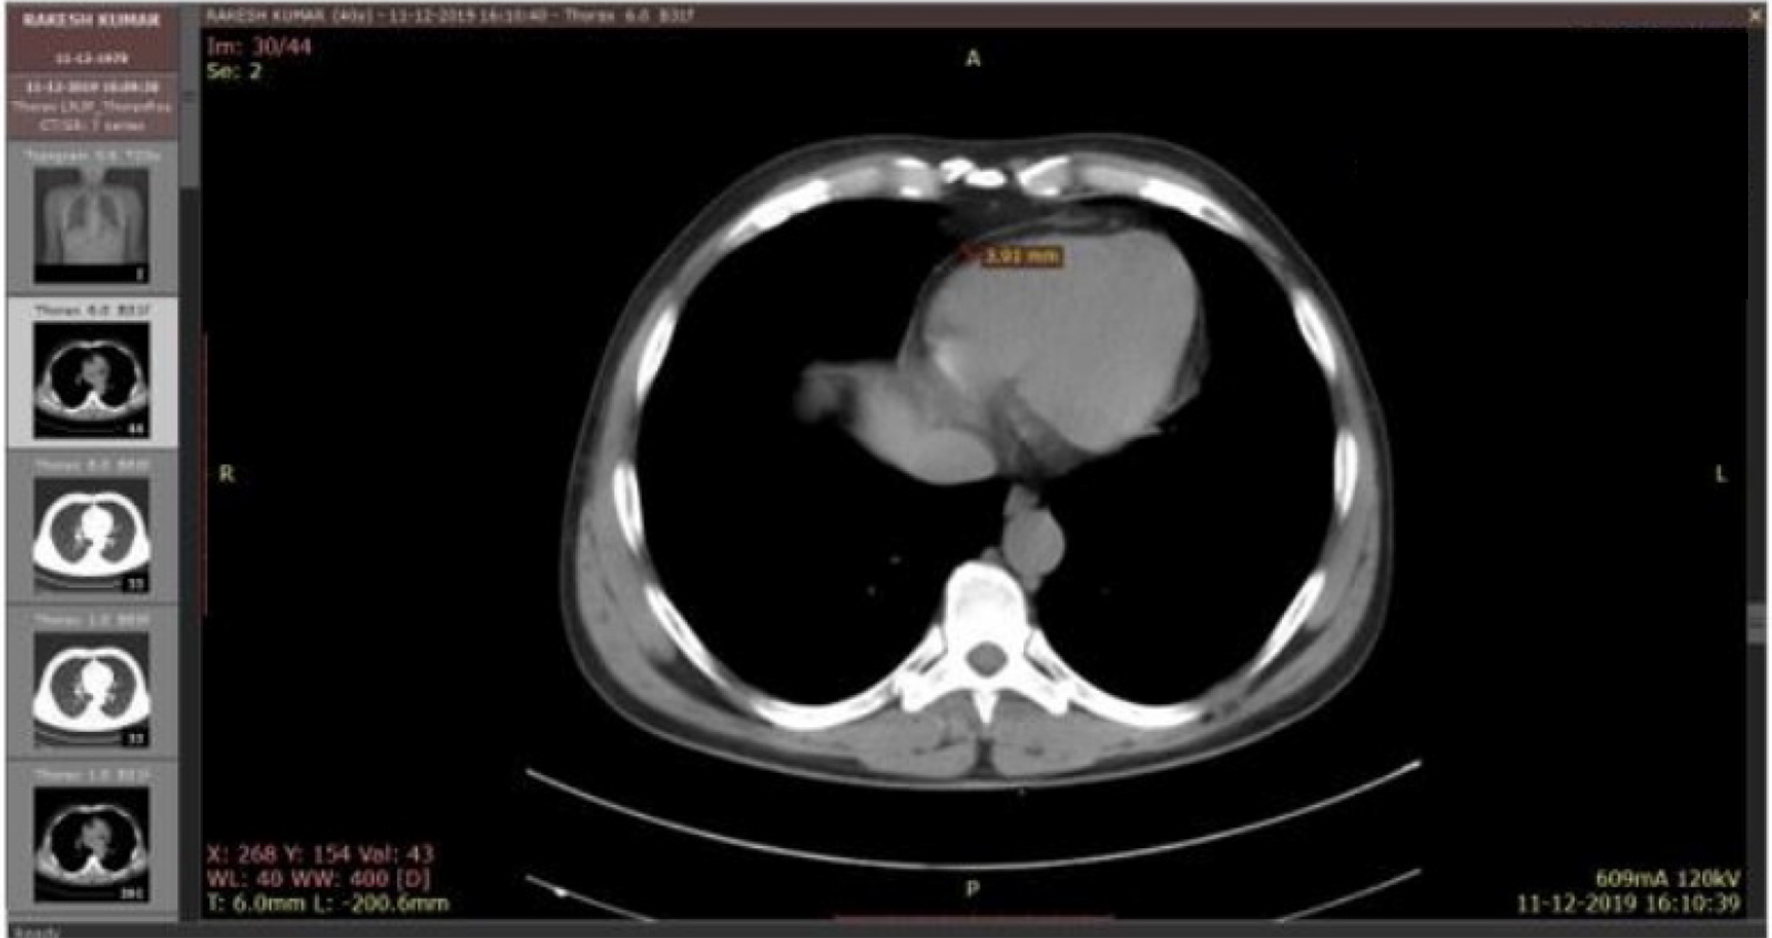
Figure 1. NCCT of chest showing EAT thickness in a case subject. NCCT: non-contrast computed tomography; EAT: epicardial adipose tissue.
| Journal of Endocrinology and Metabolism, ISSN 1923-2861 print, 1923-287X online, Open Access |
| Article copyright, the authors; Journal compilation copyright, J Endocrinol Metab and Elmer Press Inc |
| Journal website https://www.jofem.org |
Original Article
Volume 10, Number 6, December 2020, pages 173-181
Epicardial Adipose Tissue Thickness as a Reliable Marker of Increased Cardiovascular Risk in Patients With Type 2 Diabetes Mellitus
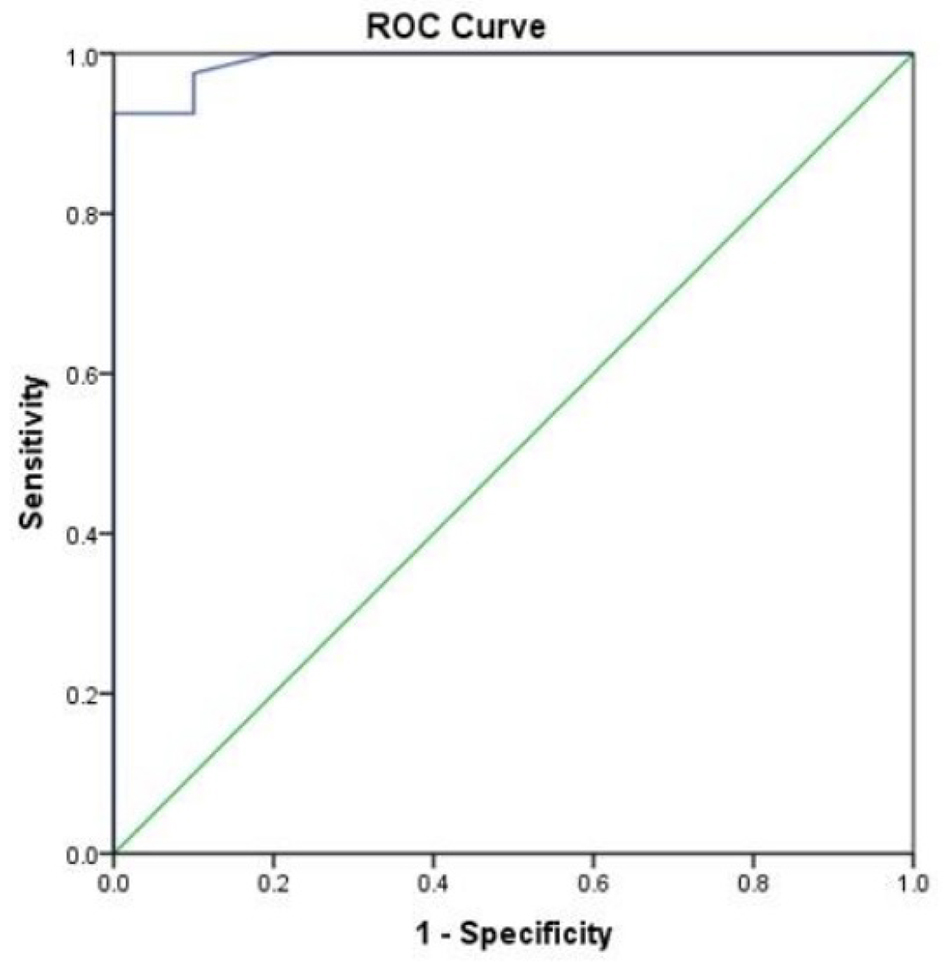
Figures
Tables
| Cases | Controls | P value | |
|---|---|---|---|
| SBP: systolic blood pressure; DBP: diastolic blood pressure; BMI: body mass index; TLC: total leukocyte count; TG: triglyceride; LDL: low-density lipoprotein; HDL: high-density lipoprotein; FBS: fasting blood sugar; PPBS: post prandial blood sugar; AST: aspartate transaminase; ALT: alanine transaminase; ALP: alkaline phosphatase; EAT: epicardial adipose tissue; CIMT: carotid intima-media thickness. | |||
| Age (in years) | 47.48 ± 7.37 | 39.70 ± 4.24 | - |
| Male (%) | 37.5 | 80.0 | - |
| Female (%) | 62.5 | 20.0 | - |
| Duration(years) | 5.83 ± 4.02 | - | - |
| Pulse rate (beats per minute) | 76.35 ± 5.54 | 76.01 ± 3.33 | 0.95 |
| SBP (mm Hg) | 126.05 ± 5.51 | 119.01 ± 6.48 | < 0.01 |
| DBP (mm Hg) | 77.15 ± 4.39 | 78.40 ± 3.24 | 0.64 |
| BMI (kg/m2) | 19.92 ± 1.48 | 20.82 ± 0.93 | 0.04 |
| Hb (g/dL) | 12.71 ± 1.37 | 14.06 ± 0.55 | < 0.01 |
| TLC (/µL) | 7,181.50 ± 1,787.46 | 6,570.01 ± 1,629.62 | 0.43 |
| P/C (in Lakhs) | 2.13 ± 0.55 | 2.39 ± 0.55 | 0.12 |
| Blood urea (mg/dL) | 27.99 ± 10.45 | 26.50 ± 3.59 | 0.85 |
| Serum creatinine (mg/dL) | 0.825 ± 0.141 | 0.79 ± 0.12 | 0.43 |
| TG (mg/dL) | 101.33 ± 23.57 | 93.80 ± 20.92 | 0.52 |
| Total cholesterol (mg/dL) | 153.55 ± 24.60 | 115.90 ± 30.89 | < 0.01 |
| LDL (mg/dL) | 96.90 ± 17.16 | 77.30 ± 9.94 | < 0.001 |
| HDL (mg/dL) | 40.65 ± 4.22 | 43.20 ± 5.11 | 0.13 |
| FBS (mg/dL) | 162.03 ± 55.24 | 95.00 ± 4.9 | < 0.001 |
| PPBS (mg/dL) | 234.70 ± 74.72 | 112.60 ± 7.19 | < 0.001 |
| HbA1c (%) | 9.27 ± 2.55 | 4.98 ± 0.22 | < 0.001 |
| Calcium (mg/dL) | 8.95 ± 0.34 | 9.10 ± 0.21 | 0.11 |
| Phosphate (mg/dL) | 3.77 ± 0.35 | 3.97 ± 0.27 | 0.10 |
| Total bilirubin (mg/dL) | 0.76 ± 0.13 | 0.79 ± 0.09 | 0.51 |
| Direct bilirubin (mg/dL) | 0.26 ± 0.09 | 0.21 ± 0.05 | 0.18 |
| AST (IU/L) | 30.38 ± 10.83 | 27.20 ± 4.16 | 0.29 |
| ALT (IU/L) | 34.03 ± 15.49 | 25.50 ± 3.41 | 0.11 |
| ALP | 58.70 ± 6.64 | 49.30 ± 14.60 | 0.05 |
| Total protein (mg/dL) | 7.32 ± 0.36 | 7.59 ± 0.33 | 0.03 |
| Serum albumin (mg/dL) | 3.95 ± 0.20 | 4.04 ± 0.16 | 0.23 |
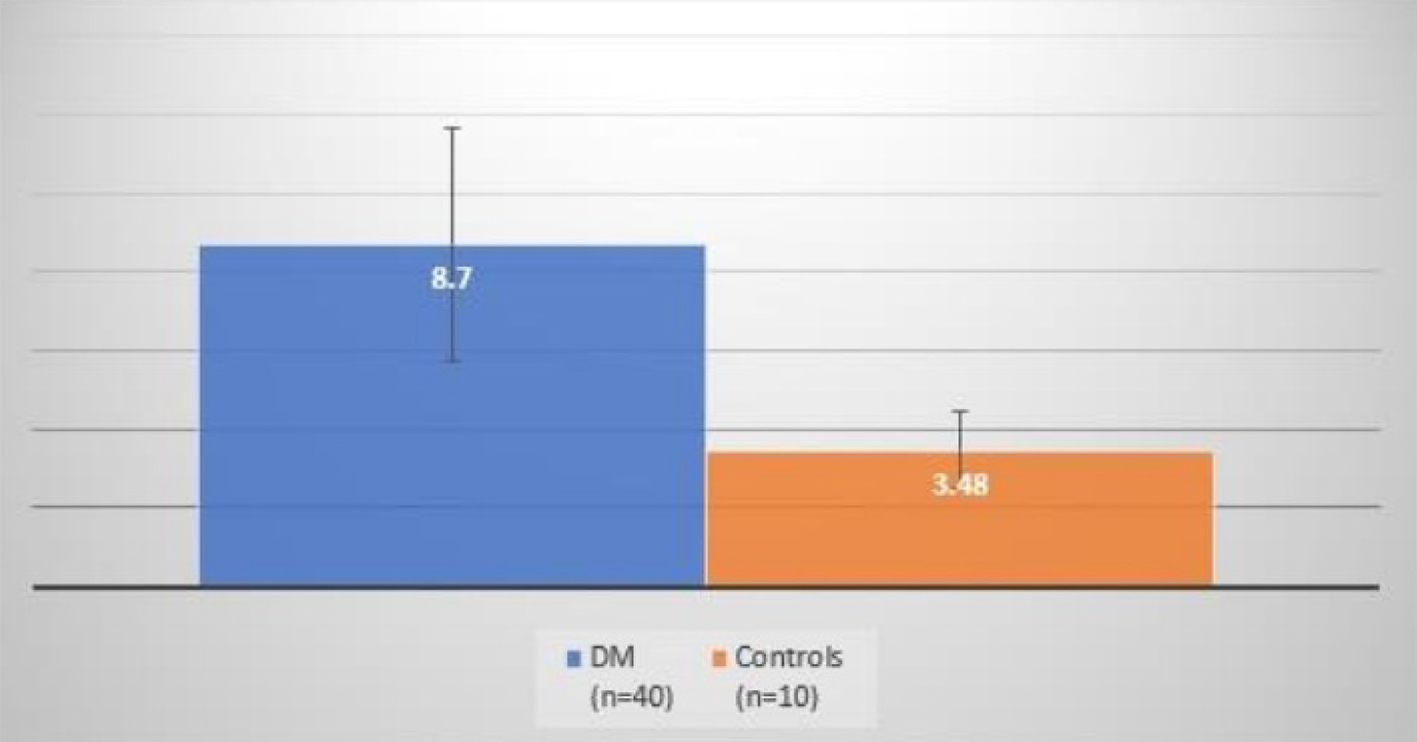
| EAT thickness (mm) | 8.70 ± 2.94 | 3.48 ± 0.99 | < 0.001 |
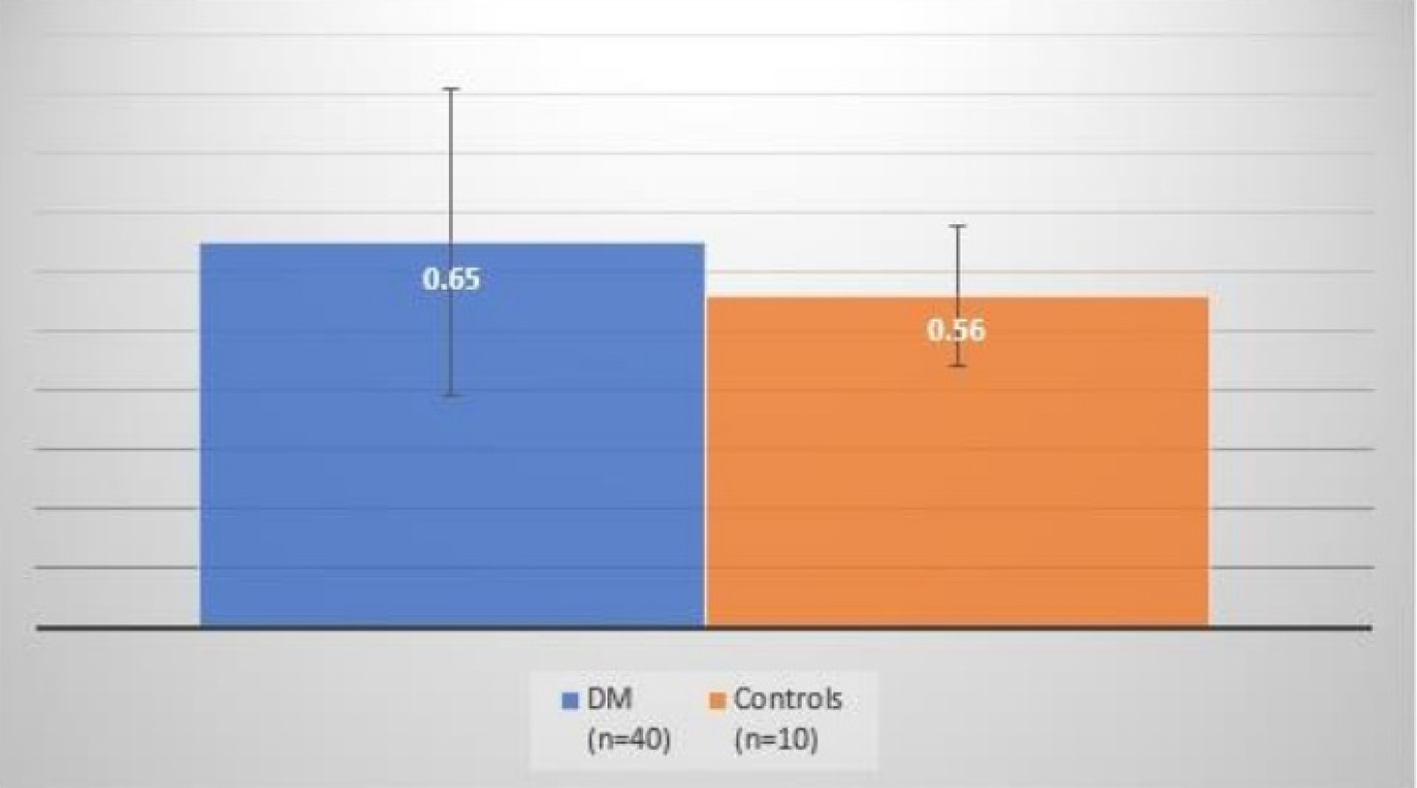
| CIMT (mm) | 0.65 ± 0.26 | 0.56 ± 0.12 | 0.17 |
| r value | P value | |
|---|---|---|
| BMI: body mass index; CIMT: carotid intima-media thickness; FBS: fasting blood sugar; PPBS: post prandial blood sugar; TG: triglyceride. | ||
| HbA1c | 0.86 | < 0.001 |
| Duration of diabetes | 0.34 | 0.02 |
| Age | 0.18 | 0.26 |
| BMI | 0.81 | < 0.001 |
| CIMT | 0.21 | 0.17 |
| FBS | -0.23 | 0.13 |
| PPBS | -0.22 | 0.17 |
| TG | 0.93 | < 0.001 |
| Total cholesterol | 0.94 | < 0.001 |