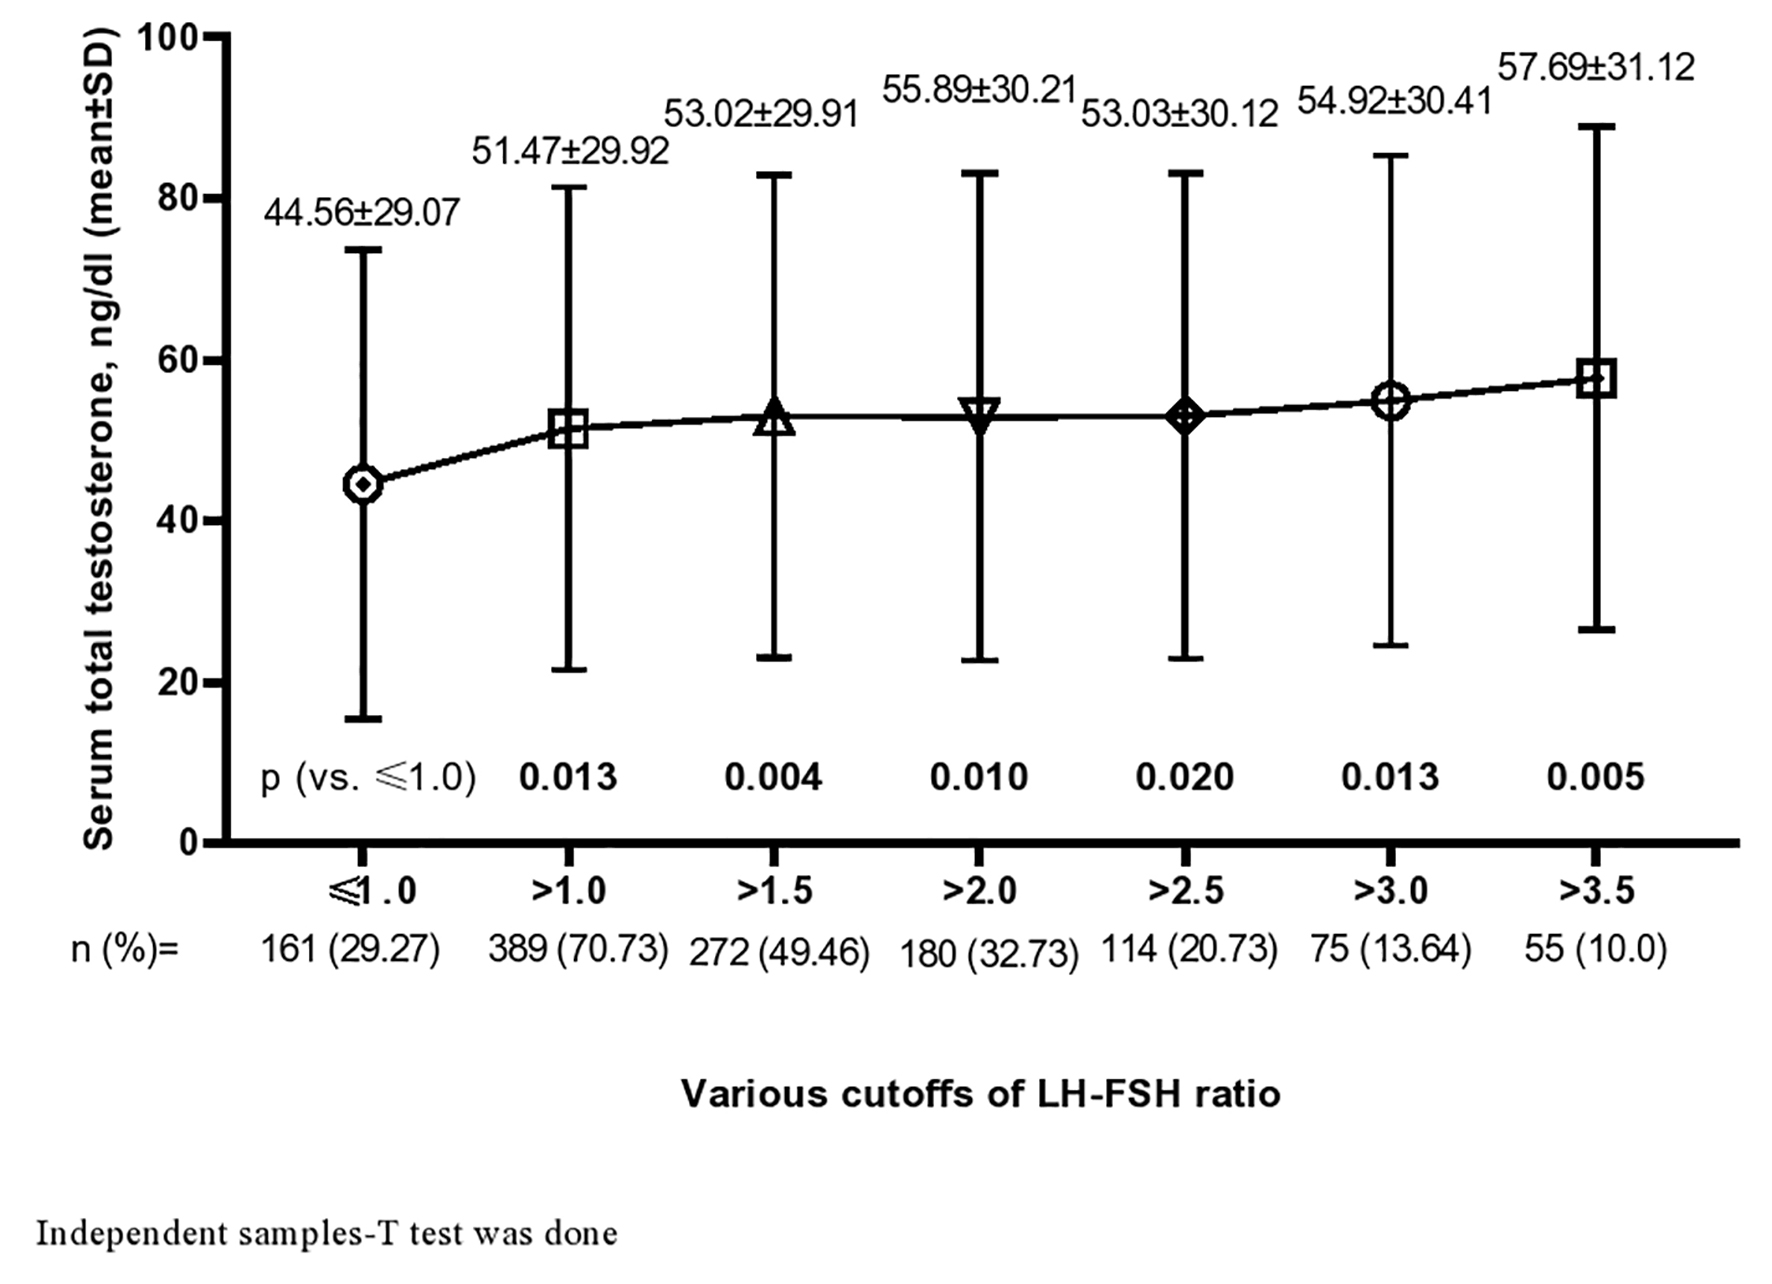
Figure 1. Serum total testosterone (mean ± SD) in altered LH-FSH ratio with different cut-offs. SD: standard deviation; LH: luteinizing hormone; FSH: follicle-stimulating hormone.
| Journal of Endocrinology and Metabolism, ISSN 1923-2861 print, 1923-287X online, Open Access |
| Article copyright, the authors; Journal compilation copyright, J Endocrinol Metab and Elmer Press Inc |
| Journal website https://www.jofem.org |
Original Article
Volume 11, Number 1, February 2021, pages 14-21
Luteinizing Hormone to Follicle-Stimulating Hormone Ratio Significantly Correlates With Androgen Level and Manifestations Are More Frequent With Hyperandrogenemia in Women With Polycystic Ovary Syndrome
Figures
Tables
| Variables | Total (N = 550) | LH-FSH ratio (cut-off > 1.0) | P | Androgenemia (cut-off > 46 ng/dL) | P | ||
|---|---|---|---|---|---|---|---|
| Altered (n = 389, 70.73%) | Normal (n = 161, 29.27%) | High (n = 234, 42.55%) | Normal (n = 316, 57.45%) | ||||
| Within parentheses are percentages over column total of respective variable. Chi-square test was done. PCOS: polycystic ovary syndrome; mF-G: modified Ferriman-Gallwey; BMI: body mass index; WC: waist circumference; BP: blood pressure; TT: total testosterone; LH: luteinizing hormone; FSH: follicle-stimulating hormone. | |||||||
| Personal history | |||||||
| Menstrual abnormality | 454 (82.5) | 325 (83.5) | 129 (80.1) | 0.387 | 207 (88.5) | 247 (78.2) | 0.002 |
| Subfertility | 124 (22.5) | 85 (21.9) | 39 (24.2) | 0.575 | 58 (24.8) | 66 (20.9) | 0.303 |
| Menstrual regulation or abortion | 57 (10.4) | 35 (9.0) | 22 (13.7) | 0.123 | 25 (10.7) | 32 (10.1) | 0.888 |
| Family history | |||||||
| PCOS | 112 (20.4) | 79 (20.3) | 33 (20.5) | 1.000 | 57 (24.4) | 55 (17.4) | 0.045 |
| Subfertility | 127 (23.1) | 91 (23.4) | 36 (22.4) | 0.825 | 59 (25.2) | 68 (21.5) | 0.357 |
| Diabetes mellitus | 339 (61.6) | 233 (59.9) | 106 (65.8) | 0.211 | 158 (67.5) | 181 (57.3) | 0.017 |
| Obesity | 305 (55.5) | 214 (55.0) | 91 (56.5) | 0.778 | 145 (62.0) | 160 (50.6) | 0.009 |
| Physical findings | |||||||
| Hirsutism (mF-G score ≥ 8) | 453 (82.4) | 323 (83.0) | 130 (80.7) | 0.540 | 214 (91.5) | 239 (75.6) | < 0.001 |
| Obesity (BMI ≥ 25 kg/m2) | 369 (67.1) | 256 (65.8) | 113 (70.2) | 0.370 | 156 (66.7) | 213 (67.4) | 0.927 |
| Central obesity (WC ≥ 80 cm) | 425 (77.3) | 305 (78.4) | 120 (74.5) | 0.371 | 184 (78.6) | 241 (76.3) | 0.538 |
| Hypertension (BP ≥ 140/90 mm Hg) | 51 (9.3) | 34 (8.7) | 17 (10.6) | 0.520 | 25 (10.7) | 26 (8.2) | 0.373 |
| Investigations | |||||||
| Hyperandrogenemia (TT > 46 ng/dL) | 234 (42.6) | 170 (43.7) | 64 (39.8) | 0.448 | - | - | - |
| Altered LH-FSH ratio (> 1.0) | 389 (70.7) | - | - | - | 170 (72.6) | 219 (69.3) | 0.448 |
| Polycystic ovarian morphology | 462 (84.0) | 323 (83.0) | 139 (86.3) | 0.373 | 198 (84.6) | 264 (83.5) | 0.814 |
| Variables | Total (N = 550) | LH-FSH ratio (cut-off > 1.0) | P | Androgenemia (cut-off > 46 ng/dL) | P | ||
|---|---|---|---|---|---|---|---|
| Altered (n = 389) | Normal (n = 161) | High (n = 234) | Normal (n = 316) | ||||
| Data are expressed as mean ± SD or median (interquartile range) as appropriate. Independent samples t-test or *Mann-Whitney U test was done. SD: standard deviation; LH: luteinizing hormone; FSH: follicle-stimulating hormone. | |||||||
| Age (years) | 23.14 ± 4.80 | 22.77 ± 4.77 | 24.01 ± 4.79 | 0.006 | 23.19 ± 4.58 | 23.09 ± 4.97 | 0.81 |
| Body mass index (kg/m2) | 27.64 ± 5.34 | 27.54 ± 5.35 | 27.87 ± 5.34 | 0.507 | 27.58 ± 5.29 | 27.68 ± 5.39 | 0.82 |
| Waist circumference (cm) | 87.52 ± 11.77 | 87.36 ± 11.57 | 87.92 ± 12.25 | 0.615 | 87.81 ± 11.59 | 87.32 ± 11.91 | 0.63 |
| Systolic blood pressure (mm Hg) | 111.37 ± 13.22 | 111.20 ± 13.06 | 111.77 ± 13.65 | 0.648 | 112.72 ± 13.16 | 110.37 ± 13.21 | 0.039 |
| Diastolic blood pressure (mm Hg) | 75.20 ± 9.42 | 75.17 ± 9.28 | 75.28 ± 9.76 | 0.895 | 76.50 ± 8.90 | 74.23 ± 9.68 | 0.005 |
| Serum total testosterone (ng/dL) | 49.45 ± 29.81 | 51.47 ± 29.92 | 44.56 ± 29.07 | 0.013 | - | - | - |
| Serum LH-FSH ratio | 1.49 (0.89 - 2.35) | - | - | - | 1.70 (0.96 - 2.39) | 1.42 (0.87 - 2.27) | 0.118* |
| Covariates | Altered LH-FSH ratio | P | Hyperandrogenemia | P | ||
|---|---|---|---|---|---|---|
| B | OR (95% CI) | B | OR (95% CI) | |||
| Binary logistic regression analysis was done. OR: odds ratio; CI: confidence interval; LH: luteinizing hormone; FSH: follicle-stimulating hormone. | ||||||
| Age, years | -0.053 | 0.948 (0.911 - 0.986) | 0.008 | 0.002 | 1.002 (0.965 - 1.040) | 0.921 |
| Body mass index, kg/m2 | -0.013 | 0.987 (0.924 - 1.054) | 0.696 | -0.038 | 0.962 (0.905 - 1.023) | 0.218 |
| Waist circumference, cm | 0.007 | 1.007 (0.976 - 1.038) | 0.671 | 0.011 | 1.011 (0.983 - 1.041) | 0.434 |
| Systolic blood pressure, mm Hg | -0.004 | 0.996 (0.977 -1.015) | 0.682 | 0.003 | 1.003 (0.985 - 1.021) | 0.774 |
| Diastolic blood pressure, mm Hg | 0.002 | 1.002 (0.975 - 1.030) | 0.883 | 0.027 | 1.028 (1.002 - 1.054) | 0.036 |
| Serum total testosterone, ng/dL | 0.082 | 1.086 (1.016 - 1.160) | 0.016 | - | - | - |
| Serum LH-FSH ratio | - | - | - | 0.137 | 1.147 (1.025 - 1.284) | 0.017 |