Journal of Endocrinology and Metabolism, ISSN 1923-2861 print, 1923-287X online, Open Access
Article copyright, the authors; Journal compilation copyright, J Endocrinol Metab and Elmer Press Inc
Journal website https://www.jofem.org

Original Article

Volume 11, Number 3-4, August 2021, pages 69-75


Diagnostic Performance of ACR-TIRADS in Differentiating Benign From Malignant Thyroid Nodules in Patients Undergoing Fine-Needle Aspiration Biopsy: Comparative Study Based on Five International Guidelines for Management of Thyroid Nodules

Figure

Figure 1.
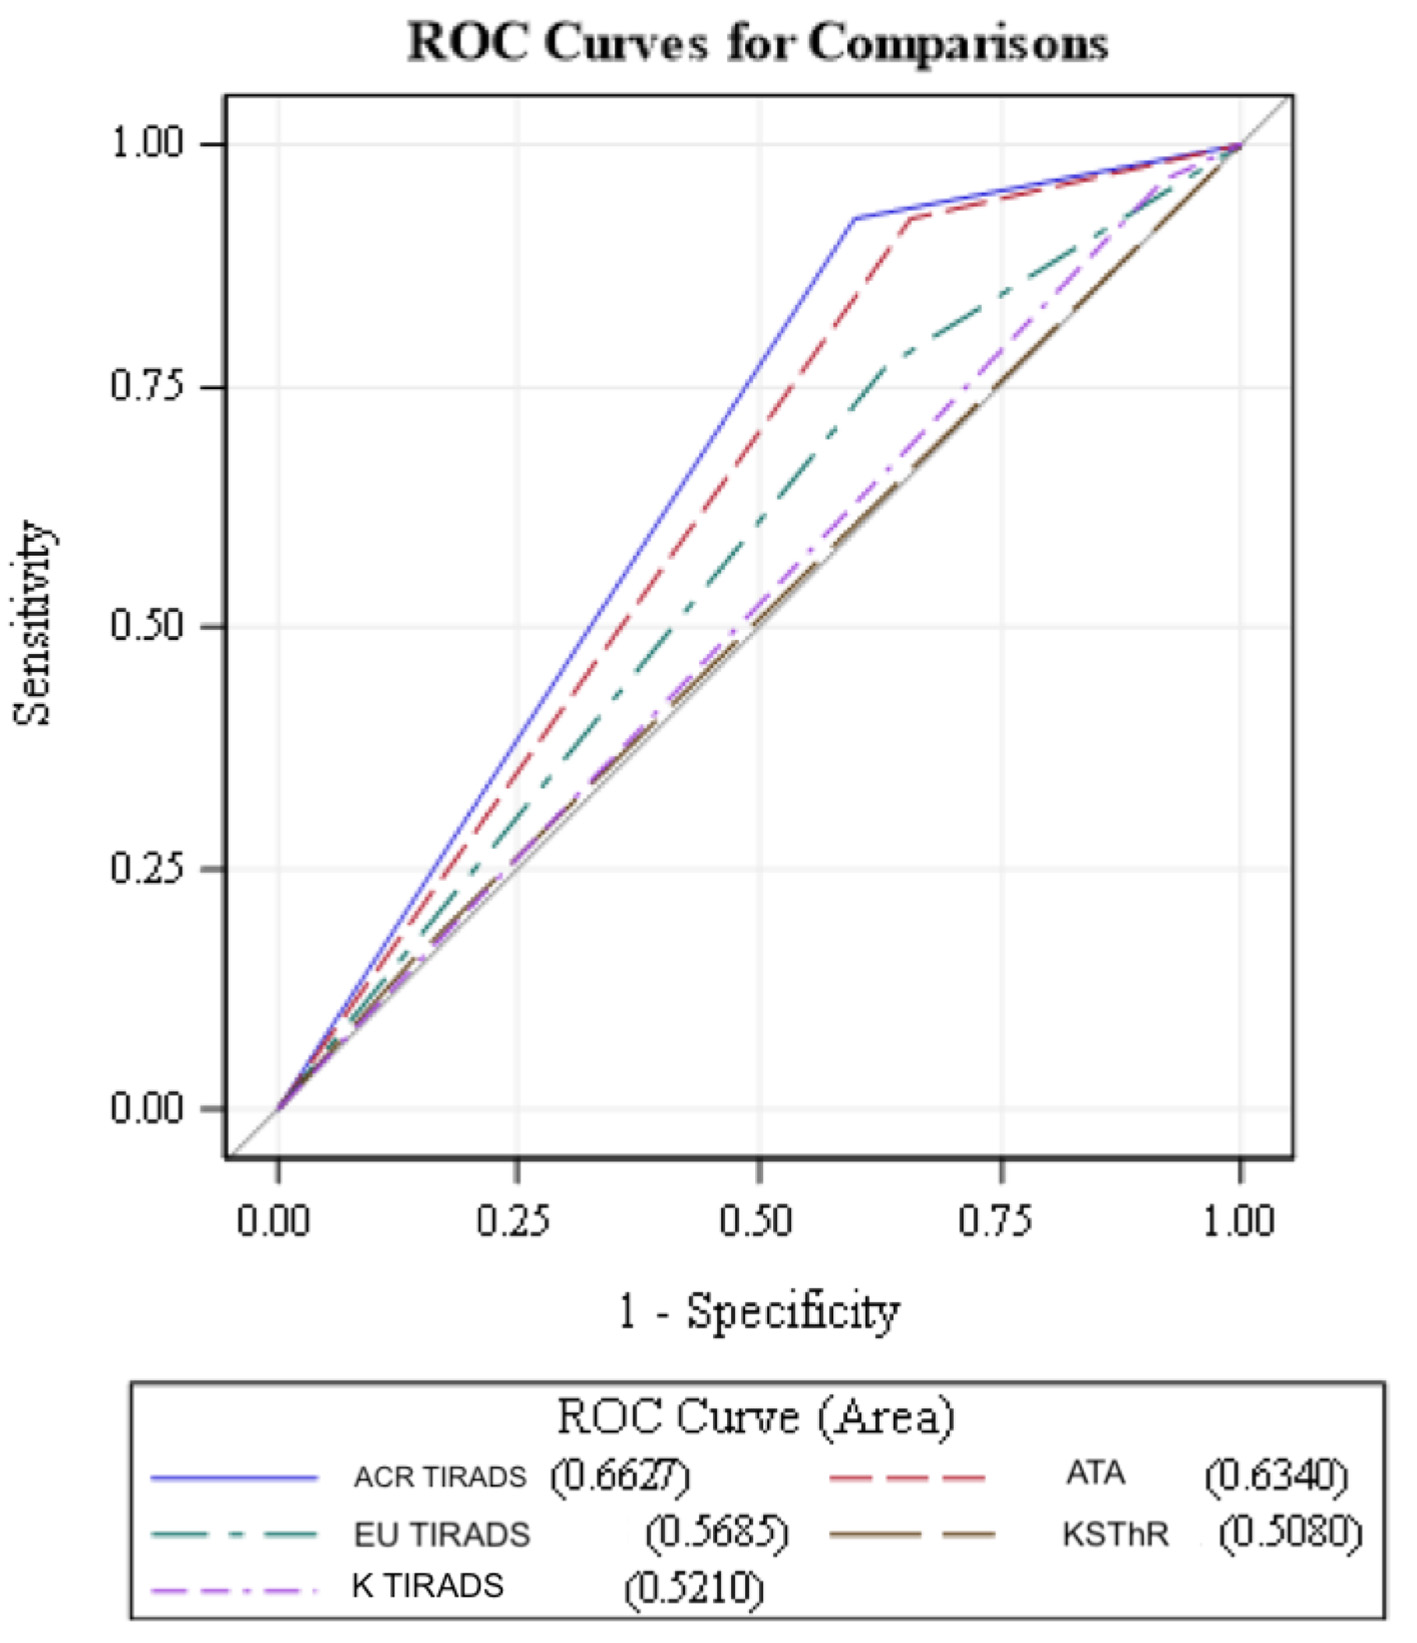
Figure 1. ROC analysis of guidelines. Note that ACR-TIRADS (blue line) has the highest correlation between sensitivity and specificity depicted with largest AUC in the ROC analysis closely followed by ATA guidelines (dotted red lines). ROC: receiver operating curves; ACR-TIRADS: American College of Radiology Thyroid Imaging Reporting and Data System; ATA: American Thyroid Association; EU-TIRADS: European Thyroid Imaging and Reporting Data System; KSThR: Korean Society of Thyroid Radiology; K-TIRADS: Kwak-TIRADS; AUC: area under the curve.

Tables

Table 1. Nodule Characteristics
 
Benign, N (%)Malignant, N (%)Risk of malignancy (%)Test of significance
Texture
  Spongiform18 (9)0 (0)0Chi-square P = 0.0376
  Mixed90 (45)10 (5)10
  Solid66 (33)16 (8)19.51
Echogenicity
  Hyperechoic2 (1)0 (0)0Chi-square P = 0.5827
  Hypoechoic172 (86)26 (13)13.13
Echogenic foci
  None or comet tail140 (70)16 (8)10.26Chi-square P = 0.0109
  Macro8 (4)0 (0)0
  Peripheral2 (1)2 (1)50
  Punctate24 (12)8 (4)25
Orientation
  Wide168 (84)26 (13)13.4Chi-square P = 0.3364
Two-sided probability P ≤ 1.000
  Tall6 (3)0 (0)0
Peripheral halo
  Absent170 (65)22 (11)11.5Chi-square P < 0.0015
Two-sided probability P ≤ 0.0111
  Present4 (2)4 (2)50


Table 2. Relation Between Pathological Type and the Classification Systems
 
Benign, n (%)Malignant, n (%)Risk of malignancy (%)Test of significance
ACR-TIRADS: American College of Radiology Thyroid Imaging Reporting and Data System; ATA: American Thyroid Association; EU-TIRADS: European Thyroid Imaging and Reporting Data System; KSThR: Korean Society of Thyroid Radiology; K-TIRADS: Kwak-TIRADS.
ACR-TIRADS
  TR 2 - Non-suspicious14 (7)0 (0)0Chi-square P = 0.0001
  TR 3 - Mildly suspicious62 (31)2 (1)3.1
  TR 4 - moderately suspicious84 (42)14 (7)14.3
  TR 5 - Highly suspicious14 (7)10 (5)41.7
ATA
  TR 2 - Very low54 (27)0 (0)0Chi-square P = 0.0001
  TR 3 - Low52 (26)2 (1)3.7
  TR 4 - Intermediate40 (20)6 (3)13.0
  TR 5 - High28 (14)18 (9)39.1
EU-TIRADS
  Benign14 (7)0 (0)0Chi-square P = 0.0001
  Low2 (1)0 (0)0
  Intermediate120 (60)8 (4)6.3
  High38 (19)18 (9)32.1
K-TIRADS
  3 - Probably benign14 (7)0 (0)0Chi-square P = 0.0001
  4a - Low suspicion68 (34)2 (1)2.9
  4b - Intermediate suspicion82 (41)12 (6)12.8
  4c - Moderate suspicion10 (5)12 (6)54.5
KSThR
  TR 2 - Very low14 (7)0 (0)0Chi-square P = 0.0001
  TR 3 - Low2 (1)0 (0)0
  TR 4 - Intermediate130 (65)12 (6)8.5
  TR 5 - High28 (14)14 (7)33.3
Total174 (87)26 (13)


Table 3. Diagnostic Comparison of the Five Classification Systems
 
Sensitivity, % (95% confidence limit)Specificity, % (95% confidence limit)PPV, % (95% confidence limit)NPV, % (95% confidence limit)Area under curve (ROC) (95% confidence limit)False negative, N (%)Unnecessary FNA rate, N (%)
ACR-TIRADS: American College of Radiology Thyroid Imaging Reporting and Data System; ATA: American Thyroid Association; EU-TIRADS: European Thyroid Imaging and Reporting Data System; KSThR: Korean Society of Thyroid Radiology; K-TIRADS: Kwak-TIRADS; PPV: positive predictive value; NPV: negative predictive value; ROC: receiver operating curves; FNA: fine-needle aspiration.
ACR-TIRADS92.31 (75 - 99)40.23 (32 - 47)18.75 (0.12 - 0.26)97.22 (0.90 - 0.99)0.6627 (0.59 - 0.72)2 (1)104 (52) (P = 0.0013)
K-TIRADS96.15 (80 - 99)8.05 (4 - 13)13.51 (0.08 - 0.19)93.33 (0.68 - 0.99)0.5210 (0.47 - 0.56)1 (0.5)160 (80) (P = 0.4482)
KSThR84.62 (65 - 95)13.79 (9 - 19)12.79 (0.08 - 0.18)85.71 (0.67 - 0.95)0.5080 (0.43 - 0.58)4 (2)150 (75) (P = 0.8273)
EU-TIRADS76.92 (56 - 91)36.78 (29 - 44)15.38 (0.09 - 0.22)91.43 (0.82 - 0.96)0.5685 (0.47 - 0.65)6 (3)110 (55) (P = 0.1718)
ATA92.31 (74 - 99)34.48 (27 - 42)17.39 (0.11 - 0.24)96.77 (0.89 - 0.99)0.6340 (0.57 - 0.69)2 (1)114 (57) (P = 0.0059)


Table 4. Size Criteria for Nodule Biopsy
 
SuspiciousLow riskHigh risk
ACR-TIRADS: American College of Radiology Thyroid Imaging Reporting and Data System; ATA: American Thyroid Association; EU-TIRADS: European Thyroid Imaging and Reporting Data System; KSThR: Korean Society of Thyroid Radiology; K-TIRADS: Kwak-TIRADS.
ACR-TIRADS1 cm2.5 cm
EU-TIRADS1 cm2 cm
KSThR1 cm1.5 cm
K-TIRADS1 cm2 cm0.5 cm
ATA1 cm2 cm0.5 cm