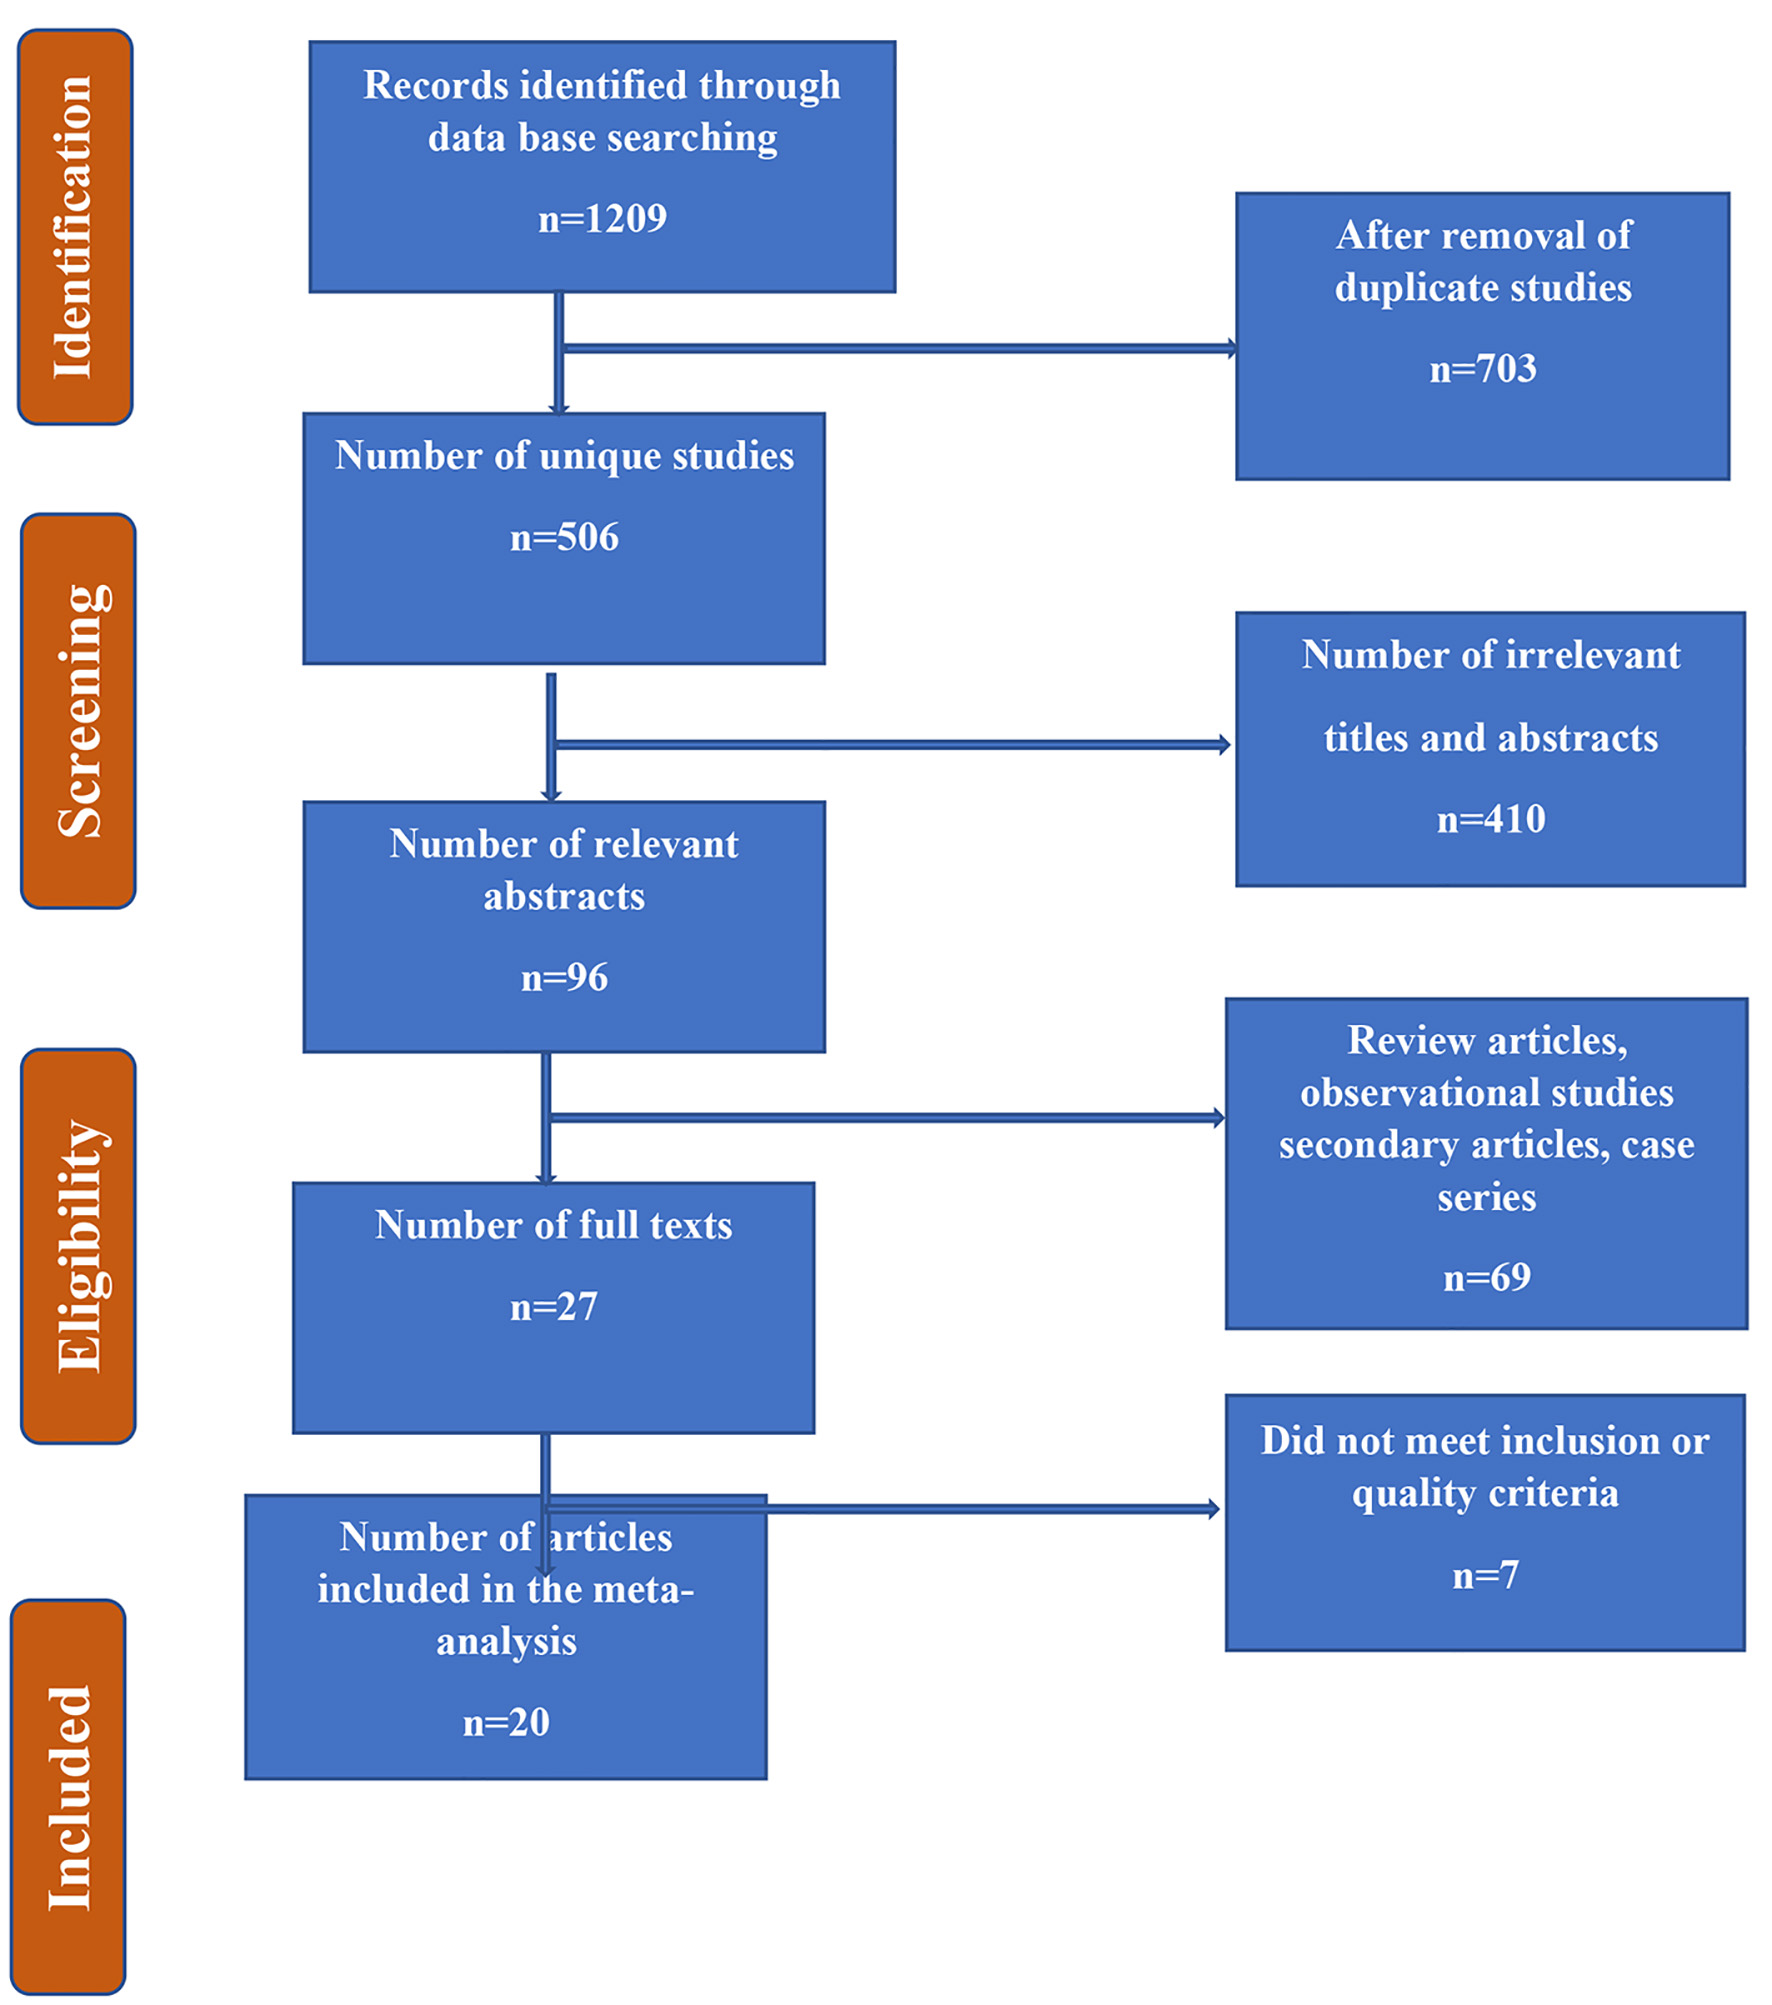
Figure 1. Flow chart summarizing the identification and selection of papers for systematic review.
| Journal of Endocrinology and Metabolism, ISSN 1923-2861 print, 1923-287X online, Open Access |
| Article copyright, the authors; Journal compilation copyright, J Endocrinol Metab and Elmer Press Inc |
| Journal website https://www.jofem.org |
Review
Volume 11, Number 5, October 2021, pages 95-107
Efficacy of Glucagon-Like Peptide-1 Receptor Agonists in the Weight Loss Among Obese Individuals: A Systematic Review
Figure
Tables
| Section and topic | Checklist item | Location where item is reported |
|---|---|---|
| Title | Identify the report as a systematic review. | Abstract, Introduction and Methods |
| Abstract | See the PRISMA 2020 for Abstracts checklist. | Seen and followed this guideline. |
| Rationale | Describe the rationale for the review in the context of existing knowledge. | Rationale is described. |
| Objectives | Provide an explicit statement of the objective(s) or question(s) the review addresses. | Objectives are described. |
| Eligibility criteria | Specify the inclusion and exclusion criteria for the review and how studies were grouped for the syntheses. | All required details are in Methods section. |
| Information sources | Specify all databases, registers, websites, organisations, reference lists and other sources searched or consulted to identify studies. Specify the date when each source was last searched or consulted. | Databases are specified in Methods section. |
| Search strategy | Present the full search strategies for all databases, registers and websites, including any filters and limits used. | A full table of search strategy is made and details are in Methods section. |
| Selection process | Specify the methods used to decide whether a study met the inclusion criteria of the review, including how many reviewers screened each record and each report retrieved, whether they worked independently, and if applicable, details of automation tools used in the process. | All required details are in Methods section. |
| Data collection process | Specify the methods used to collect data from reports, including how many reviewers collected data from each report, whether they worked independently, any processes for obtaining or confirming data from study investigators, and if applicable, details of automation tools used in the process. | All required details are in Methods section. |
| Data items | List and define all outcomes for which data were sought. Specify whether all results that were compatible with each outcome domain in each study were sought (e.g. for all measures, time points, analyses), and if not, the methods used to decide which results to collect. | All required details are in Methods section. |
| List and define all other variables for which data were sought (e.g. participant and intervention characteristics, funding sources). Describe any assumptions made about any missing or unclear information. | These are listed in Methods as well as Tables. | |
| Effect measures | Specify for each outcome the effect measure(s) (e.g., risk ratio, mean difference) used in the synthesis or presentation of results. | It is specified in Tables. |
| Synthesis methods | Describe the processes used to decide which studies were eligible for each synthesis (e.g., tabulating the study intervention characteristics and comparing against the planned groups for each synthesis (item #5)). | Flow chart is made with details in Methods. |
| Describe any methods required to prepare the data for presentation or synthesis, such as handling of missing summary statistics, or data conversions. | NA | |
| Describe any methods used to tabulate or visually display results of individual studies and syntheses. | See the flow chart and Tables. | |
| Describe any methods used to synthesize results and provide a rationale for the choice(s). If meta-analysis was performed, describe the model(s), method(s) to identify the presence and extent of statistical heterogeneity, and software package(s) used. | Since it was not a meta-analysis, we performed qualitative review. | |
| Describe any methods used to explore possible causes of heterogeneity among study results (e.g. subgroup analysis, meta-regression). | NA | |
| Describe any sensitivity analyses conducted to assess robustness of the synthesized results. | NA | |
| Reporting bias assessment | Describe any methods used to assess risk of bias due to missing results in a synthesis (arising from reporting biases). | NA |
| Certainty assessment | Describe any methods used to assess certainty (or confidence) in the body of evidence for an outcome. | NA |
| Quality assessment | Quality assessment of eligible studies was done | Done using appropriate tools |
| Study selection | Describe the results of the search and selection process, from the number of records identified in the search to the number of studies included in the review, ideally using a flow diagram. | Flow chart and details are in Methods. |
| Cite studies that might appear to meet the inclusion criteria, but which were excluded, and explain why they were excluded. | Flow chart and details are in Methods. | |
| Study characteristics | Cite each included study and present its characteristics. | Description is given in Tables and results section. |
| Results of individual studies | For all outcomes, present, for each study: 1) summary statistics for each group (where appropriate) and 2) an effect estimate and its precision (e.g., confidence/credible interval), ideally using structured tables or plots. | Description is given in Tables and results section. |
| Discussion | Provide a general interpretation of the results in the context of other evidence. | Done |
| Discuss any limitations of the evidence included in the review. | Done | |
| Discuss any limitations of the review processes used. | Done | |
| Discuss implications of the results for practice, policy, and future research. | Done |
| Population | “Adults*” [Mesh] OR “women*adults*” OR obese*men or women OR type-2 diabetes mellitus* OR overweight* OR “diabetic*” OR “adults with type-2 diabetes mellitus” OR “obese adults” OR “diabetic women” “diabetic men” OR “obese women” “obese men” [Mesh] |
| Intervention | “GLP-1Ras” OR “Glucagon-like peptide-1 receptor agonists (GLP-1Ras)” OR “Liraglutide” [MeSH Terms] OR “Exenatide” [MeSH Terms] OR Semaglutide [MeSH Terms] OR Dulaglutide [MeSH Terms] OR Exenatide plus changes in the lifestyle [MeSH Terms] OR Dulaglutide plus changes in the lifestyle [MeSH Terms] OR Liraglutide plus changes in the lifestyle [MeSH Terms] OR Semaglutide plus changes in the lifestyle [MeSH Terms] OR Dulaglutide plus changes in life style [MeSH Terms] |
| Comparison | Adults who were either not randomized to glucagon-like peptide-1 receptor agonists in RCTs or who were not observed to take glucagon-like peptide-1 receptor agonists in observational studies. |
| Outcome | “Obesity management”, OR “weight loss”, OR “reduction in weight” OR “improving weight” OR “reduction in body mass index” OR “reduction in body fat” OR “weight management” |
| Study name | Year | Country | Study design | Sample size | Group 1 | Group 2 | Group 3 | Age (years) | BMI (kg/m2) |
|---|---|---|---|---|---|---|---|---|---|
| BMI: body mass index; RCT: randomized controlled trial; SGLT-2: sodium-glucose cotransporter-2; GLP-1: glucagon-like peptide-1. | |||||||||
| Rosenstock et al [13] | 2010 | USA | RCT | 152 | Exenatide | Placebo | NA | 46 ± 12 | 39.6 ± 7.0 |
| Apovian et al [14] | 2010 | USA | RCT | 194 | Exenatide plus changes in the lifestyle | Placebo plus changes in the lifestyle | NA | 54.8 ± 9.5 | 25 - 39.9 |
| Bergenstal et al [15] | 2010 | USA, India, and Mexico | RCT | 491, 170 each in three groups | Exenatide | Sitagliptin | Pioglitazone | ≥ 18 | 25 - 45 |
| Astrup et al [16] | 2012 | Europe | RCT | 564 | Liraglutide | Placebo | Orlistat | 18 - 65 | 30 - 40 |
| Chun-Jun Li et al [17] | 2014 | China | Prospective case series | 31 | Liraglutide | NA | NA | 48.5 ± 11.4 | 31.7 ± 3.6 |
| Perna et al [18] | 2016 | Italy | Retrospective case series | 9 | Liraglutide | NA | NA | 68.22 ± 3.86 | 32.34 ± 4.89 |
| Rondanelli et al [19] | 2016 | Italy | Cohort study | 28 | Liraglutide | NA | NA | 58.75 ± 9.33 | 34.13 ± 5.46 |
| Bradley et al [20] | 2012 | USA | Prospective case series | 18 | Exenatide | NA | NA | 39 ± 11 | 30 - 40 |
| Ishoy et al [21] | 2017 | Denmark | RCT | 40 | Exenatide | Placebo | NA | 19 - 65 | 39.5 ± 3.5 |
| Yin et al [22] | 2018 | China | RCT | 37 | Exenatide | Glargine | NA | 48.3 ± 2.3 | 28.1 ± 0.5 |
| Hong et al [23] | 2016 | Korea | Prospective case series | 32 | Exenatide | NA | NA | 49.0 ± 11.2 | 32.9 ± 4.7 |
| Semaglutide Blundell et al [24] | 2017 | UK | RCT | 30 | Semaglutide | Placebo | NA | 42 | 30 - 45 |
| Seko et al [25] | 2017 | Japan | Retrospective case series | 5 | Dulaglutide | NA | NA | 66.8 ± 2.7 | 28.2 ± 1.2 |
| Di Prospero et al [26] | 2021 | USA | RCT | 195 | NJ-64565111, a dual agonist of glucagon-like peptide-1 and glucagon receptors. Three groups were given different doses of NJ-64565111 | Placebo | NA | 18 - 70 | 35 - 50 |
| Kim et al [27] | 2021 | USA | RCT | 35 | Liraglutide (1.8 mg/day) | Placebo | NA | 40 - 70 | 27 - 40 |
| Frieling et al [28] | 2021 | USA | Retrospective cohort study | 73 | SGLT-2 inhibitors | GLP-1 receptor agonists | NA | 60 - 75 | 30 - 40 |
| Wilding et al [29] | 2021 | 16 countries of Asia, Europe, North America, and South America | RCT | 1,961 | 2.4 mg semaglutide administered subcutaneously | Placebo | NA | 18 years of age or older adults | > 27 |
| Davies et al [30] | 2021 | 12 countries of Asia, Europe, North and America, and South America, South Africa, and Middle East | RCT | 1,595 | 2.4 mg semaglutide administered subcutaneously | 1.0 mg semaglutide administered subcutaneously | Placebo | 18 years of age or older adults | > 27 |
| Wadden et al [31] | 2021 | 41 sites in the USA | RCT | 611 | 2.4 mg semaglutide administered subcutaneously | Placebo | NA | 46 ± 13 | 38.0 ± 6.7 |
| Rubino et al [32] | 2021 | 73 sites in 10 countries | RCT | 803 | 2.4 mg semaglutide administered subcutaneously | Placebo | NA | 46 ± 12 | 38.4 ± 6.9 |
| Study name | Year | Duration of treatment | Type of population | Main findings | Summary of findings |
|---|---|---|---|---|---|
| CI: confidence interval; T2DM: type 2 diabetic mellitus; NAFLD: non-alcoholic fatty liver disease; IQR: intraquartile range; SGLT-2: sodium-glucose cotransporter-2; GLP-1: glucagon-like peptide-1. | |||||
| Rosenstock et al [13] | 2010 | 24 weeks | Obese | Study participants in the intervention group lost 5.1 ± 0.5 kg from baseline as opposed to 1.6 ± 0.5 kg in the placebo group (P < 0.001). | Exenatide along with the changes in lifestyle resulted in a decrease in caloric intake, thereby leading to weight reduction and also resulted in improved tolerance to glucose |
| Apovian et al [14] | 2010 | 24 weeks | Obese and diabetic individuals | Exenatide along with the changes in lifestyle revealed a bigger difference in weight (-6.16 ± 0.54 kg as opposed to the placebo group 3.97 ± 0.52 kg (P = 0.003). | Exenatide along with the changes in lifestyle resulted in substantial loss of weight, helped to regulate glucose and resulted in reduced blood pressure as opposed to placebo plus changes in lifestyle. |
| Bergenstal et al [15] | 2010 | 26 weeks | Diabetic individuals | There was more weight reduction among study subjects who received exenatide (-2.3 kg, 95% CI: -2.9 to -1.7) vs. sitagliptin (-1.5 kg, 95% CI: -2.4 to -0.7, P = 0.0002) or pioglitazone (-5.1 kg, 95% CI: -5.9 to -4.3, P < 0.0001). | Exenatide resulted in more weight reduction than other medications without causing hypoglycemia. |
| Astrup et al [16] | 2012 | 20 weeks | Obese | There was 5.8 kg (95% CI: 3.7 - 8.0) more weight loss in the group 1 as opposed to placebo and there was 3.0 kg more weight loss than orlistat (P < 0.001). There was 20-week body fat reduced by 15.4 among those who took liraglutide and lean tissue by 2.0%. | Liraglutide was tolerated very well and there was sustainable weight loss over the period of 2 years and there was also improvement in the risk of cardiovascular diseases. |
| Chun-Jun Li et al [17] | 2014 | 12 weeks | Obese and diabetic individuals | Subjects treated with liraglutide resulted in a mean weight reduction of 5.03 kg and 61.3% of the patients had a reduction of more than 5% of body weight when contrasted to baseline. | The body weight, waist circumference, total fat, lean mass, and fat percentage were substantially decreased when compared to baseline. |
| Perna et al [18] | 2016 | 15 weeks | Obese and diabetic individuals | There was a reduction in the mean BMI (-0.78 kg/m2), weight (-2 kg), fat mass (-1.5 kg) and android fat (-0.9%) when compared to baseline. | Treatment with liraglutide led to a reduction in the mass of fat and android fat. |
| Rondanelli et al [19] | 2016 | 24 weeks | Obese and diabetic individuals | Significant reductions in BMI (-0.86 kg/m2, P = 0.024), fat mass (-2.01 kg, P = 0.015), fat mass index (-0.71 kg/m2, P = 0.014), android fat (-1.72%, P = 0.022), trunk fat (-1.52%, P = 0.016), and waist circumference (-6.86 cm, P < 0.001) were observed when compared to baseline. | Treatment with 24-week liraglutide caused decreased fat mass, android fat, trunk fat, and appetite by increasing the lipid profile, glucose control, and insulin sensitivity. |
| Bradley et al [20] | 2012 | 14 weeks | Obese individuals | The reduction in the mean weight due to exenatide was 2.0 ± 2.8 kg (P = 0.01). The average change in BMI was 0.7 ± 1.0 kg/m2 (P = 0.01). There was significant reduction in the fat mass by 1.3 ± 1.8 kg (P = 0.01) and fat-free mass was non-significantly reduced by 0.8 ± 2.2 kg (P = 0.14). | The variation in the composition of the body relates to an estimated change in body energy stores of 13 ± 28 kcal/day for fat-free mass lost along with 153 ± 205 kcal/day for fat mass lost. |
| Ishoy et al [21] | 2017 | 14 weeks | Obese individuals with schizophrenia | There was weight reduction both in intervention and control arms (P = 0.004), however, similar (P = 0.98) weight losses of 2.24 ± 3.3 and 2.23 ± 4.4 kg. | Treatment with exenatide once per week did not lead to weight reduction in obese, patients with schizophrenia who were on anit-psychotic medications as opposed to placebo. |
| Yin et al [22] | 2018 | 16 weeks | Obese and diabetic | Decreases in weight, BMI, body fat mass, and percent fat mass (except for gynoid) were greater with exenatide than with glargine, and percent lean tissue (other than the limbs) increased with exenatide. | Exenatide and glargine attained comparable increases in glycemic control, sensitivity to insulin, and function of β cells. Nevertheless, exenatide created better weight and fat mass decreases, which were beneficial for blood glucose control. |
| Hong et al [23] | 2016 | 12 weeks | Obese and diabetic | Body weight and fat mass declined substantially (P = 0.002 and P = 0.001, respectively), although muscle mass did not decline (P = 0.289). | Impacts of exenatide among obese individuals with comorbid such as cardiometabolic high-risk patients decreased body weight without muscle mass loss, body fat mass, and glycated hemoglobin levels. |
| Semaglutide Blundell et al [24] | 2017 | 12 weeks | Obese | Semaglutide led to a reduction from baseline in mean body weight of 5.0 kg, predominantly from body fat mass. | Libitum energy intake was significantly shorter with semaglutide vs. placebo with a corresponding loss of body weight observed with semaglutide. |
| Seko et al [25] | 2017 | 12 weeks | Diabetic | Not only body weight and hemoglobin A1c but also transaminase activities were significantly decreased after the 12-week therapy with dulaglutide. Total body fat mass and liver stiffness measurement also decreased after the treatment. | Dulaglutide, a new glucagon-like peptidase-1 receptor agonist, could be a novel promising agent for the treatment for NAFLD patients with T2DM due to its efficacy in body weight reduction, the nature of weekly injection, and patient preference. |
| Di Prospero et al [26] | 2021 | 12 weeks | Obese and diabetic individuals | There was a significant recution in body weight in a dose response manner. More precisely, changes in body weight were -4.6% with 5.0 mg of glucagon receptor agonisits, -5.9% with 7.4 mg, and -7.2% with 10.0 mg. There was more than 5% weight loss in the treatment arm than placebo. | Overall, glucagon receptor agonisits resulted in weight reduction in dose dependent manner when compared with placebo. However, there were more side effects reported with glucagon receptor agonisits as compared to placebo. These side effects included nausea and vomiting. |
| Kim et al [27] | 2021 | 14 weeks | Obese and pre-diabetic | Study subjects randomized to intervention arm were found to have a significant reduction in mean weight: -3.6% with 95% CI of -5.2% to -2.1%. | Liraglutide resulted in improved weight by the end of 14 weeks amon prediabetic individuals. |
| Frieling et al [28] | 2021 | 6 months | Diabetic and obese adult patients | There was a median loss of about -2.8 kg with an IQR of -5.40 to -1.50 among those patients who received SGLT-2 inhibitors, whereas those who received GLP-1 receptor agonisits lost about 1.15 kg with an IQR of -3.38 to 0.975 with a P-value of 0.014. | SGLT-2 inhibitors when used in combination with other antidiabetic medications can results in more weight loss than GLP-1 receptor agonisits. |
| Wilding et al [29] | 2021 | 68 weeks | Obese adults with at least one attempt of weight unsuccesful weight loss | A mean difference in BMI between intervention (semaglutide) and control arm was -12.4 percentage points (95% CI: -13.4 to -11.5 and P < 0.001). | There was sustained and clinically meaningful reduction in the body weight among those who were randomized to semaglutide than placebo group. |
| Davies et al [30] | 2021 | 68 weeks | Obese and diabetic adults | An estimated mean difference in BMI between intervention (semaglutide 2.4 mg) and placebo was -6.2 percentage points (95% CI: -7.3 to -5.2 and P < 0.001). | Semaglutide 2.4 mg given once a week showed superior findings interms on weight reduction than placebo. |
| Wadden et al [31] | 2021 | 68 weeks | Obese and overweight adults | The mean difference was -10.3 percentage points (95% CI: -12.0 to 8.6 and P < 0.001). | Semaglutide 2.4 mg given once a week along with behavioural therapy and low-calorie diet redulted in substantial weight loss than placebo group. |
| Rubino et al [32] | 2021 | 68 weeks | Obese and overweight adults | Mean change in body weight was -7.9% from baseline to follow-up in the intervention arm versus 6.9% in the placebo arm. The mean difference in the body weight between two groups was -14.8 with 95% CI of -16.0 to -13.50 (P < 0.001). | There was substantial weight loss in the group that received Semaglutide 2.4 mg than placebo. |