Figures
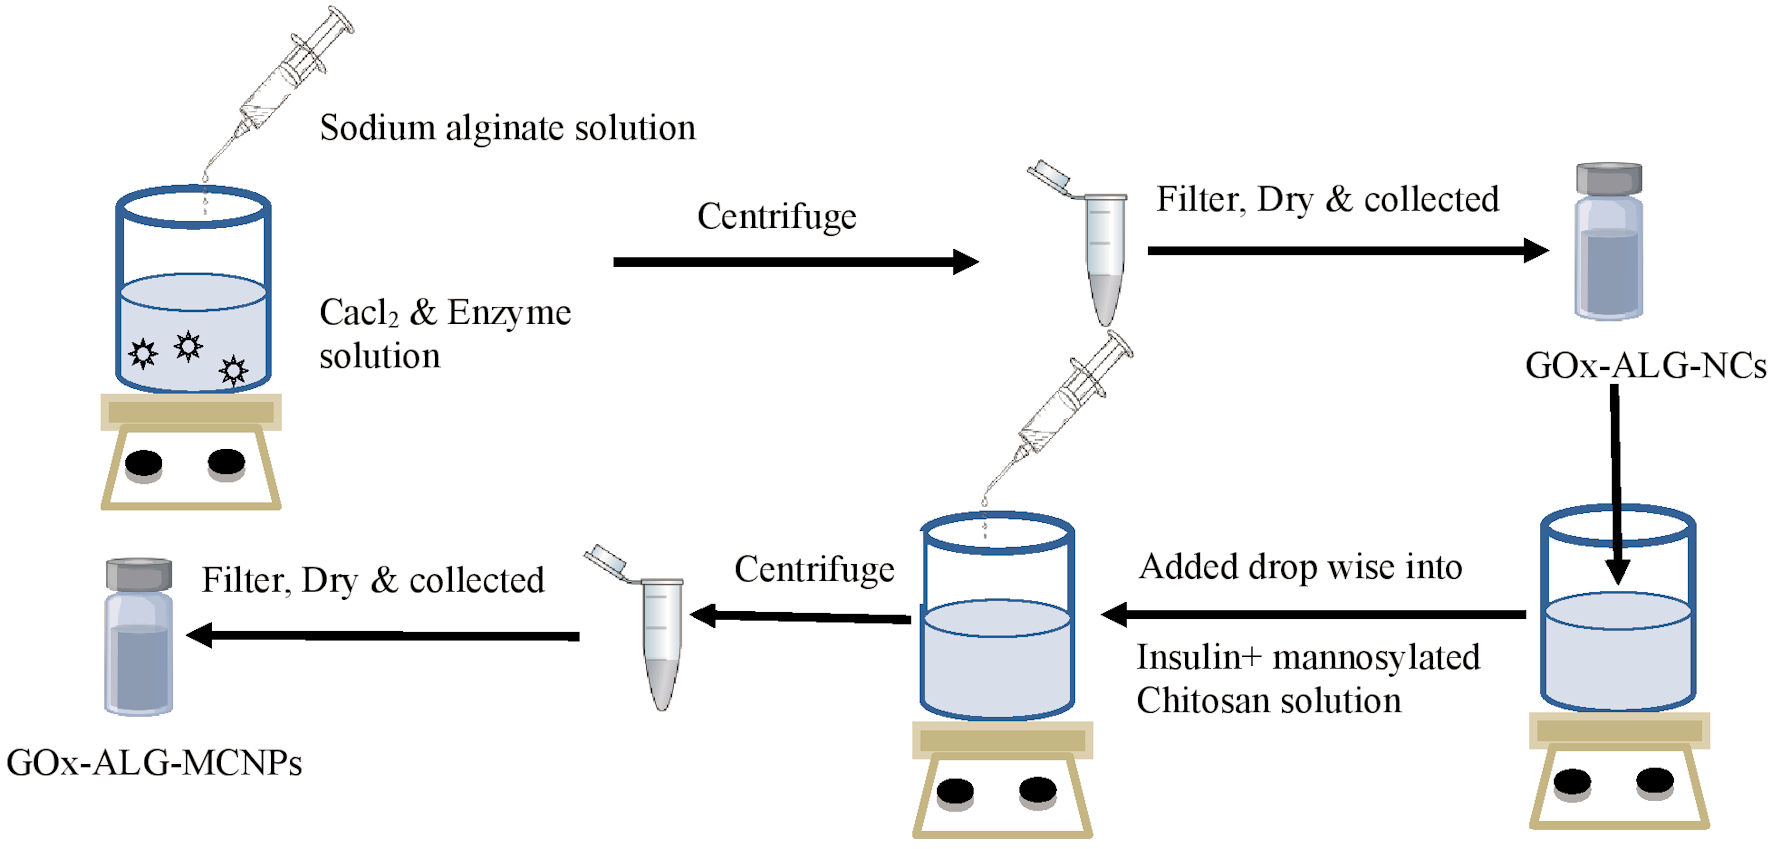
Figure 1. Schematic drawing of the preparation method. Gox-ALG-NCs: glucose oxidase-alginate nanocarriers.
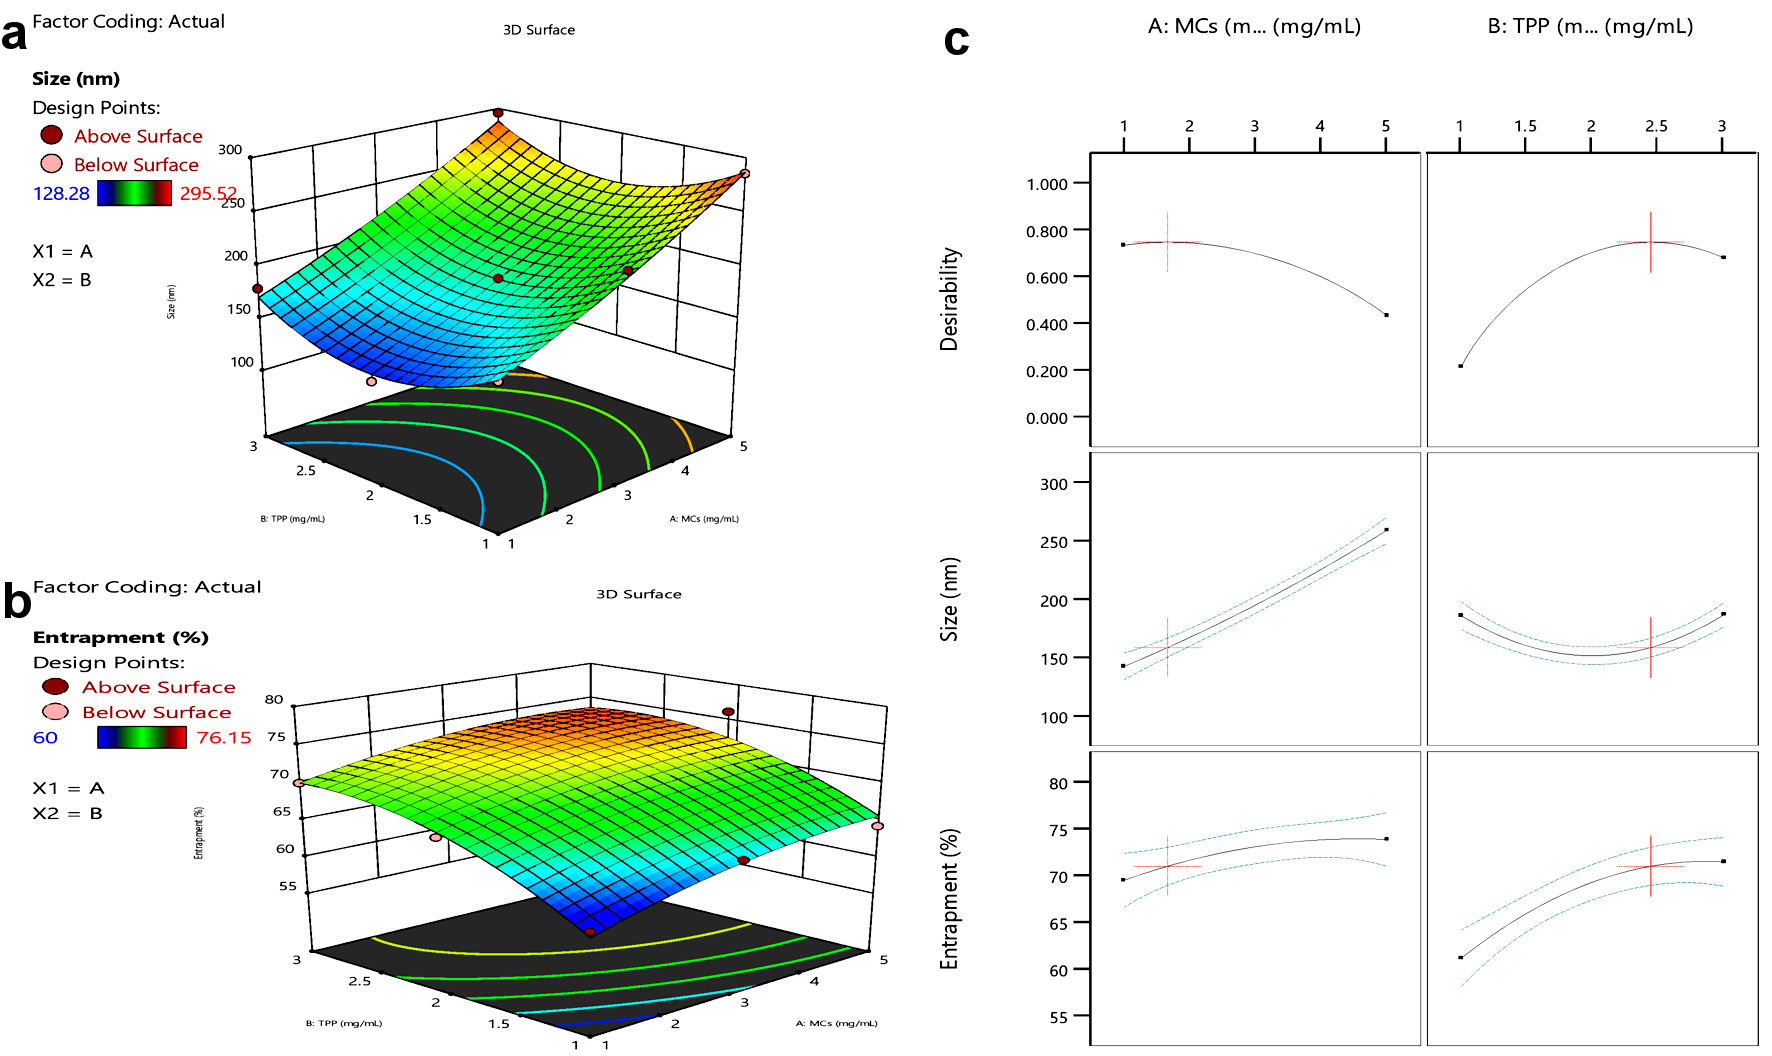
Figure 2. Response surface curve. (a) Size vs. MCs or TPP concentration. (b) Entrapment vs. MCs or TPP concentration. (c) Effect of MCs and TPP on size and entrapment of NPs. MCs: mannosylated chitosan; TPP: tripolyphosphate.
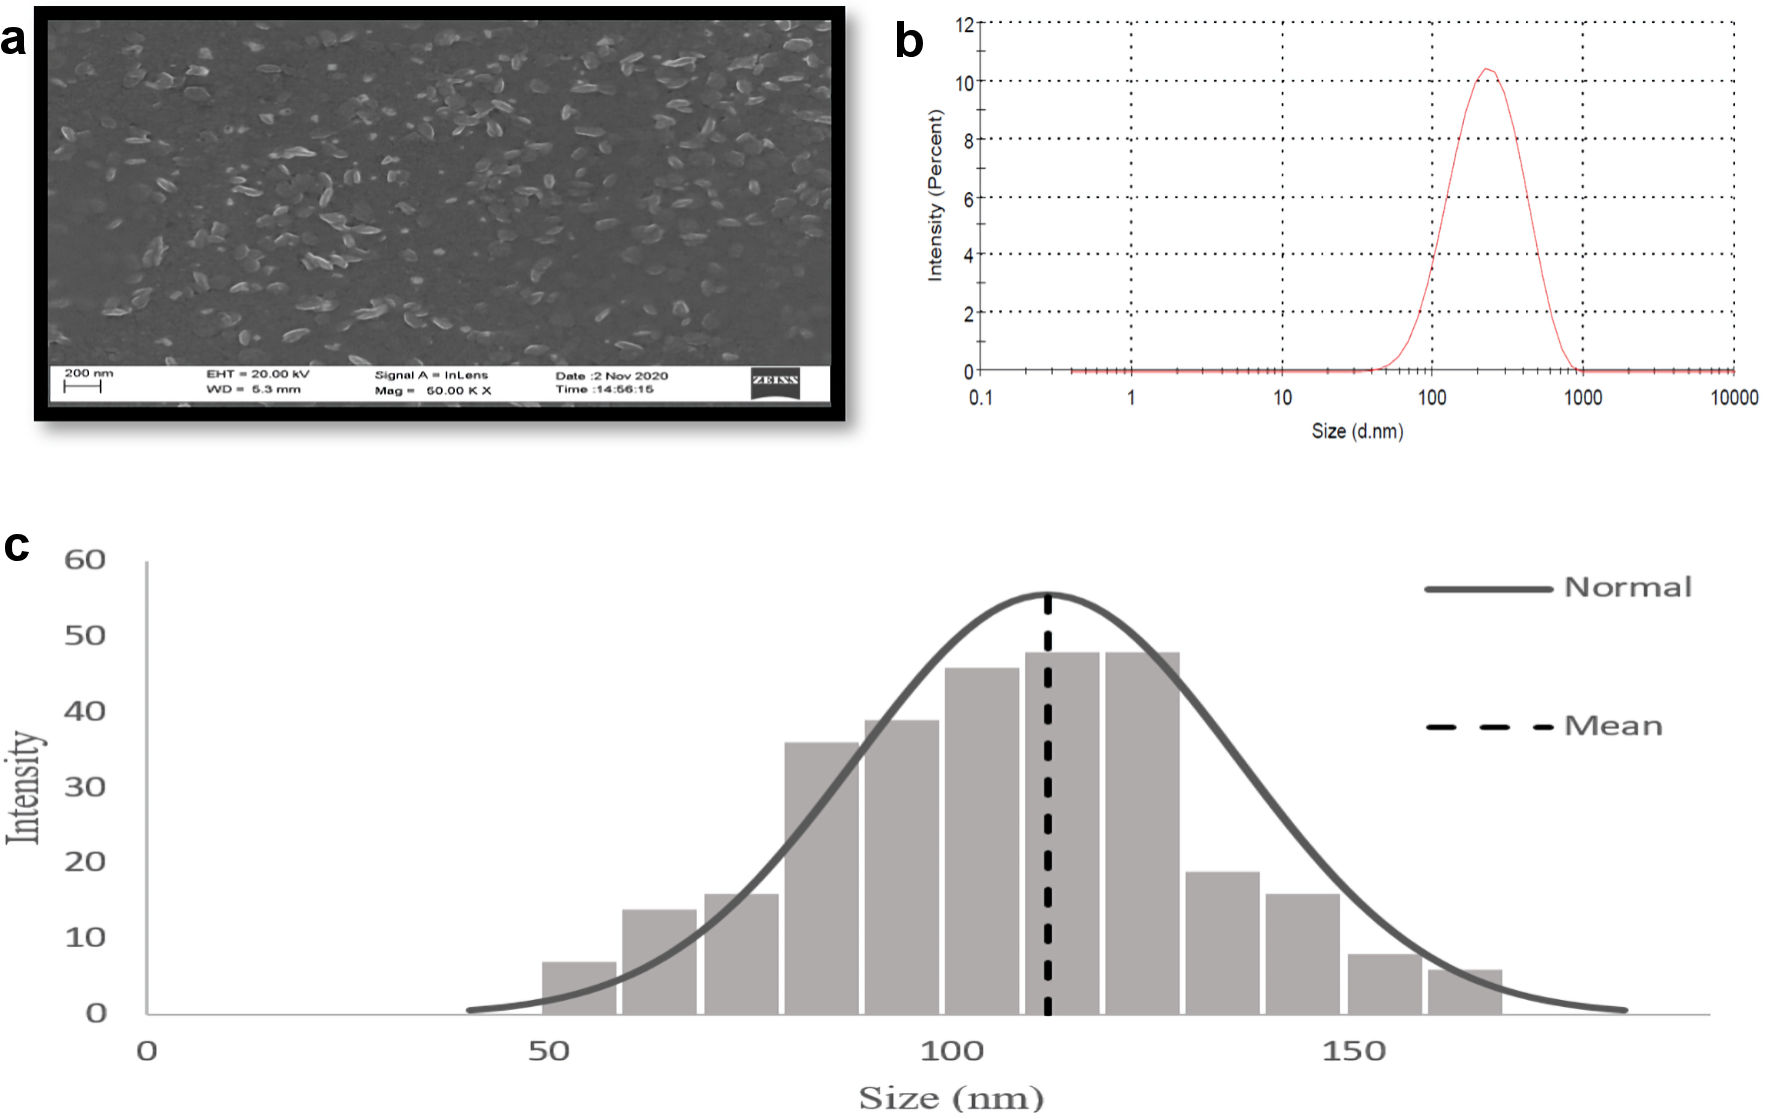
Figure 3. Characterization of GOx-ALG-MCNPs by DLS and SEM. (a) SEM image of GOx-ALG-MCNPs. (b, c) Size distribution study of GOx-ALG-MCNPs measured by DLS and SEM. GOx-ALG-MCNPs: insulin and GOx-ALG-NCs entrapped mannosylated chitosan nanoparticles.
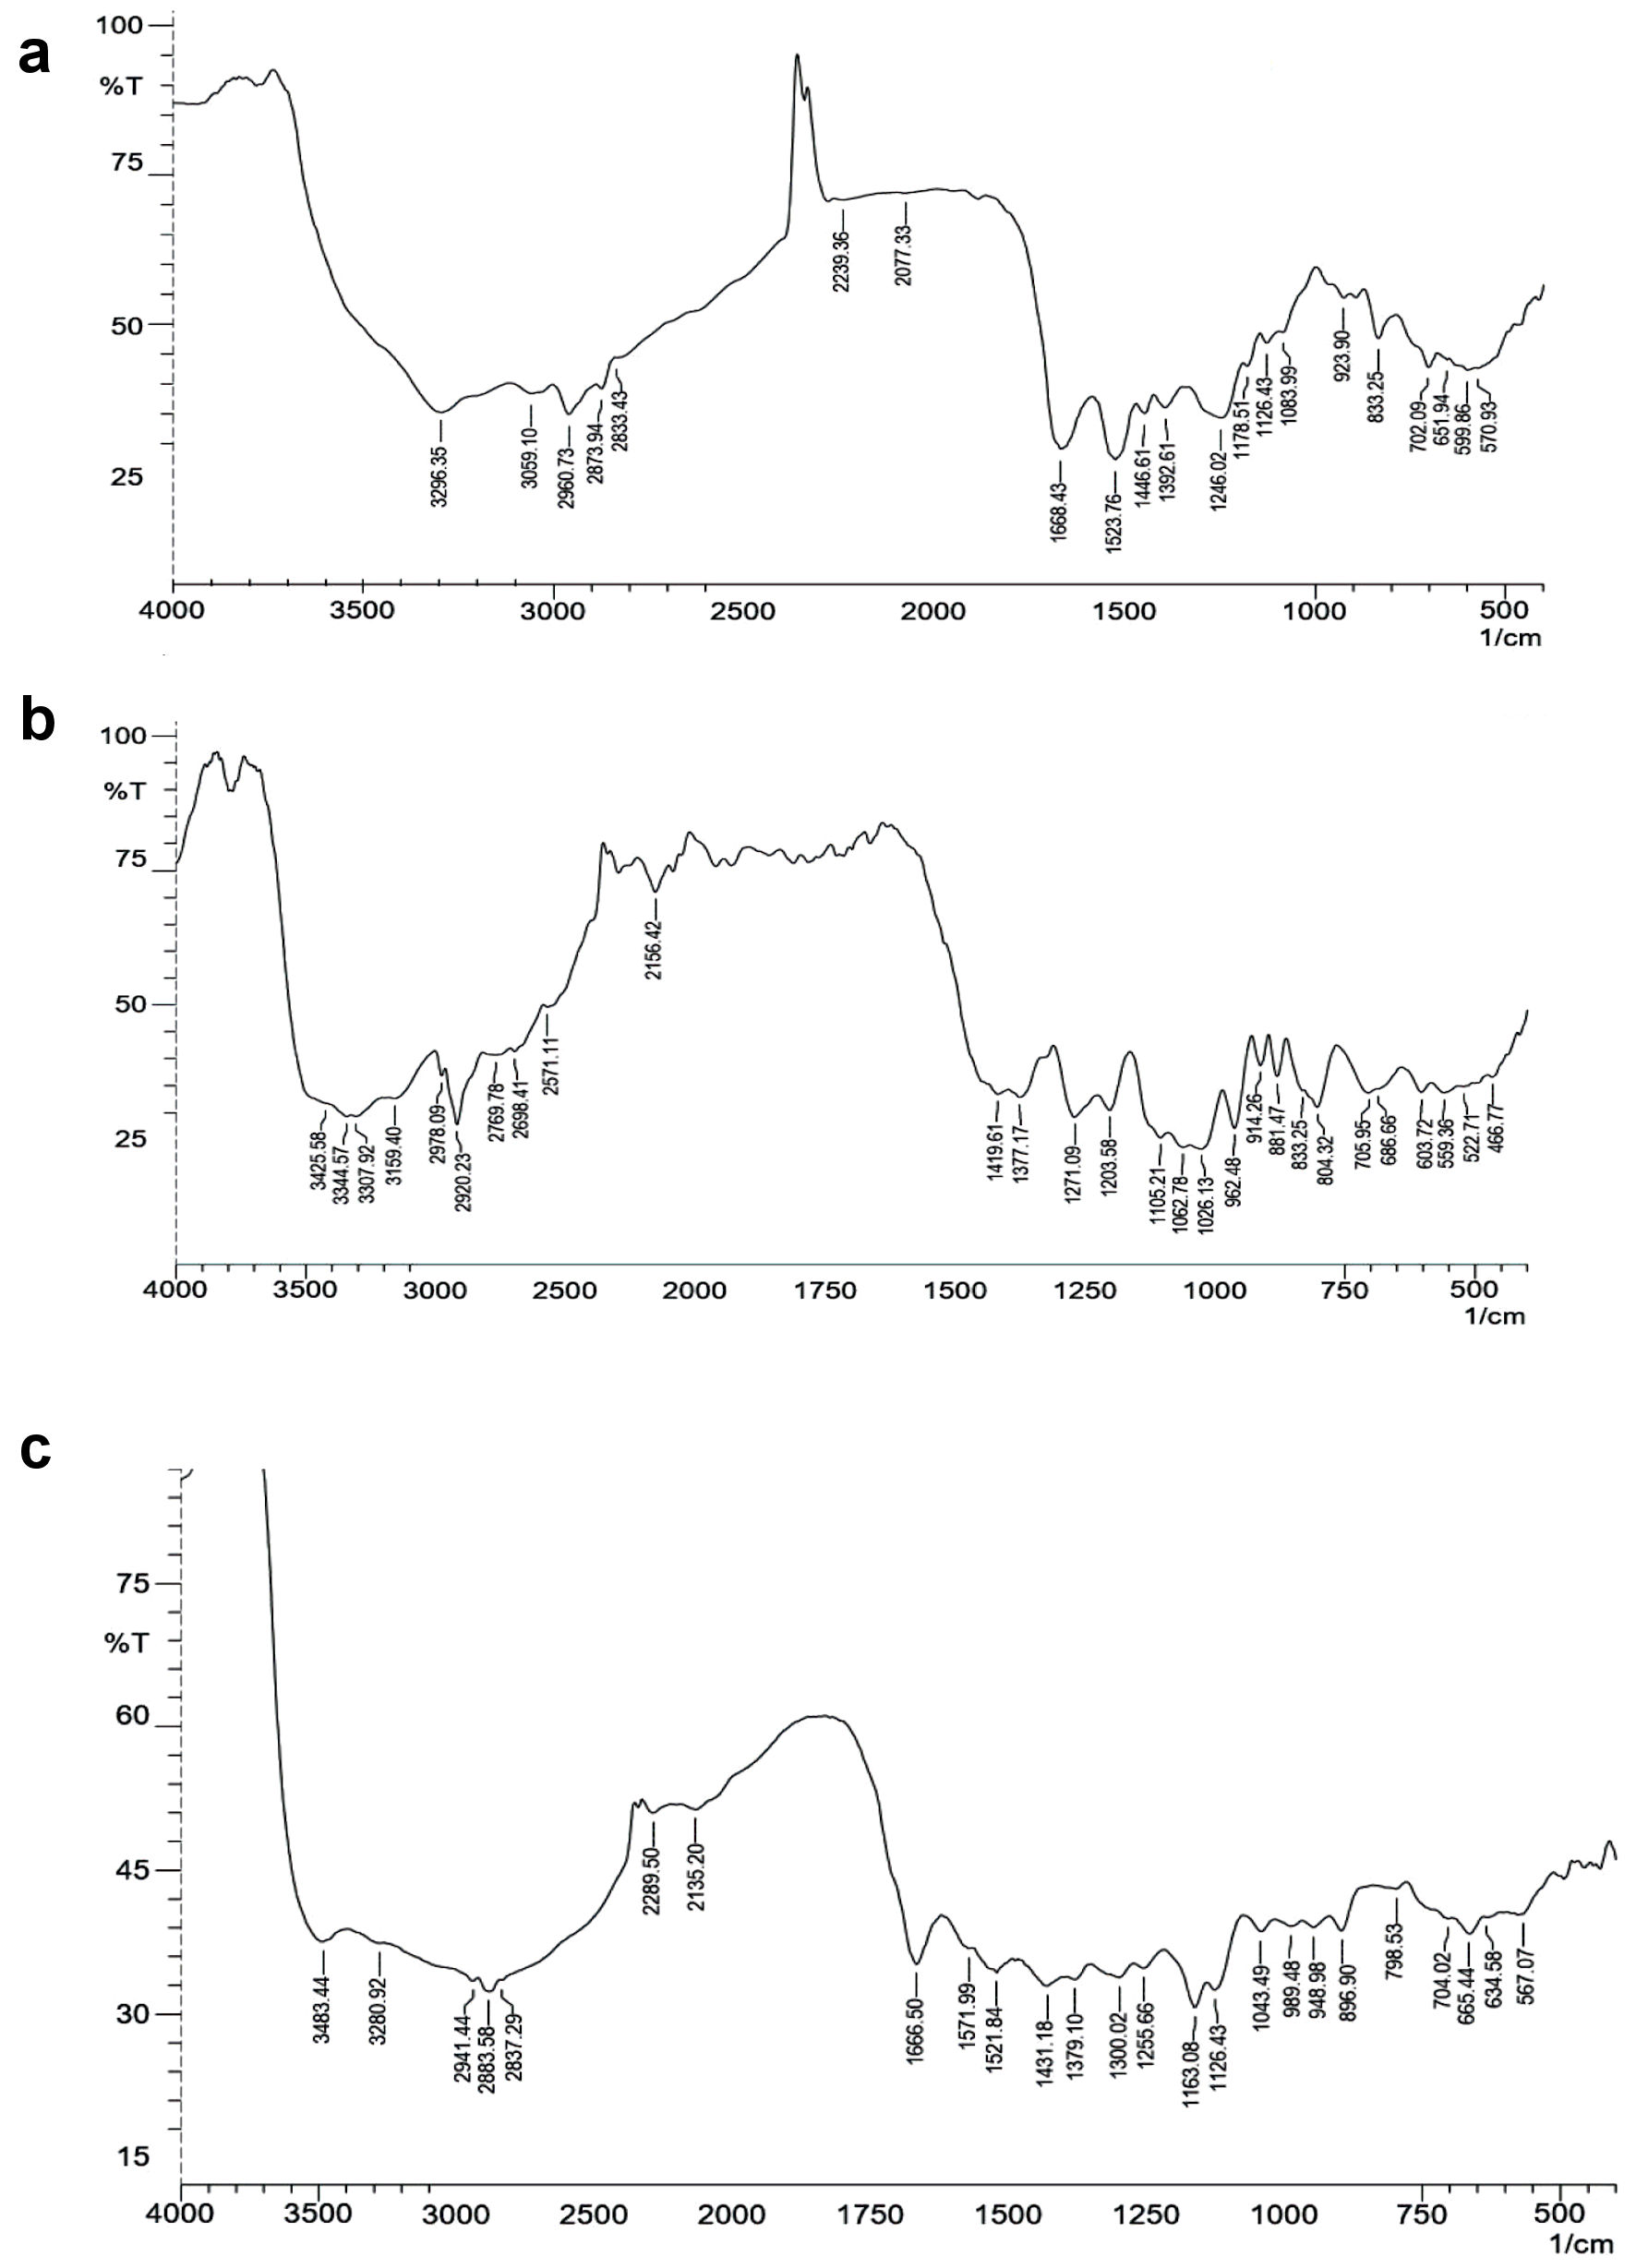
Figure 4. FT-IR spectrum. (a) Insulin. (b) Mannosylated chitosan nanoparticles (MCNPs). (c) Glucose oxidase-alginate-mannosylated chitosan nanoparticles (GOx-ALG-MCNPs). FT-IR: fourier transform infrared.

Figure 5. Enzyme activity of the free and entrapped enzyme. (a) Reactivity of different concentrations of free and entrapped enzyme (GOx-ALG-MCNPs) against the fixed concentration of glucose. (b) Effect of pH on % relative activity of the free and entrapped enzyme (GOx-ALG-MCNPs).
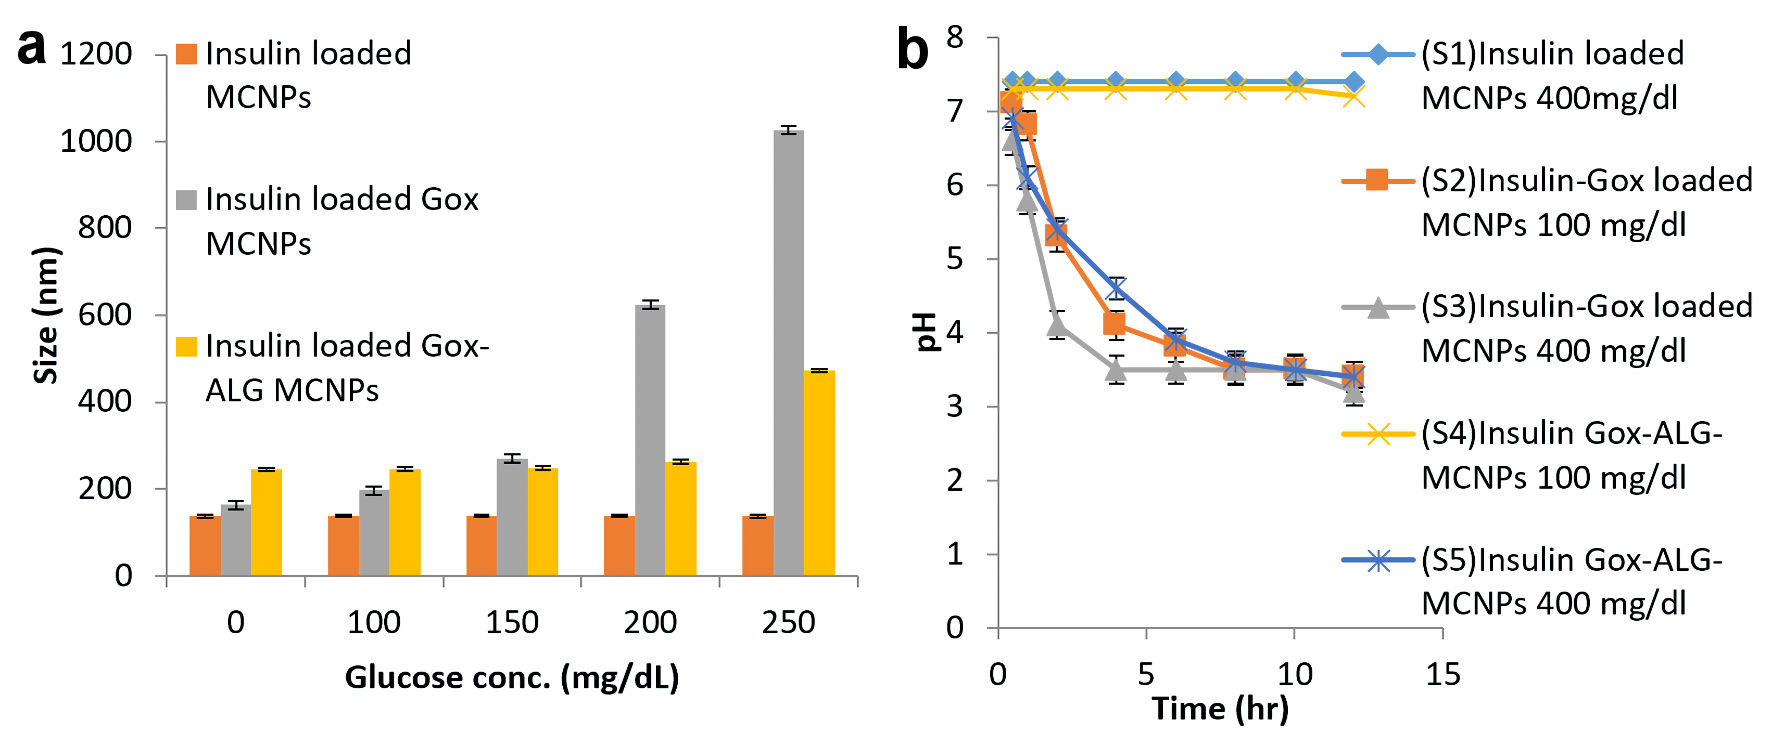
Figure 6. Glucose responsive effect. (a) Swelling or change in size. (b) Lowering of pH at different glucose concentration in different formulations: MCNPs, GOx-MCNPs, and GOx-ALG-MCNPs (mean ± SD, n = 3). SD: standard deviation.
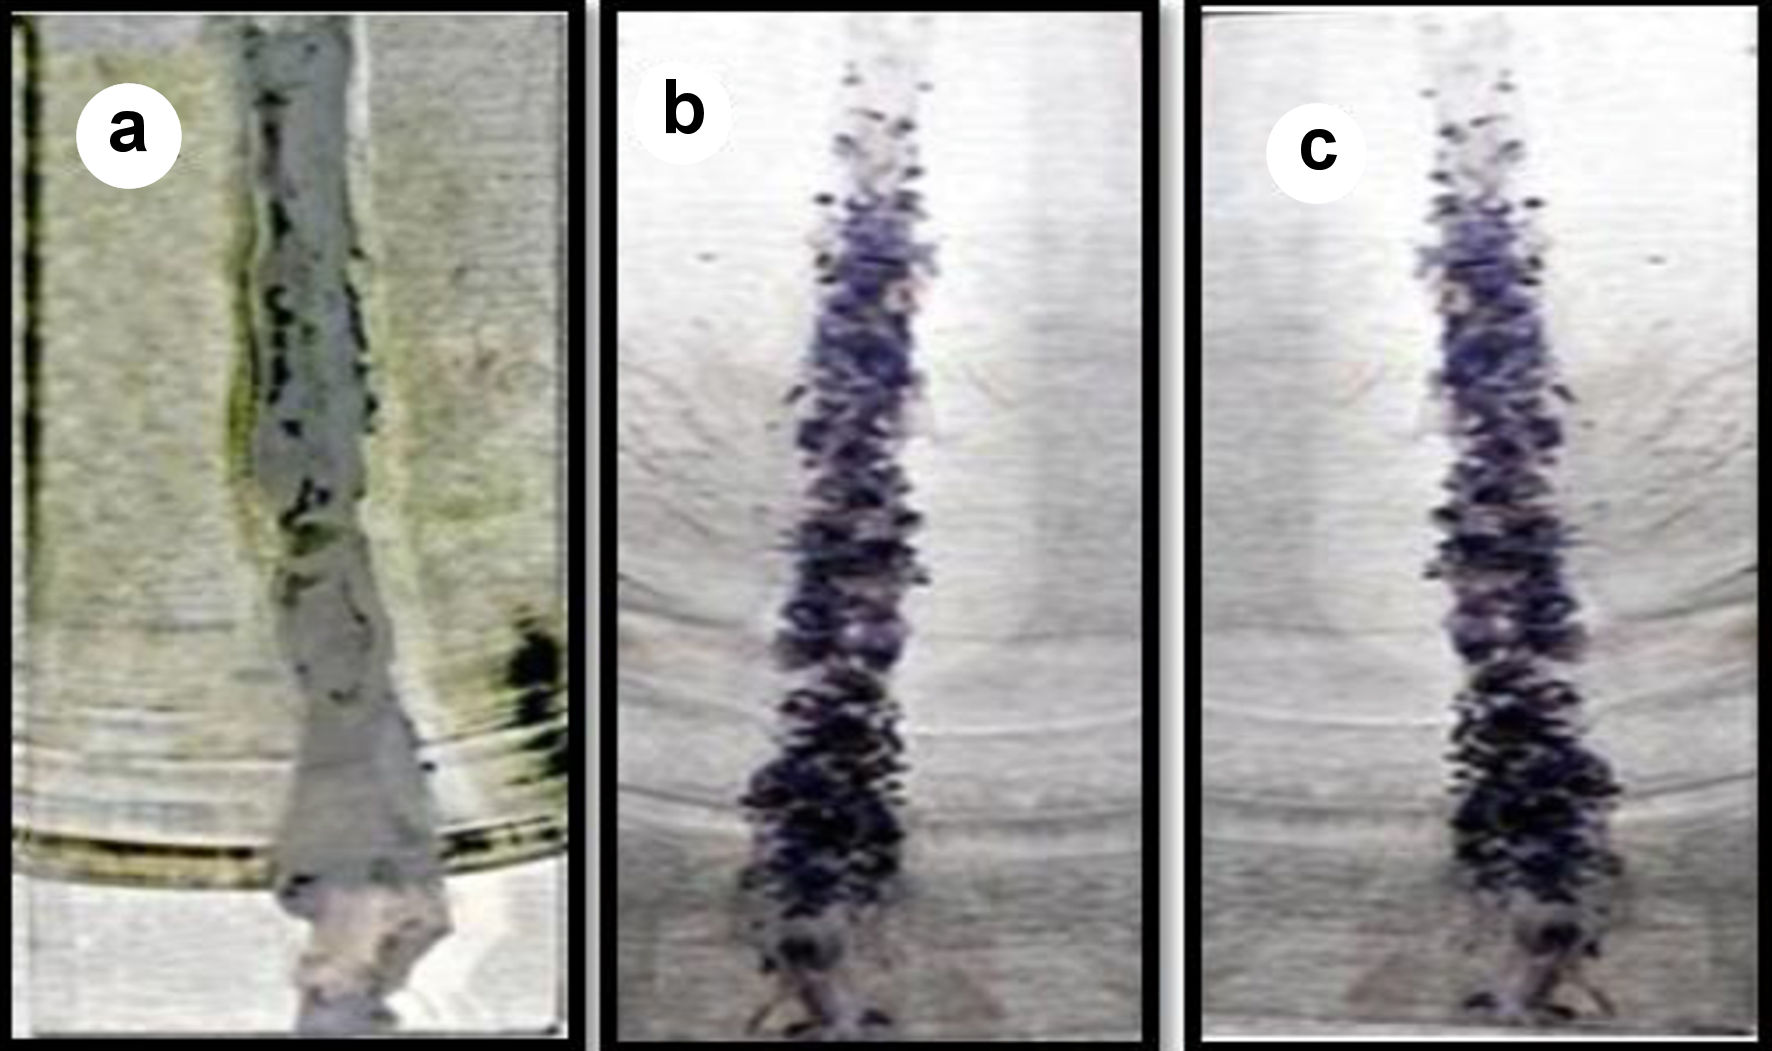
Figure 7. Mucoadhesion of GOx-ALG-MCNPs on the intestine. (a) Before sample application. (b) Sample applied. (c) After washing.
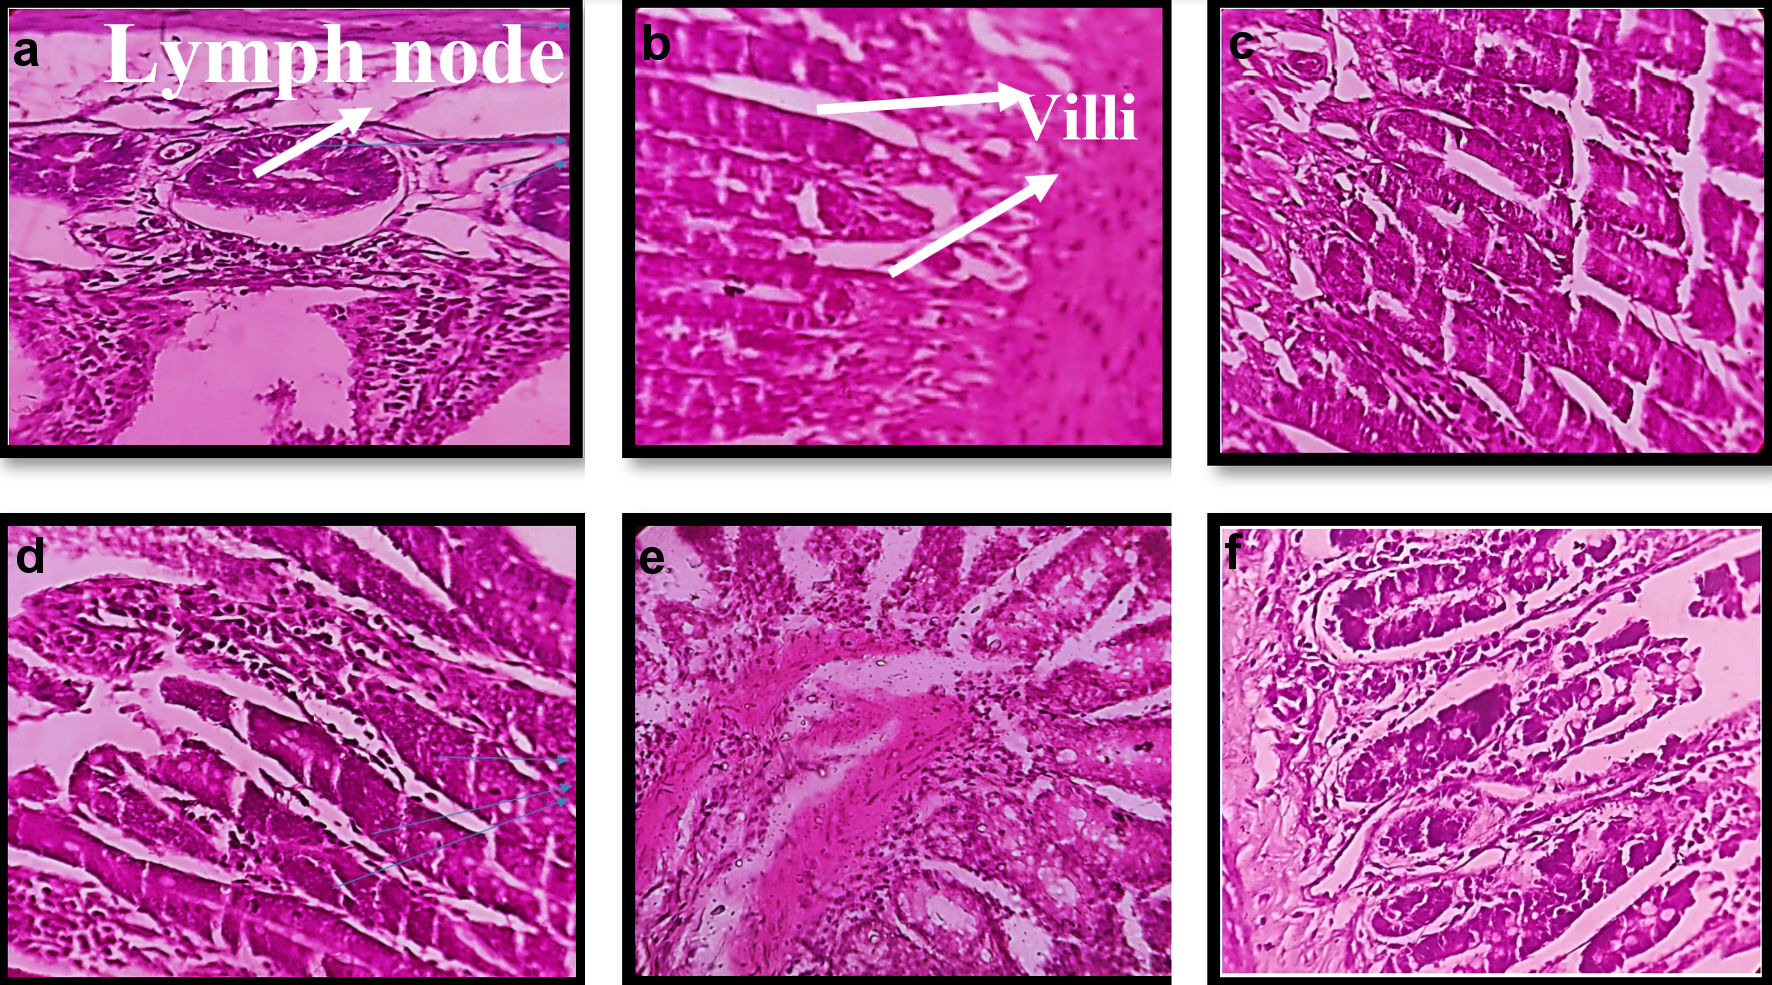
Figure 8. Morphological changes in histopathology of intestinal tissue of mice on treatment with different formulation. (a, b) Normal/control. (c) CNPs treated. (d) MCNPs treated. (e) GOx-MCNPs treated. (f) GOx-ALG-MCNPs treated.
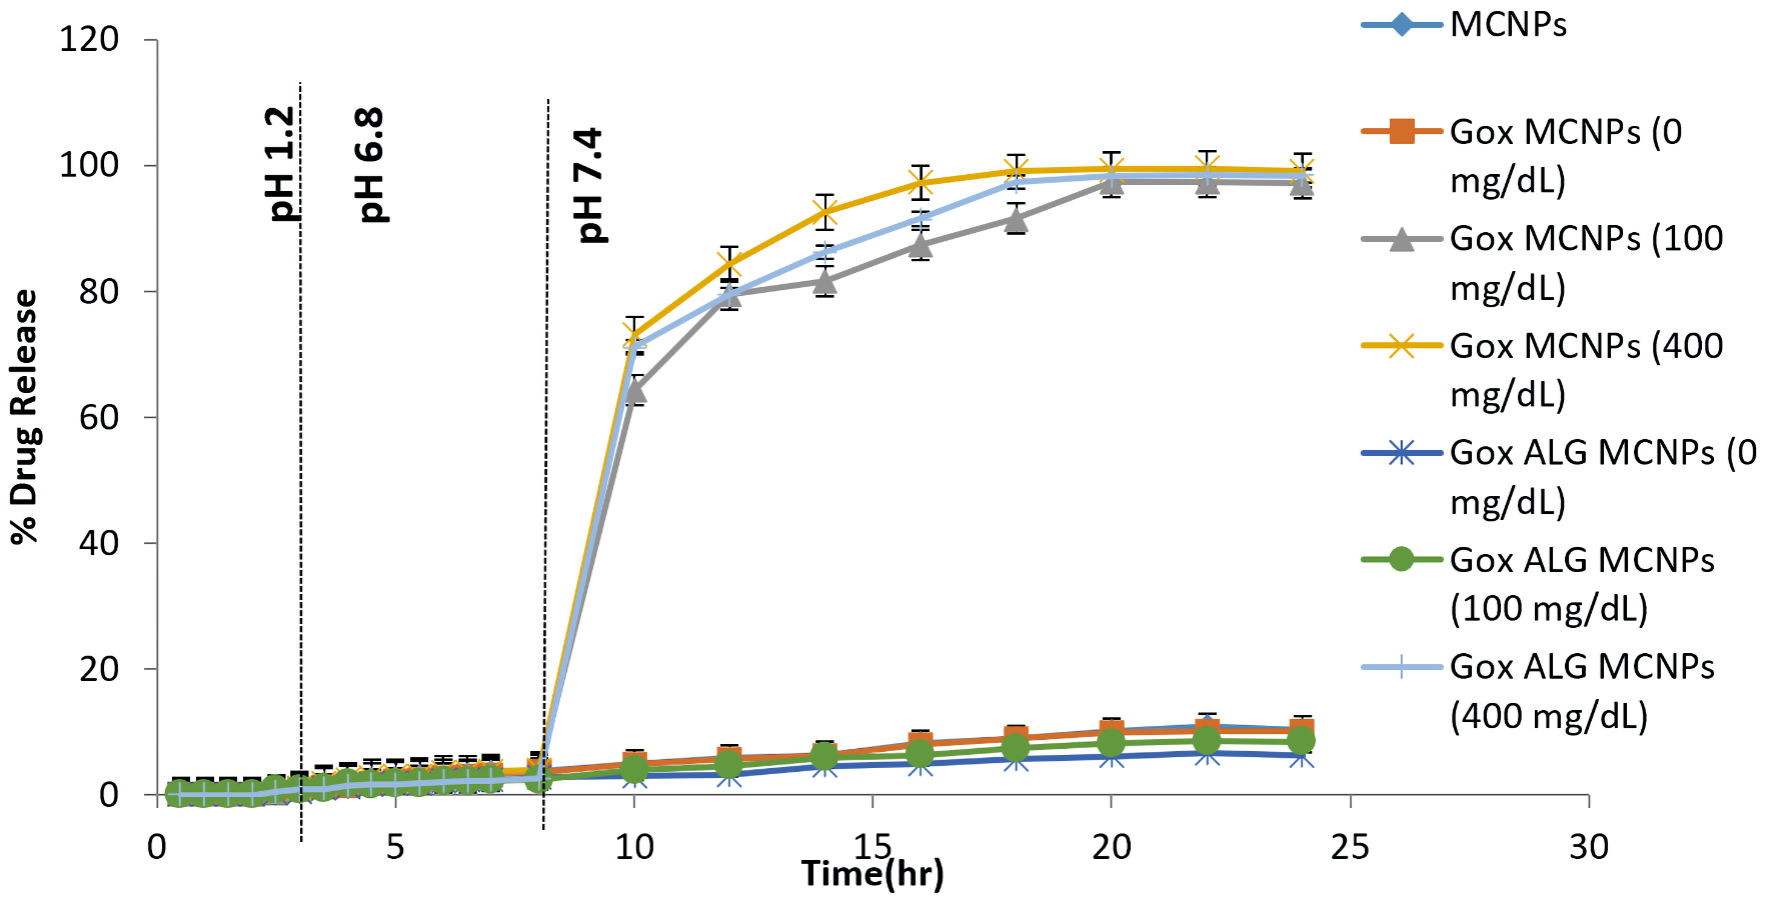
Figure 9. In vitro drug release study of different formulations (MCNPs, GOX-MCNPs, and GOx-ALG-MCNPs) in different glucose concentrations (0, 100 and 400 mg/dL) at different pH medium (1.2, 6.8 and 7.4), (mean ± SD, n = 3). SD: standard deviation.
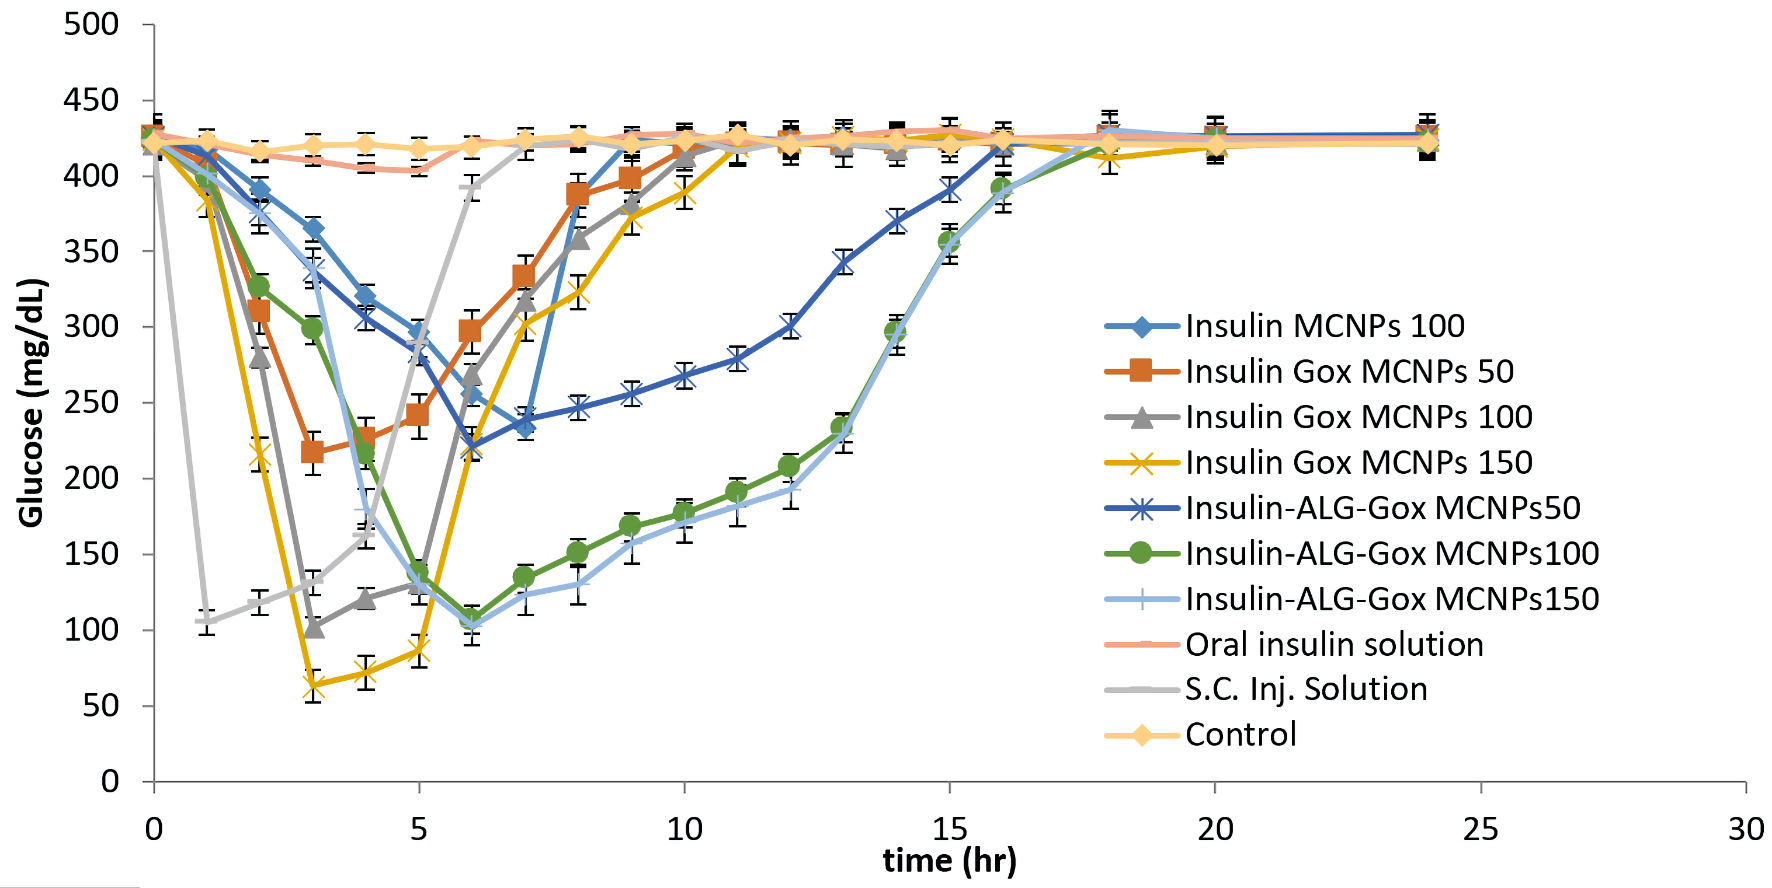
Figure 10. Investigation of the hypoglycemic effect of different oral formulations (MCNPs, GOx-MCNPs, GOx-ALG-MCNPs) and subcutaneous injection on streptozotocin-induced diabetes mice.
Tables
Table 1. Experimental Run and Response
| Run | Factor 1, A: MCs (mg/mL) | Factor 2, B: TPP (mg/mL) | Response 1, size (nm) | Response 2, entrapment (%) |
|---|
| 1 | 3 | 2 | 188.53 | 71.26 |
| 2 | 5 | 2 | 245.52 | 76.15 |
| 3 | 3 | 2 | 188.53 | 71.26 |
| 4 | 3 | 2 | 188.53 | 71.26 |
| 5 | 5 | 3 | 295.52 | 71.51 |
| 6 | 1 | 2 | 128.28 | 67 |
| 7 | 1 | 3 | 178.81 | 70 |
| 8 | 3 | 2 | 188.53 | 71.26 |
| 9 | 1 | 1 | 168.18 | 60 |
| 10 | 3 | 3.5 | 258.31 | 73 |
| 11 | 3 | 1 | 228.35 | 64.13 |
| 12 | 5 | 1 | 285.52 | 64.22 |
| 13 | 3 | 2 | 188.53 | 71.26 |
Table 2. Size, PDI, and Zeta Potential of Different Formulations
| Formulation | Size (nm) | PDI | Zeta potential (mv) | Entrapment efficiency (%) |
|---|
| Values are represented as mean ± SD (n = 3). |
| ALG-NCs | 97.23 ± 10.21 | 0.322 ± 0.013 | -6.66 ± 0.67 | - |
| GOx-ALG-NCs | 110 ± 11.33 | 0.361 ± 0.011 | -5.41 ± 0.47 | 88.37 ± 1.3 (GOx) |
| MCNPs | 108.32 ± 6.68 | 0.214 ± 0.012 | 26.5 ± 2.31 | - |
| Insulin-loaded MCNPs | 137.41 ± 8.12 | 0.312 ± 0.015 | 43.5 ± 3.17 | 81.13 ± 1.6 |
| Insulin-loaded GOx-MCNPs | 210.41 ± 8.61 | 0.261 ± 0.013 | 28.13 ± 2.31 | 78.15 ± 1.1 |
| Insulin-loaded GOx-ALG MCNPs | 245.52 ± 3.37 | 0.241 ± 0.009 | 22.12 ± 2.13 | 76.15 ± 1.8 |