Figures
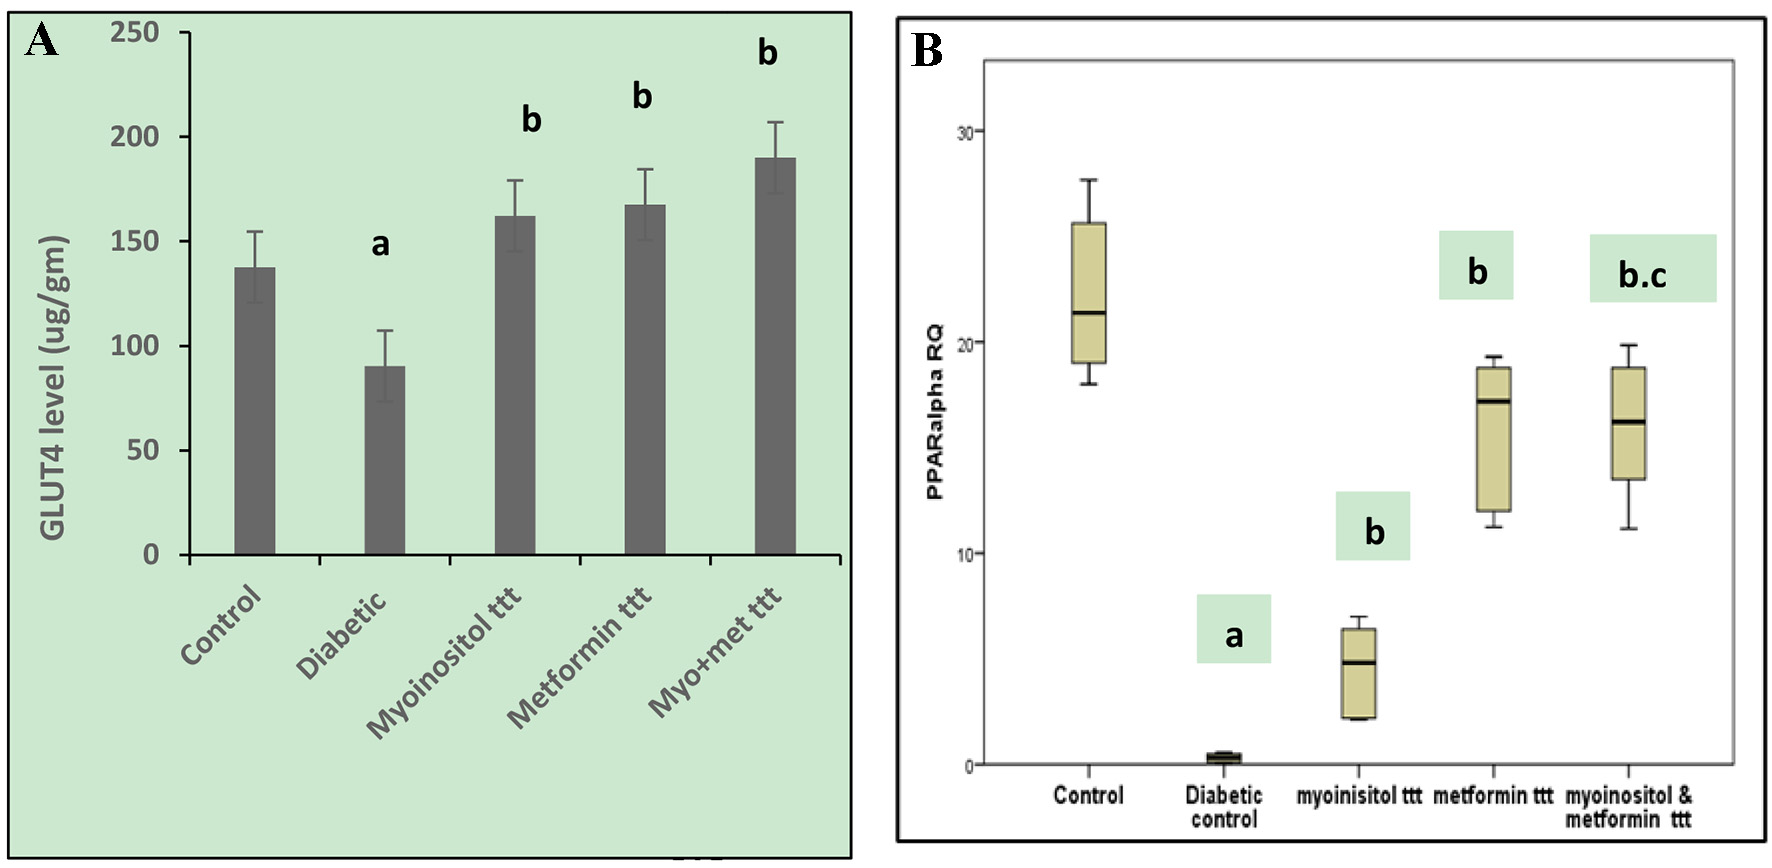
Figure 1. (A) Effect of tested drugs on GLUT-4 concentrations in skeletel muscle cells in HFD-fed STZ-induced diabetic rats. aP < 0.05, compared with normal control values. bP < 0.05, compared with diabetic control values. (B) Box plot showing the RQs of liver tissue PPARα gene mRNA in different groups of the study. The data represent the median fold changes. aP < 0.05, compared with normal control values. bP < 0.05, compared with diabetic control values. cP < 0.05, compared with myoinositol ttt value. GLUT-4: glucose transporter 4; HFD: high-fat diet; STZ: streptozotocin; RQ: relative quantification; PPARα: peroxisome proliferator-activated receptor-alpha.
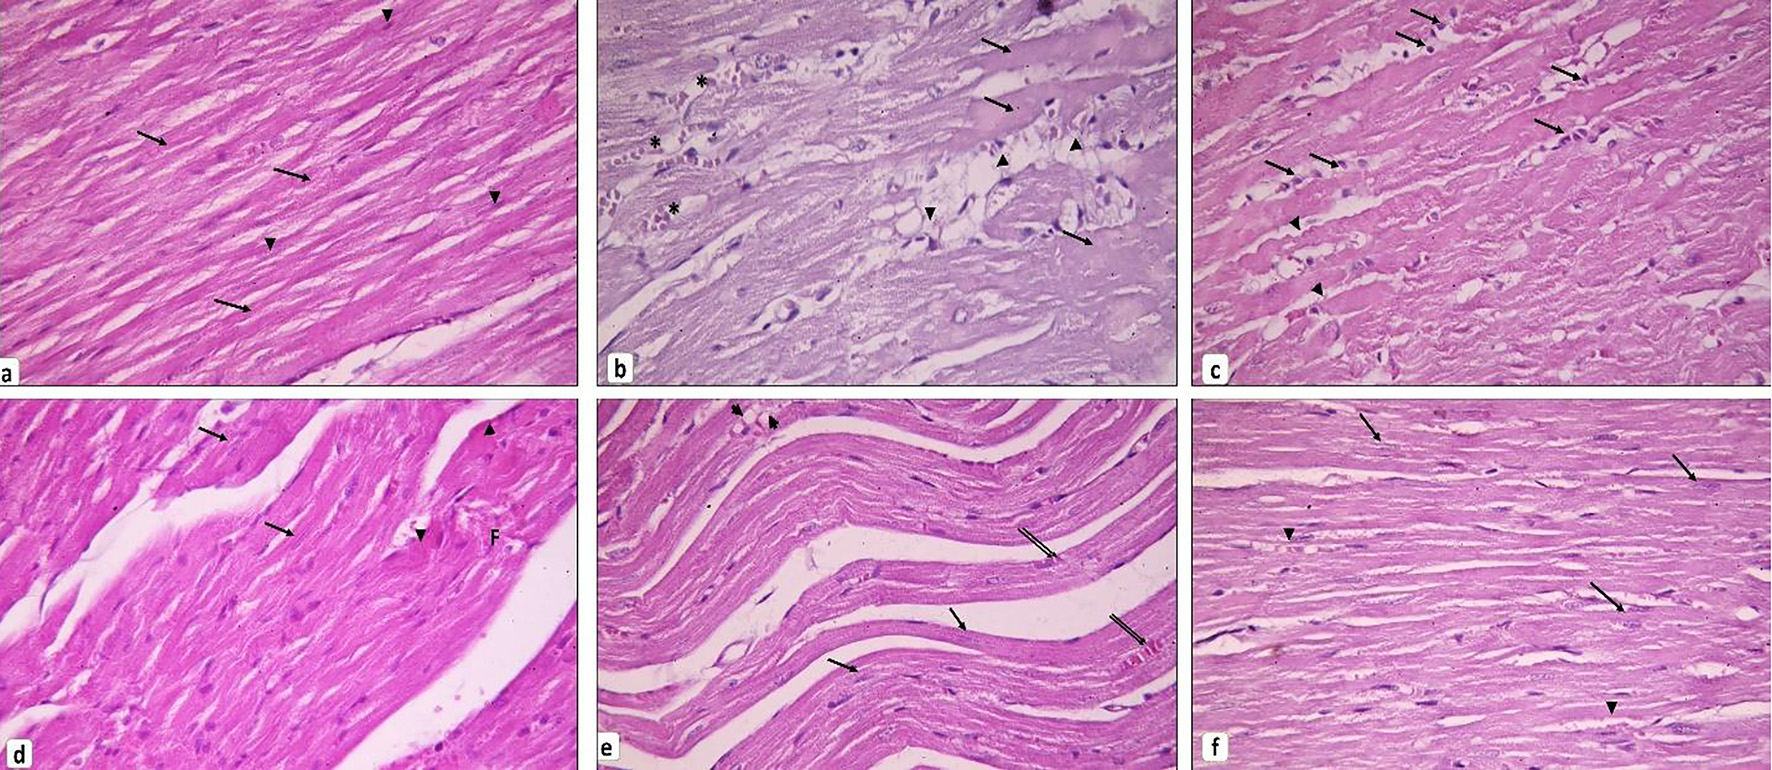
Figure 2. Cardiac muscle histopathology. (a) Control group showing branching and anastomosing cardiac muscle fibers running in different directions. Cardiomyocytes exhibit transverse striations in their sarcoplasm (arrows). Notice the oval vesicular central nuclei of the cardiomyocytes (arrowheads). (b, c) Diabetic group. (b) Loss of striation in some cardiomyocytes and appear with dark acidophilic sarcoplasm devoid of nuclei (arrows). Other cardiac muscle cells are fragmented and infiltrated by fat (arrowheads). Blood vessels in between cardiac muscle appear dilated and congested (*). (c) Thinned out cardiomyocytes can be seen (arrowheads). Mononuclear cells infiltrate the endomysium in between the widely separated cardiac muscle fibers (arrows). (d) Myoinositol-treated group showing many cardiomyocytes are seen with vesicular nuclei (arrows) and few with deeply acidophilic cytoplasm (arrowheads). Others still exhibit focal fragmentation (F). (e) Metformin-treated group showing many cardiomyocytes are striated with vesicular nuclei (arrows). Others appear discontinuous and infiltrated by fat (arrowheads). Few congested blood vessels can be observed (double arrows). (f) Myoinositol + metformin-treated group showing most cardiomyocytes appear striated with vesicular oval nuclei (arrows). Small, congested blood vessels can be noticed (arrowheads) (H&E, × 400). H&E: hematoxylin and eosin.
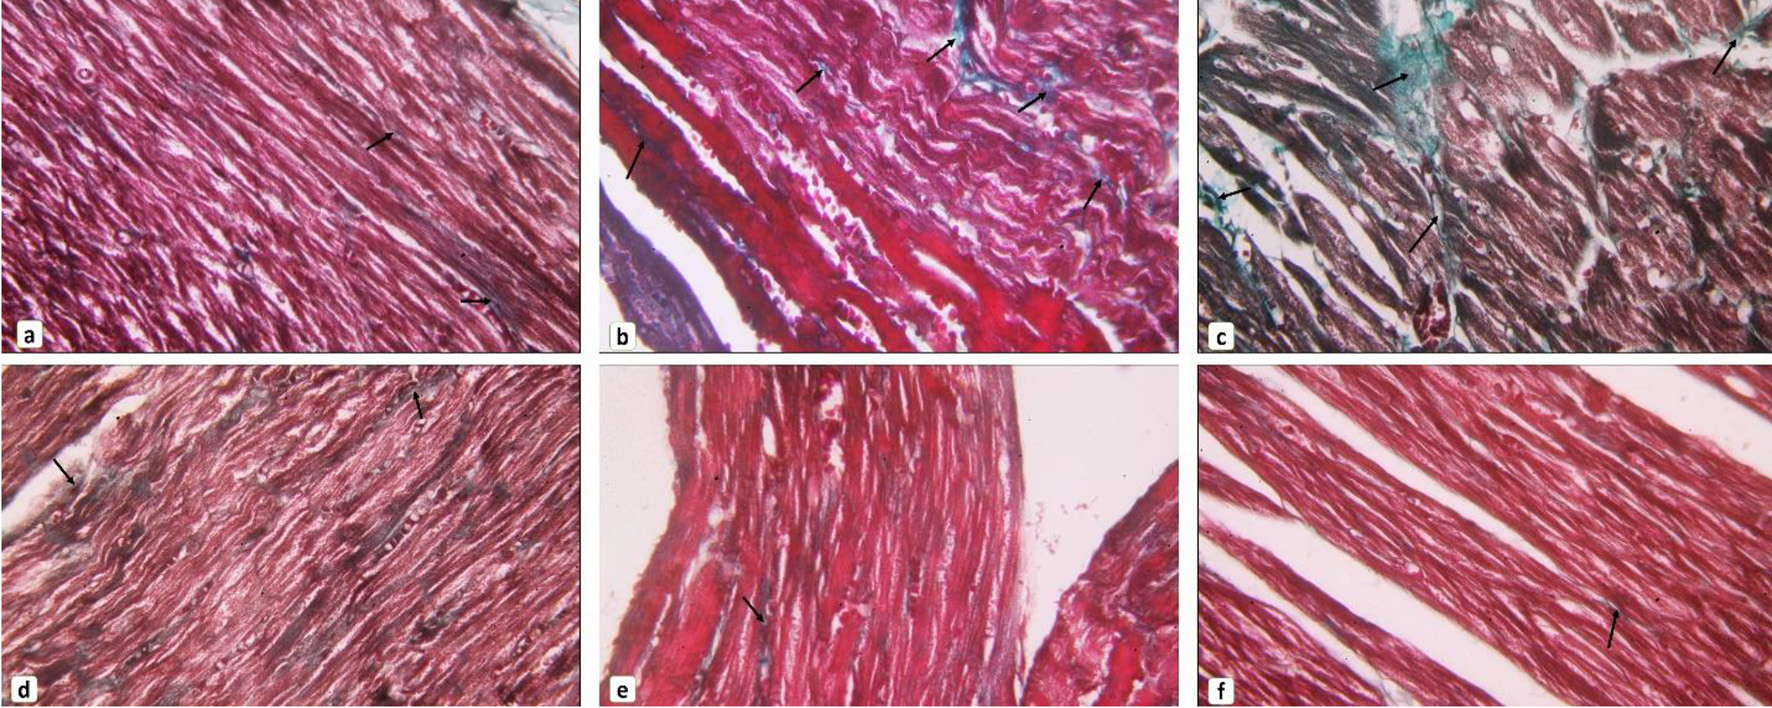
Figure 3. Collagen fibers content in cardiac muscle. (a) Control group, (b, c) diabetic group, (d) myoinositol-treated group, (e) metformin-treated group, (f) myoinositol + metformin-treated group showed most cardiomyocytes appear striated with vesicular oval nuclei (arrows). Small, congested blood vessels can be noticed (arrowhead). Representative images of Masson’s trichrome-stained sections of the myocardium showing collagen fibers distribution in between cardiomyocytes. Arrows indicate content of collagen fibers (Masson’s trichrome stain, × 400).
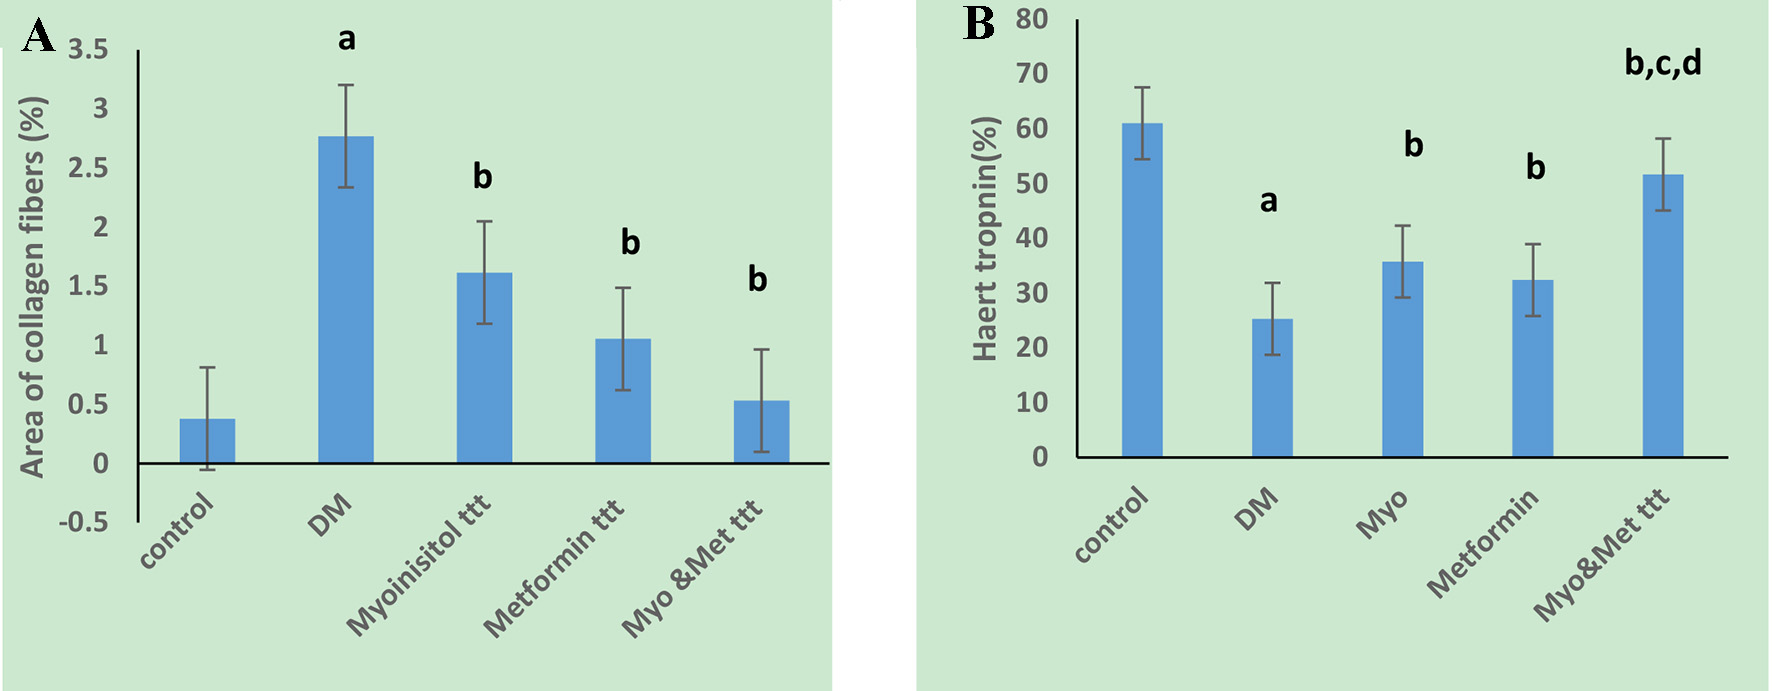
Figure 4. Effect of tested drugs on myocardial fibrosis and troponin T precentage area in cardiac muscle cells in HFD-fed STZ-induced diabetic rats. (A) Diabetic group has a significantly the highest collagen percentage area. (B) Diabetic group has a significantly the lowest troponin positive cells while highest percentage in both myoinositol and metformin treated group is observed. aP < 0.01, compared with normal control values. bP < 0.01, compared with diabetic control values. cP < 0.01, compared with myoinositol, dP < 0.01, compared metformin ttt. HFD: high-fat diet; STZ: streptozotocin.
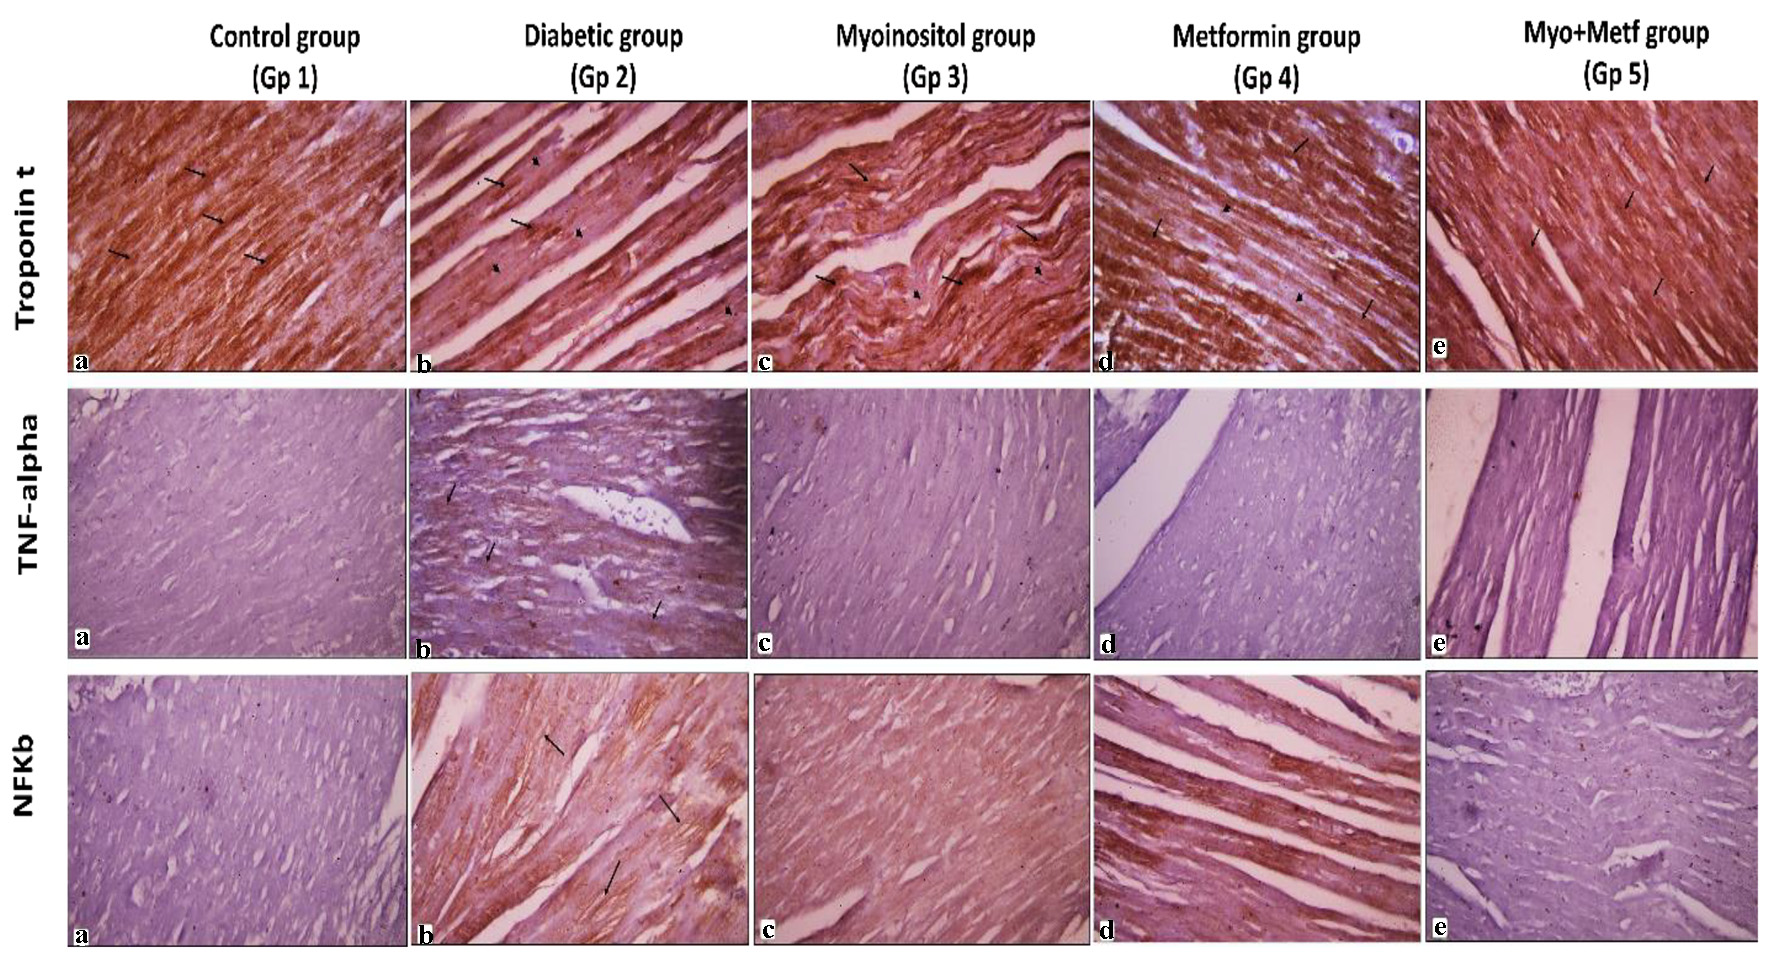
Figure 5. Immunohistochemical stains of the cardiac muscle. Representative immunoperoxidase images showing expression of troponin T, TNF-α and NF-κB p105 in the myocardium of normal, diabetic and the three treated groups. Arrows indicate positive brown sites where the immune marker is expressed. Arrowheads indicate areas of negative immune reaction (avidin-biotin peroxidase, × 400). TNF-α: tumor necrosis factor alpha; NF-κB: nuclear factor kappa B.
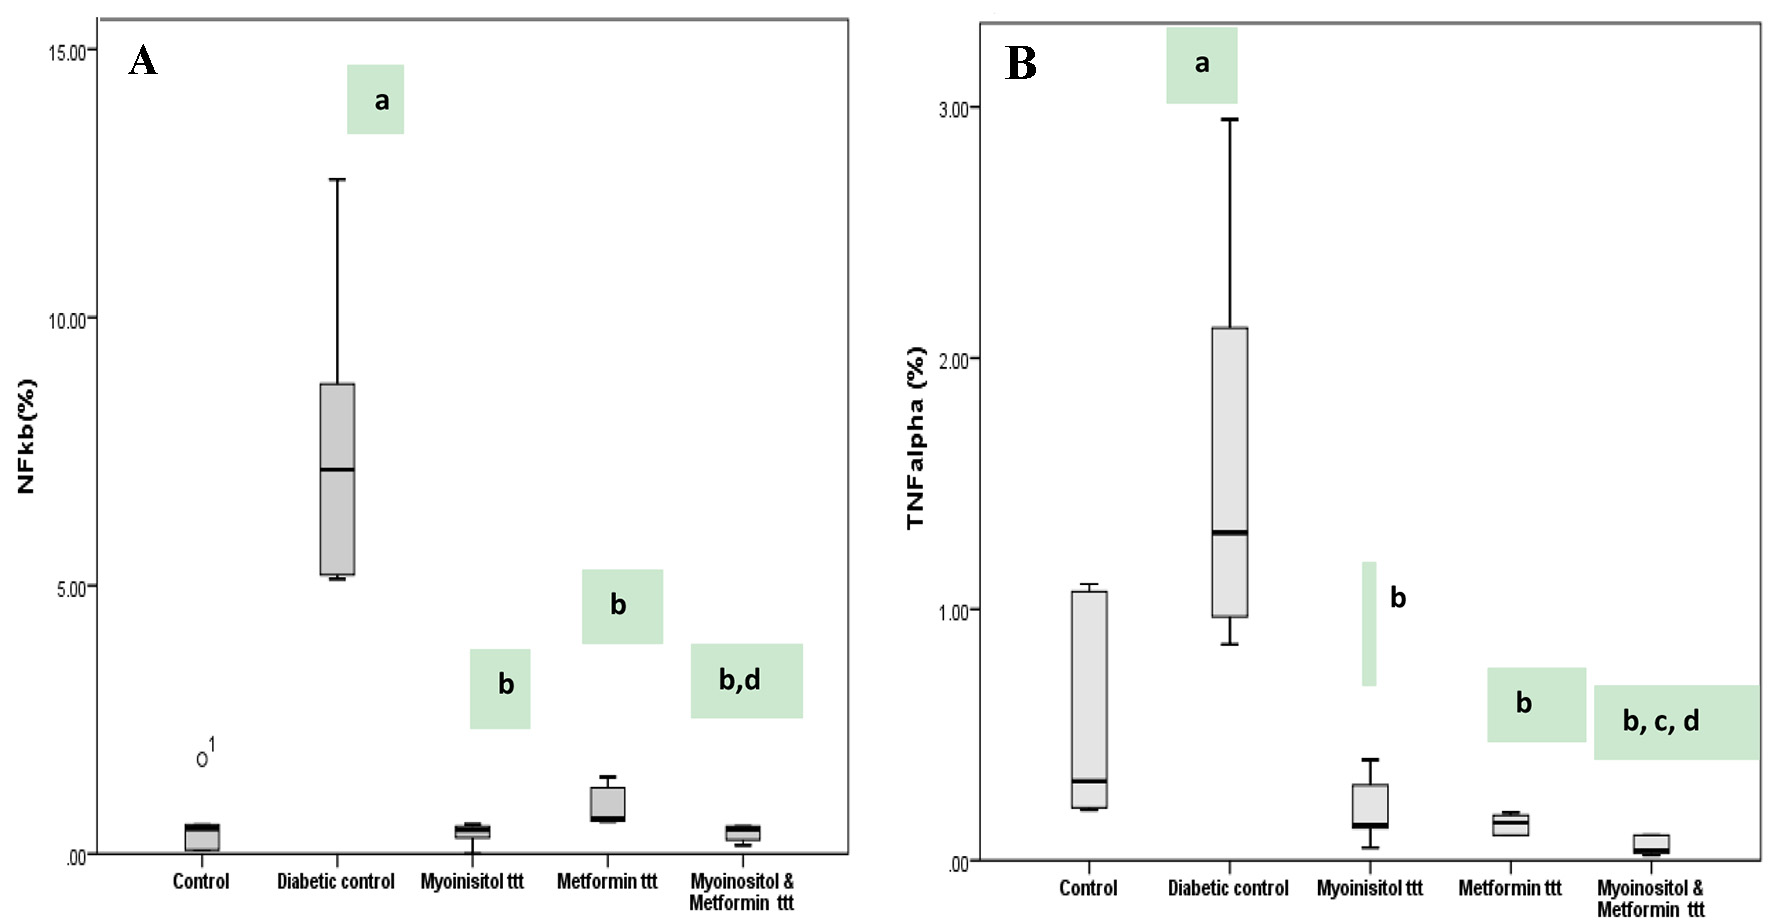
Figure 6. Box plot represents expression of NF-κB and TNF-α detected by immunohistochemical staining among different groups. (A) Diabetic group has the highest NF-κB percentage area and stain intensity while lowest percentage in both myoinositol and metformin-treated group is observed. (B) Diabetic group has the highest TNF-α percentage positive cells while lowest percentage in both myoinositol and metformin-treated group is observed. aP < 0.01, compared with normal control values. bP < 0.01, compared with diabetic control values. cP < 0.01, compared with myoinositol. dP < 0.01, compared metformin ttt. TNF-α: tumor necrosis factor alpha; NF-κB: nuclear factor kappa B.
Tables
Table 1. Mean Serum Levels of FBG, Insulin, Lipid Profile and CK-MB in All Studied Groups
| Body weight (g) | FBG (mg/dL) | Insulin (µIU/mL) | CK-MB (U/L) | Total cholesterol (mg/dL) | TGs (mg/dL) | LDL (mg/dL) | HDL (mg/dL) |
|---|
| Values are mean ± SD. aP < 0.05, compared with normal control values. bP < 0.01, compared with diabetic control values. cP < 0.01, compared with myioinsitol ttt values. dP < 0.01, compared with metformin ttt values. FBG: fasting blood glucose; CK-MB: creatine kinase MB isoenzyme; TGs: triglycerides; LDL: low-density lipoprotein; HDL: high-density lipoprotein; SD: standard deviation. |
| Controls (n = 6) | 292.8 ± 17.3 | 103.6 ± 11.4 | 2.6 ± 0.2 | 10 ± 1.7 | 41 ± 2.3 | 37 ± 2.7 | 22 ± 3 | 36 ± 1.4 |
| Diabetic (n = 6) | 290.8 ± 21.3 | 305.8 ± 59.3a | 18.6 ± 2a | 54 ± 8.6a | 118.6 ± 6.4a | 111.5 ± 7.1a | 64 ± 2.3a | 24.8 ± 1.1a |
| Myoinositol ttt (n = 6) | 315 ± 42.4 | 164 ± 24.1b | 9.4 ± 0.7a, b, d | 40 ± 5.4a, b | 62 ± 3.8a, b, d | 54.8 ± 2.9 a, b, d | 33.8 ± 1.3a, b, d | 32.3 ± 0.8a, b, d |
| Metformin ttt (n = 6) | 311.5 ± 35.3 | 184 ± 85.6b | 6.8 ± 0.8a, b, c | 24.8 ± 6.8a, b | 50.8 ± 3.9a, b, c | 47.5 ± 1.3a, b, c | 31.6 ± 1.9a, b, c | 33.5 ± 0.5a, b, c |
| Myoinositol and metformin ttt (n = 6) | 320 ± 39.2 | 174 ± 59.2b | 3 ± 0.2b, c, d | 19.4 ± 1.7b, c | 39.1 ± 1.5b, c, d | 34.6 ± 2.1b, c, d | 21.1 ± 1.9b, c, d | 36 ± 0.8b, c, d |
Table 2. Correlations Between GLUT-4 Level, PPARα RQs, FBG, Insulin Levels and Lipid Profile Among All the Studied Groups
| FBG (mg/dL) | Plasma insulin level (µIU/mL) | Total cholesterol (mg/dL) | Triglyceride (mg/dL) | HDL (mg/dL) | LDL (mg/dL) |
|---|
| Data are presented as r-value. Person’s correlation test was used. *Correlation is significant at the 0.05 level (two-tailed). **Correlation is significant at the 0.01 level (two-tailed). GLUT-4: glucose transporter 4; PPARα: peroxisome proliferator-activated receptor-alpha; RQs: relative quantifications; FBG: fasting blood glucose; HDL: high-density lipoprotein; LDL: low-density lipoprotein. |
| GLUT-4 (µg/g) | | | | | | |
| Correlation coefficient | -0.213 | -0.457* | -0.590** | -0.595** | 0.527** | -0.500** |
| Sig. (two-tailed) | 0.260 | 0.011 | 0.001 | 0.001 | 0.003 | 0.005 |
| PPARα RQs | | | | | | |
| Correlation coefficient | -0.663** | -0.856** | -0.829** | -0.789** | 0.819** | -0.803** |
| Sig. (two-tailed) | 0.000 | 0.000 | 0.000 | 0.000 | 0.000 | 0.000 |