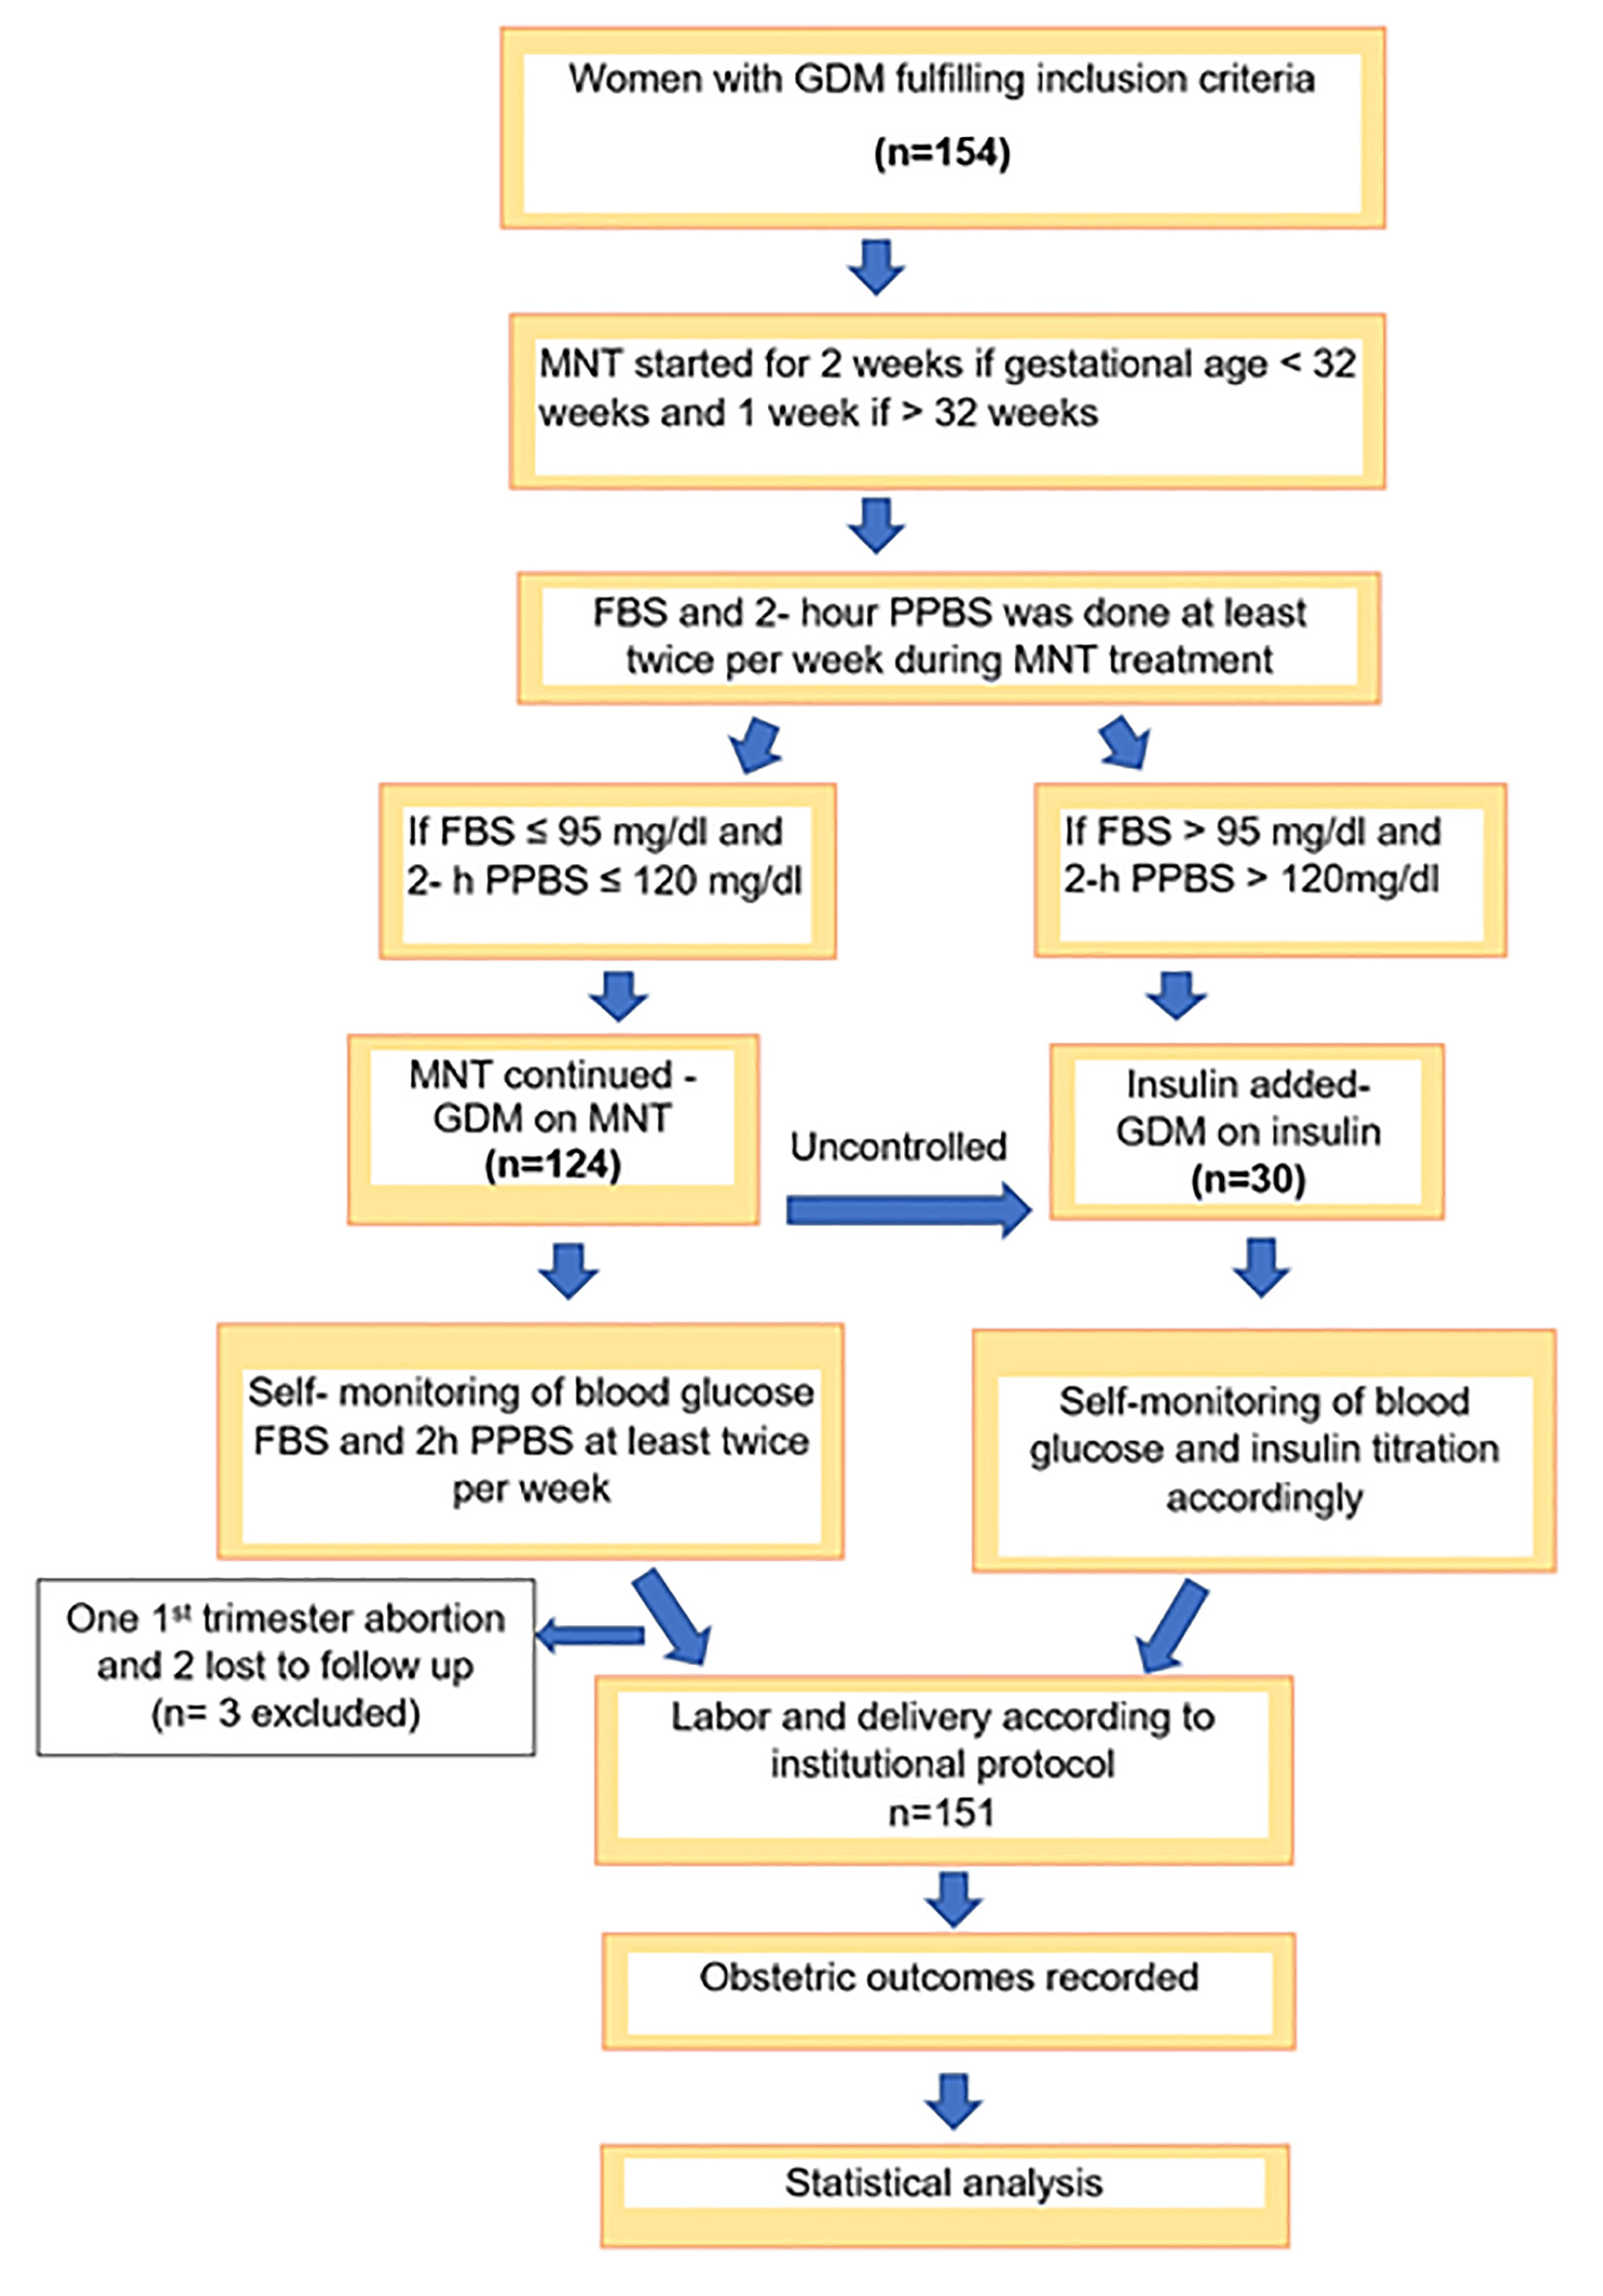
Figure 1. STROBE flow diagram.
| Journal of Endocrinology and Metabolism, ISSN 1923-2861 print, 1923-287X online, Open Access |
| Article copyright, the authors; Journal compilation copyright, J Endocrinol Metab and Elmer Press Inc |
| Journal website https://www.jofem.org |
Original Article
Volume 12, Number 1, February 2022, pages 32-39
Predictors of Antenatal Insulin Requirement in Women With Gestational Diabetes Mellitus: A Prospective Observational Cohort Study
Figures
Tables
| Parameters | Overall, median (IQR) | Group | P value | |
|---|---|---|---|---|
| MNT (n = 121) | Insulin (n = 30) | |||
| Data are expressed as median (IQR), except primigravida expressed as frequency (percentage). *Statistically significant with P-value < 0.05. aWilcoxon-Mann-Whitney U test. bChi-squared test. MNT: medical nutrition therapy; BMI: body mass index; 75-g OGTT: 75-gram oral glucose tolerance test; IQR: interquartile range. | ||||
| Age (years)* | 29 (25-30) | 27 (25 - 30) | 30 (29.3 - 32) | < 0.001a |
| Primigravida* | 73 (58.3%) | 52 (43.0%) | 21 (70.0%) | 0.008b |
| Weight (kg)* | 58 (54 - 62) | 58 (53 - 60) | 61 (59.5 - 74.3) | < 0.001a |
| Height (m)* | 1.56 (1.52 - 1.6) | 1.56 (1.51 - 1.58) | 1.58 (1.55 - 1.61) | 0.014a |
| BMI (kg/m2)* | 23.8 (22 - 25.8) | 23.8 (21.9 - 25.3) | 24.9 (23.8 - 27.4) | 0.003a |
| Gestational age at diagnosis of GDM (weeks) | 27.8 (20.5 - 32.7) | 27 (25 - 30) | 30 (29.2 - 32) | 0.579a |
| Blood glucose (after 75-g OGTT) (mg/dL)* | 157 (149 - 175) | 156 (149 - 168) | 165.5 (149.7 - 186.7) | 0.032a |
| Parameters | Overall | Group | RR (95% CI) | P value | |
|---|---|---|---|---|---|
| MNT (n = 121) | Insulin (n = 30) | ||||
| *Significant at P-value < 0.05. **Expressed as mean ± SD. #Expressed as frequency (percentage). aWilcoxon-Mann-Whitney U test. bChi-squared test. cFisher’s exact test. MNT: medical nutrition therapy; RR: relative risk; 95% CI: 95% confidence interval; U: units; GA: gestational age; PPH: postpartum hemorrhage; CD: cesarean delivery; CDMR: cesarean done on maternal request; APH: antepartum hemorrhage; CPD: cephalopelvic disproportion; PROM: pre-labor rupture of membranes. | |||||
| Gestational hypertension*, # | 36 (23.8%) | 22 (18.2%) | 14 (46.7%) | 0.71 (0.52 - 0.89) | 0.001b |
| GA at diagnosis of gestational hypertension (weeks) | - | 34.02 ± 4.62** | 33.73 ± 3.58** | - | 0.537a |
| 20 - 276/7 | - | 2 (9.1%) | 1 (7.1%) | - | 1.000c |
| ≥ 28 | 20 (90.9%) | 13 (92.9%) | |||
| Instrumental delivery# | 2 (1.3%) | 1 (0.8%) | 1 (3.3%) | 0.62 (0.12 - 1.14) | 0.359c |
| Cesarean delivery*, # | 111 (73.5%) | 84 (69.4%) | 27 (90.0%) | 0.82 (0.71 -0.96) | 0.022b |
| PPH# | 4 (2.6%) | 4 (3.3%) | 0 (0.0%) | 1.26 (0.64 - 1.38) | 0.585c |
| Surgical site infection# | 5 (3.3%) | 2 (1.7%) | 3 (10.0%) | 0.49 (0.14 - 1.95) | 0.054c |
| Indication for CD# | - | 0.161c | |||
| Previous CD | 26 (23.4%) | 20 (23.8%) | 6 (22.2%) | ||
| Failed induction | 20 (18.0%) | 15 (17.9%) | 5 (18.5%) | ||
| Non-reassuring fetal status | 20 (18.0%) | 11 (13.1%) | 9 (33.3%) | ||
| CDMR | 16 (14.4%) | 11 (13.1%) | 5 (18.5%) | ||
| Dysfunctional labor | 9 (8.1%) | 9 (10.7%) | 0 (0.0%) | ||
| Obstructed labor | 8 (7.2%) | 8 (9.5%) | 0 (0.0%) | ||
| Malpresentation | 5 (4.5%) | 4 (4.8%) | 1 (3.7%) | ||
| APH | 2 (1.8%) | 2 (2.4%) | 0 (0.0%) | ||
| CPD | 2 (1.8%) | 2 (2.4%) | 0 (0.0%) | ||
| Contracted pelvis | 1 (0/9%) | 1 (1.2%) | 0 (0.0%) | ||
| Prolonged PROM | 1 (0.9%) | 1 (1.2%) | 0 (0.0%) | ||
| Uterine anomaly | 1 (0.9%) | 0 (0.0%) | 1 (3.7%) | ||
| Parameters | Overall | Group | P-value | |
|---|---|---|---|---|
| MNT (n = 121) | Insulin (n = 30) | |||
| *Statistically significant at P-value < 0.05. **Expressed as mean ± SD. aWilcoxon-Mann-Whitney U test. bChi-squared test. cFisher’s exact test. MNT: medical nutrition therapy; LGA: large for gestational age. | ||||
| Gestational age at delivery (weeks)* | 37.95 ± 1.57** | 38.21 ± 1.42** | 36.88 ± 1.70** | < 0.001a |
| Fetal maturity | 0.075c | |||
| Early preterm | 2 (1.3%) | 1 (0.8%) | 1 (3.3%) | |
| Late preterm | 19 (12.6%) | 12 (9.9%) | 7 (23.3%) | |
| Term | 130 (86.1%) | 108 (89.3%) | 22 (73.3%) | |
| LGA | 9 (6.0%) | 9 (7.4%) | 0 (0.0%) | 0.206c |
| Hypoglycemia | 3 (2.0%) | 2 (1.7%) | 1 (3.3%) | 0.488c |
| Hypocalcemia | 0 (0.0%) | 0 (0.0%) | 0 (0.0%) | 1.000b |
| Polycythemia | 11 (7.3%) | 7 (5.8%) | 4 (13.3%) | 0.230c |
| Hyperbilirubinemia* | 17 (11.3%) | 9 (7.4%) | 8 (26.7%) | 0.007c |
| Heart disease | 2 (1.3%) | 2 (1.7%) | 0 (0.0%) | 1.000c |
| Death | 5 (3.3%) | 5 (4.1%) | 0 (0.0%) | 0.583c |
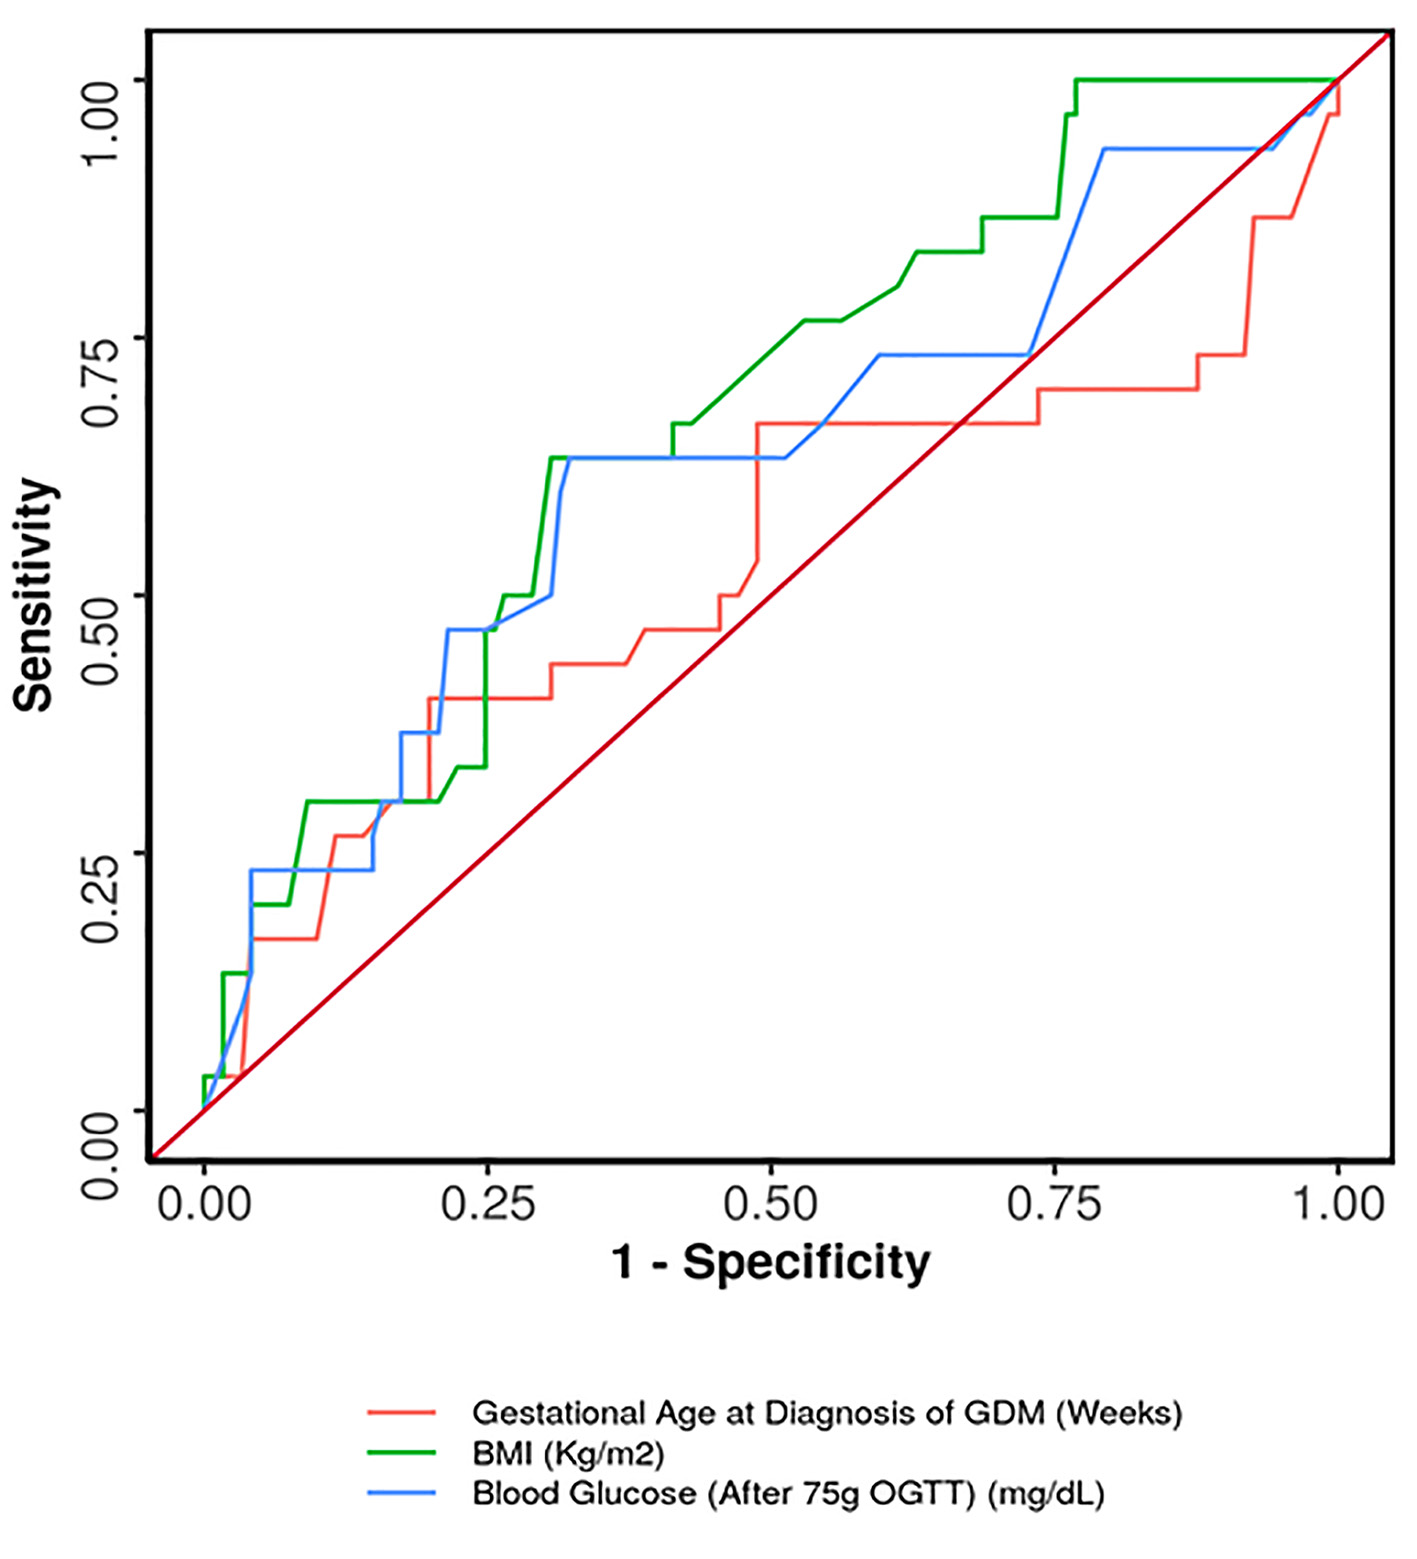
| Variable | Sensitivity | Specificity | PPV | NPV | Diagnostic accuracy |
|---|---|---|---|---|---|
| PPV: positive predictive value; NPV: negative predictive value; GDM: gestational diabetes mellitus; BMI: body mass index; 75-g OGTT: 75-gram oral glucose tolerance test; ROC: receiver operating characteristic. | |||||
| Gestational age at diagnosis of GDM (weeks) (cutoff: 33.286 by ROC) | 30.0% (15 - 49) | 80.2% (72 - 87) | 27.3% (13 - 46) | 82.2% (74 - 89) | 70.2% (62 - 77) |
| BMI (kg/m2) (cutoff: 24.7 by ROC) | 63.3% (44 - 80) | 69.4% (60 - 77) | 33.9% (22 - 48) | 88.4% (80 - 94) | 68.2% (60 - 76) |
| BMI (kg/m2) (cutoff: ≥ 25) | 50.0% (31 - 69) | 73.6% (65 - 81) | 31.9% (19 - 47) | 85.6% (77 - 92) | 68.9% (61 - 76) |
| Blood glucose (after 75-g OGTT) (mg/dL) (cutoff: 162 by ROC) | 63.3% (44 - 80) | 67.8% (59 - 76) | 32.8% (21 - 46) | 88.2% (80 - 94) | 66.9% (59 - 74) |