Journal of Endocrinology and Metabolism, ISSN 1923-2861 print, 1923-287X online, Open Access
Article copyright, the authors; Journal compilation copyright, J Endocrinol Metab and Elmer Press Inc
Journal website https://www.jofem.org

Original Article

Volume 12, Number 3, June 2022, pages 97-101


Effect of Age, Gender, and Body Mass Index on Thyroid Bethesda Classification: A Retrospective Study

Figures

Figure 1.
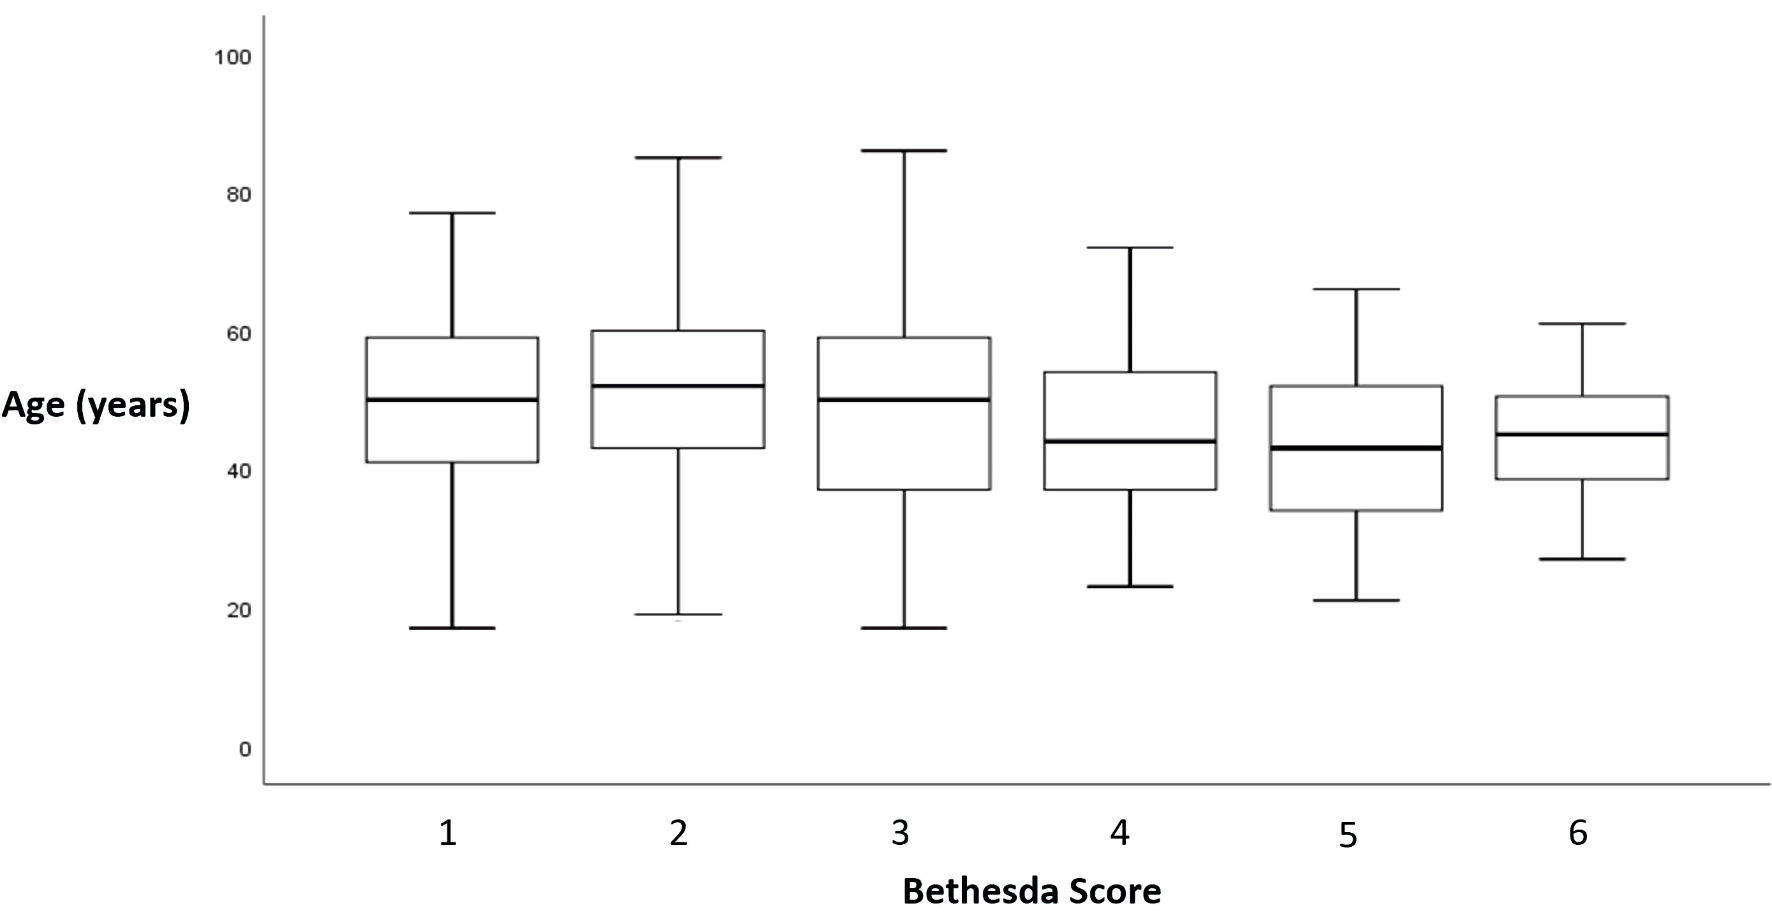
Figure 1. Relationship between Bethesda score and age. Bethesda classification was reported as a score from 1 to 6: 1 for non-diagnostic or unsatisfactory, 2 for benign, 3 for atypia of undetermined significance or follicular lesion of undetermined significance, 4 for follicular neoplasm or suspicious for a follicular neoplasm, 5 for suspicious of malignancy, and 6 for malignant.
Figure 2.
Figure 2. Relationship between Bethesda score and BMI. Bethesda classification was reported as a score from 1 to 6: 1 for non-diagnostic or unsatisfactory, 2 for benign, 3 for atypia of undetermined significance or follicular lesion of undetermined significance, 4 for follicular neoplasm or suspicious for a follicular neoplasm, 5 for suspicious of malignancy, and 6 malignant.

Tables

Table 1. Distribution of Bethesda Score According to Gender
 
BethesdaMen (%)Women (%)Men/women ratio
Bethesda classification was reported as a score from 1 to 6: 1 for non-diagnostic or unsatisfactory, 2 for benign, 3 for atypia of undetermined significance or follicular lesion of undetermined significance, 4 for follicular neoplasm or suspicious for a follicular neoplasm, 5 for suspicious of malignancy, and 6 for malignant.
124.775.31/3
216.883.21/5
314.385.71/5
422781/3
533.366.71/2
642.157.91/1.4


Table 2. Distribution of Bethesda Score According to BMI Categories
 
Bethesda score
123456Total (%)
N (%)N (%)N (%)N (%)N (%)N (%)
Subgroup’s stratifications according to BMI and Bethesda score: underweight (BMI < 18 kg/m2), normal weight (18 < BMI < 25 kg/m2), overweight (25 < BMI < 30 kg/m2), and obese (> 30 kg/m2). BMI: body mass index.
BMI category
  Underweight (%)2 (28.6)3 (42.9)3 (28.6)0 (0)0 (0)0 (0)8 (1.2)
  Normal weight (%)46 (13.8)194 (58.1)50 (15.0)22 (6.6)16 (4.8)6 (1.8)334 (50)
  Overweight (%)26 (11.4)135 (59.2)34 (14.9)12 (5.3)13 (5.7)8 (3.5)228 (34.1)
  Obese (%)15 (15.3)49 (50.0)18 (18.4)7 (7.1)4 (4.1)5 (5.1)98 (14.7)
  Total (%)89 (13.3)381 (57.0)105 (15.7)41 (6.1)33 (4.9)19 (2.8)668 (100)