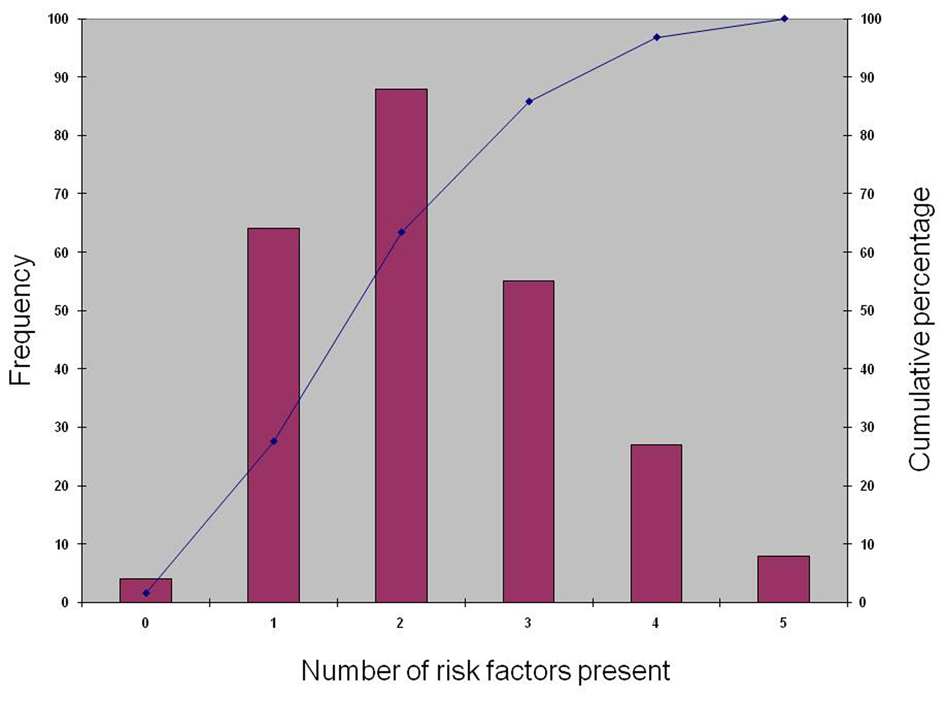
Figure 1. Cumulative frequency graph depicting the distribution of number of risk factors in patients with young CAD.
| Journal of Endocrinology and Metabolism, ISSN 1923-2861 print, 1923-287X online, Open Access |
| Article copyright, the authors; Journal compilation copyright, J Endocrinol Metab and Elmer Press Inc |
| Journal website http://www.jofem.org |
Original Article
Volume 2, Number 1, February 2012, pages 39-45
Metabolic Syndrome and Coronary Artery Disease in Indians Younger Than 40 Years
Figures
Tables
| Total (n = 246) | Male (n = 218) | Female (n = 28) | P value | |
|---|---|---|---|---|
| NS- not significant. | ||||
| Age in years (mean ±SD) | 36.3 ± 4.1 | 36.2 ± 4.1 | 37.5 ± 3.5 | NS |
| Metabolic syndrome | 66 (26.8%) | 53 (24.3%) | 13 (46.4%) | < 0.025 |
| Smoking | 187 (76.0%) | 177 (81.2%) | 10 (35.7%) | < 0.001 |
| Family History | 64 (26.0%) | 54 (24.8%) | 10 (35.7%) | NS |
| Fasting plasma glucose≥ 100 or previously diagnosed DM | 54 (21.95%) | 45 (20.6%) | 9 (32.1%) | NS |
| Hypertension | 55 (22.4%) | 42 (19.3%) | 13 (46.4%) | < 0.005 |
| Reduced HDL cholesterol (< 40 mg/dL in males and < 50 mg/dL in females) | 171 (69.5%) | 148 (67.9%) | 23 (82.1%) | NS |
| Increased Triglycerides (≥ 150 mg/dL) | 103 (41.9%) | 92 (42.2%) | 11 (39.3%) | NS |
| Obesity (≥ 80 cm in females and ≥ 90 cm in males) | 122 (49.6%) | 100 (45.9%) | 22 (78.6%) | < 0.005 |
| Waist circumference (cm) | 87.1 ± 10.5 | 87.2 ± 10.6 | 86.4 ± 10.1 | NS |
| Total cholesterol (mg/dL) | 171 ± 51.8 | 172.2 ± 53.9 | 165.3 ± 31.1 | NS |
| LDL cholesterol (mg/dL) | 102.5 ± 45.8 | 103.6 ± 47.4 | 93.5 ± 30.6 | NS |
| HDL cholesterol (mg/dL) | 36.7 ± 9.3 | 36.4 ± 9.2 | 38.5 ± 10.5 | NS |
| Triglycerides (mg/dL) | 156 ± 85.7 | 157.2 ± 88.2 | 150 ± 63.7 | NS |
| Total (n = 66) | Male (n = 53) | Female (n = 13) | P value | |
|---|---|---|---|---|
| NS- not significant. | ||||
| Smoking | 47 (71.1%) | 42 (79.2%) | 5 (38.5%) | < 0.025 |
| Family History | 26 (39.4%) | 18 (34.0%) | 8 (61.5%) | NS |
| Mean number of components of MS | 2.61 ± 0.68 | 2.57 ± 0.67 | 2.77 ± 0.73 | NS |
| Fasting plasma glucose ≥ 100 or previously diagnosed DM | 35 (53.0%) | 27 (50.9%) | 8 (61.5%) | NS |
| Hypertension | 36 (54.5%) | 26 (49.1%) | 10 (76.9%) | NS |
| Reduced HDL cholesterol (< 40 mg/dL in males and < 50 mg/dL in females) | 55 (83.3%) | 43 (81.1%) | 12 (92.3%) | NS |
| Increased Triglycerides (≥ 150 mg/dL) | 49 (74.2%) | 40 (75.5%) | 9 (69.2%) | NS |
| Total cholesterol (mg/dL) | 179 ± 54.5 | 178.8 ± 59.2 | 178.7 ± 29.8 | NS |
| LDL cholesterol (mg/dL) | 102.7 ± 52.1 | 103.8 ± 55.7 | 98.2 ± 35.1 | NS |
| HDL cholesterol (mg/dL) | 34.2 ± 8.9 | 33.6 ± 8.6 | 37 ± 9.97 | NS |
| Triglycerides (mg/dL) | 195 ± 89.8 | 197.6 ± 94.9 | 183.4 ± 67.3 | NS |