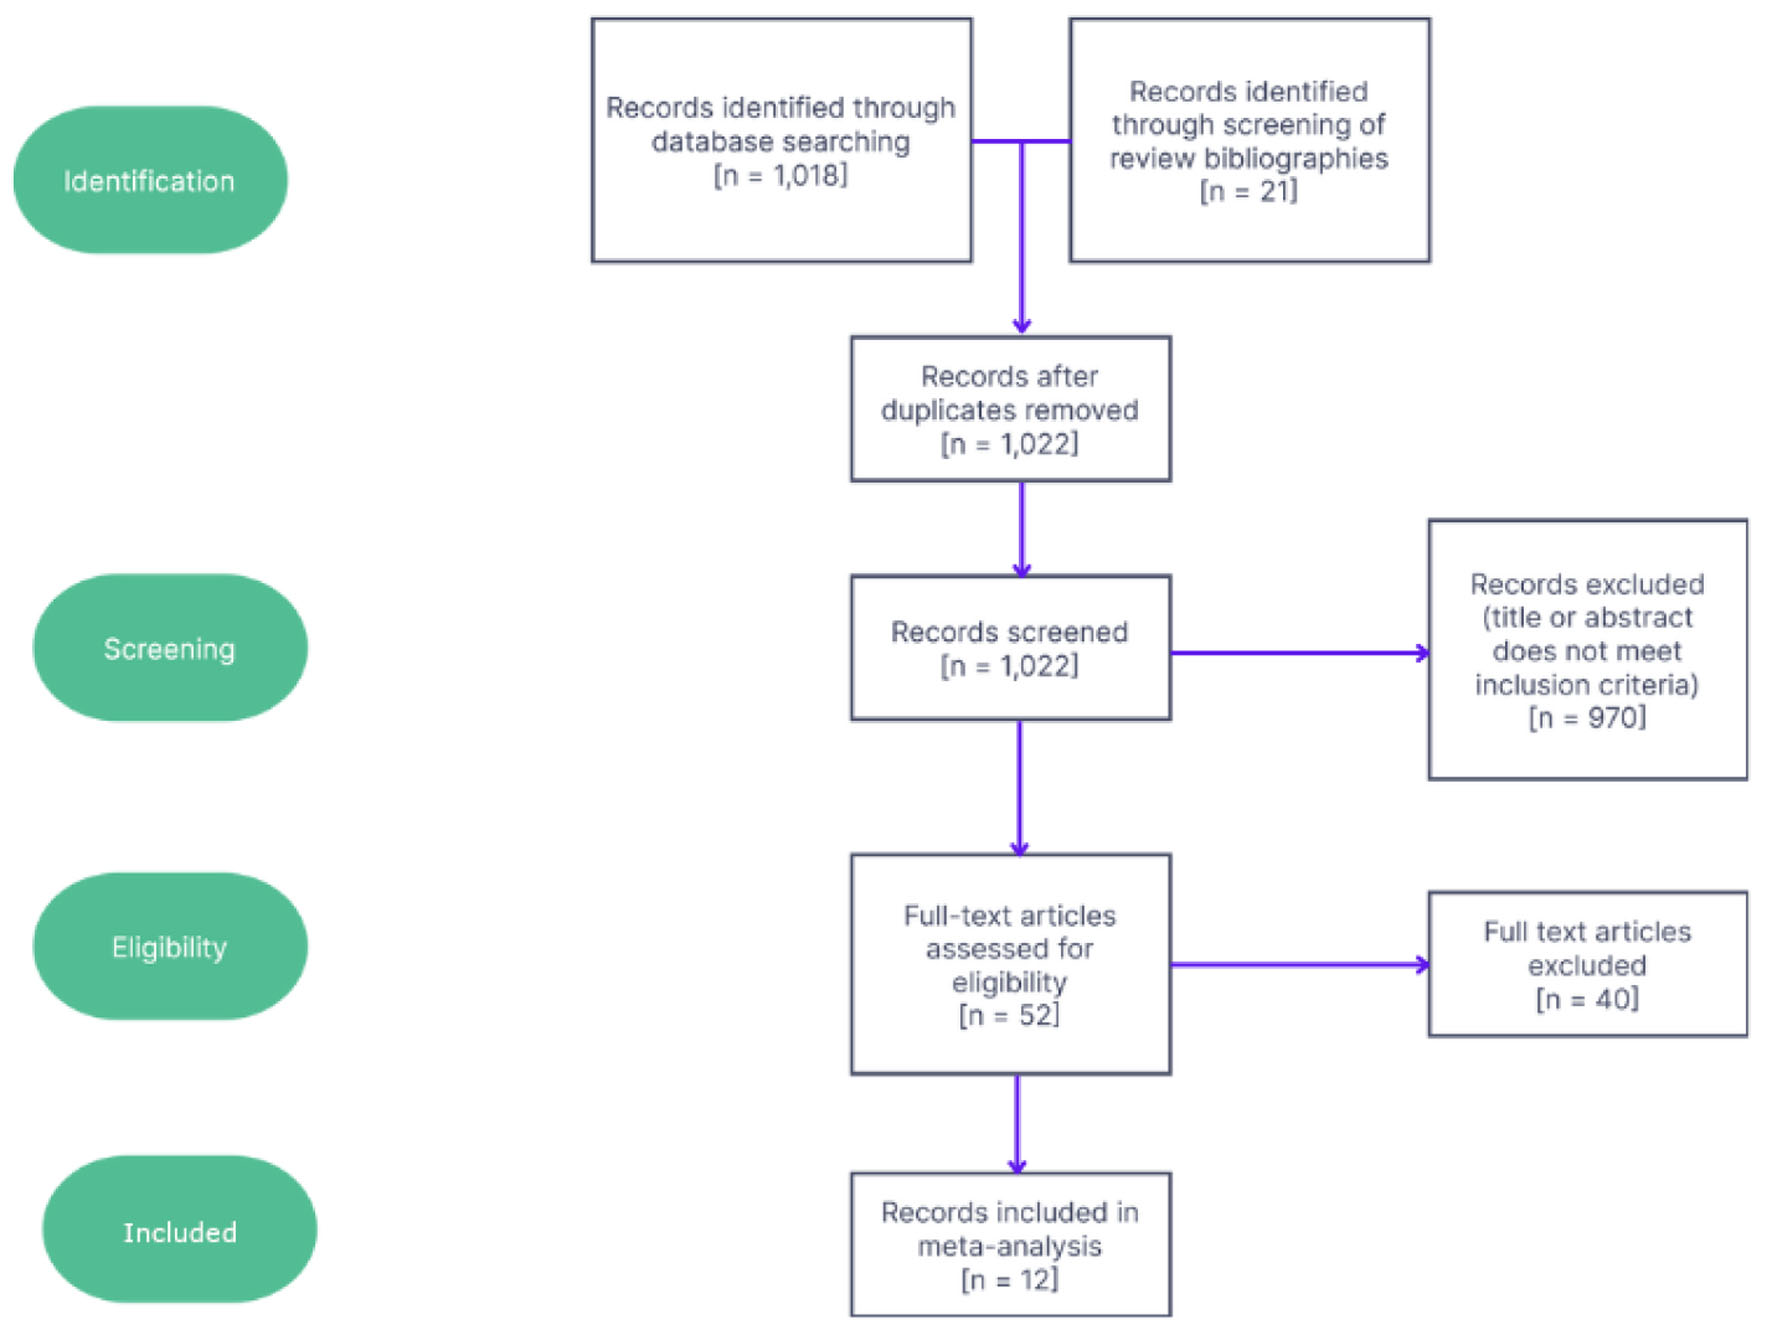
Figure 1. Flowchart showing screening and selection process for studies along with numbers of studies excluded at each step.
| Journal of Endocrinology and Metabolism, ISSN 1923-2861 print, 1923-287X online, Open Access |
| Article copyright, the authors; Journal compilation copyright, J Endocrinol Metab and Elmer Press Inc |
| Journal website https://www.jofem.org |
Original Article
Volume 13, Number 1, February 2023, pages 1-12
The Effect of Microgravity on Parathyroid Hormone Secretion: A Meta-Analysis
Figures
Tables
| Database | Terms | No. of records identified |
|---|---|---|
| Embase, Scopus | parathyroid* AND (microgravity OR hypogravity OR “low gravity” OR weightless*) | Embase: 18; Scopus: 16 |
| PubMed | parathyroid* AND (microgravity OR hypogravity OR “low gravity” OR weightless*) (all fields) | 9 |
| Google Scholar | parathyroid AND (microgravity OR hypogravity OR “low gravity” OR weightlessness OR weightless) | 979 |
| JAMA Network | parathyroid AND (microgravity OR hypogravity OR “low gravity” OR weightlessness) | 0 |
| Ref. | Year | First author | n | Real/simulated | Timepoints | Database |
|---|---|---|---|---|---|---|
| *Smith et al report data from two separate studies, one with a sample size of six and another with 16 subjects. | ||||||
| [37] | 2022 | Linossier | 9 | Simulated | In-flight, R+2-7 | Embase, Scopus, Google Scholar |
| [38] | 2015 | Smith | 7 | Real | In-flight | Scopus, Google Scholar |
| [39] | 2012 | Morgan | 12 | Simulated | In-flight, R+2-7 | Embase |
| [27] | 2012 | Smith | 6 | Real | In-flight, R+0, > R+7 | Scopus, PubMed, Google Scholar |
| [40] | 2010 | Armbrecht | 10 | Simulated | In-flight, R+1, R+2-7, >R+7 | Embase, Scopus |
| [41] | 2007 | Zerwekh | 10 | Simulated | In-flight | Embase, Scopus, PubMed |
| [42] | 2007 | Zwart | 7 | Simulated | In-flight, R+0, R+1, R+2-7, >R+7 | Scopus, PubMed |
| [28] | 2005 | Smith | 6, 16* | Real | In-flight, R+0, R+2-7, >R+7 | Embase, Scopus, Google Scholar |
| [43] | 2005 | Rittweger | 25 | Simulated | In-flight, R+1, R+2-7, >R+7 | Google Scholar (grey) |
| [44] | 2005 | Morukov | 9 | Real | R+1, R+2-7, >R+7 | Scopus |
| [45] | 2004 | Shackelford | 18 | Simulated | In-flight | Embase, Scopus, PubMed |
| [46] | 2003 | Smith | 8 | Simulated | In-flight, R+1, R+2-7 | Scopus, PubMed |
| Source | Sum of squares | DF | Mean square | F | P |
|---|---|---|---|---|---|
| ANOVA: analysis of variance; DF: degrees of freedom; PTH: parathyroid hormone. | |||||
| Time | 202.825 | 4 | 50.706 | 92.602 | < 0.01 |
| Condition | 51.013 | 1 | 51.013 | 93.162 | < 0.01 |
| Time × condition | 40.502 | 4 | 10.125 | 18.491 | < 0.05 |
| Residual | 215.197 | 144 | 1.4944 | ||
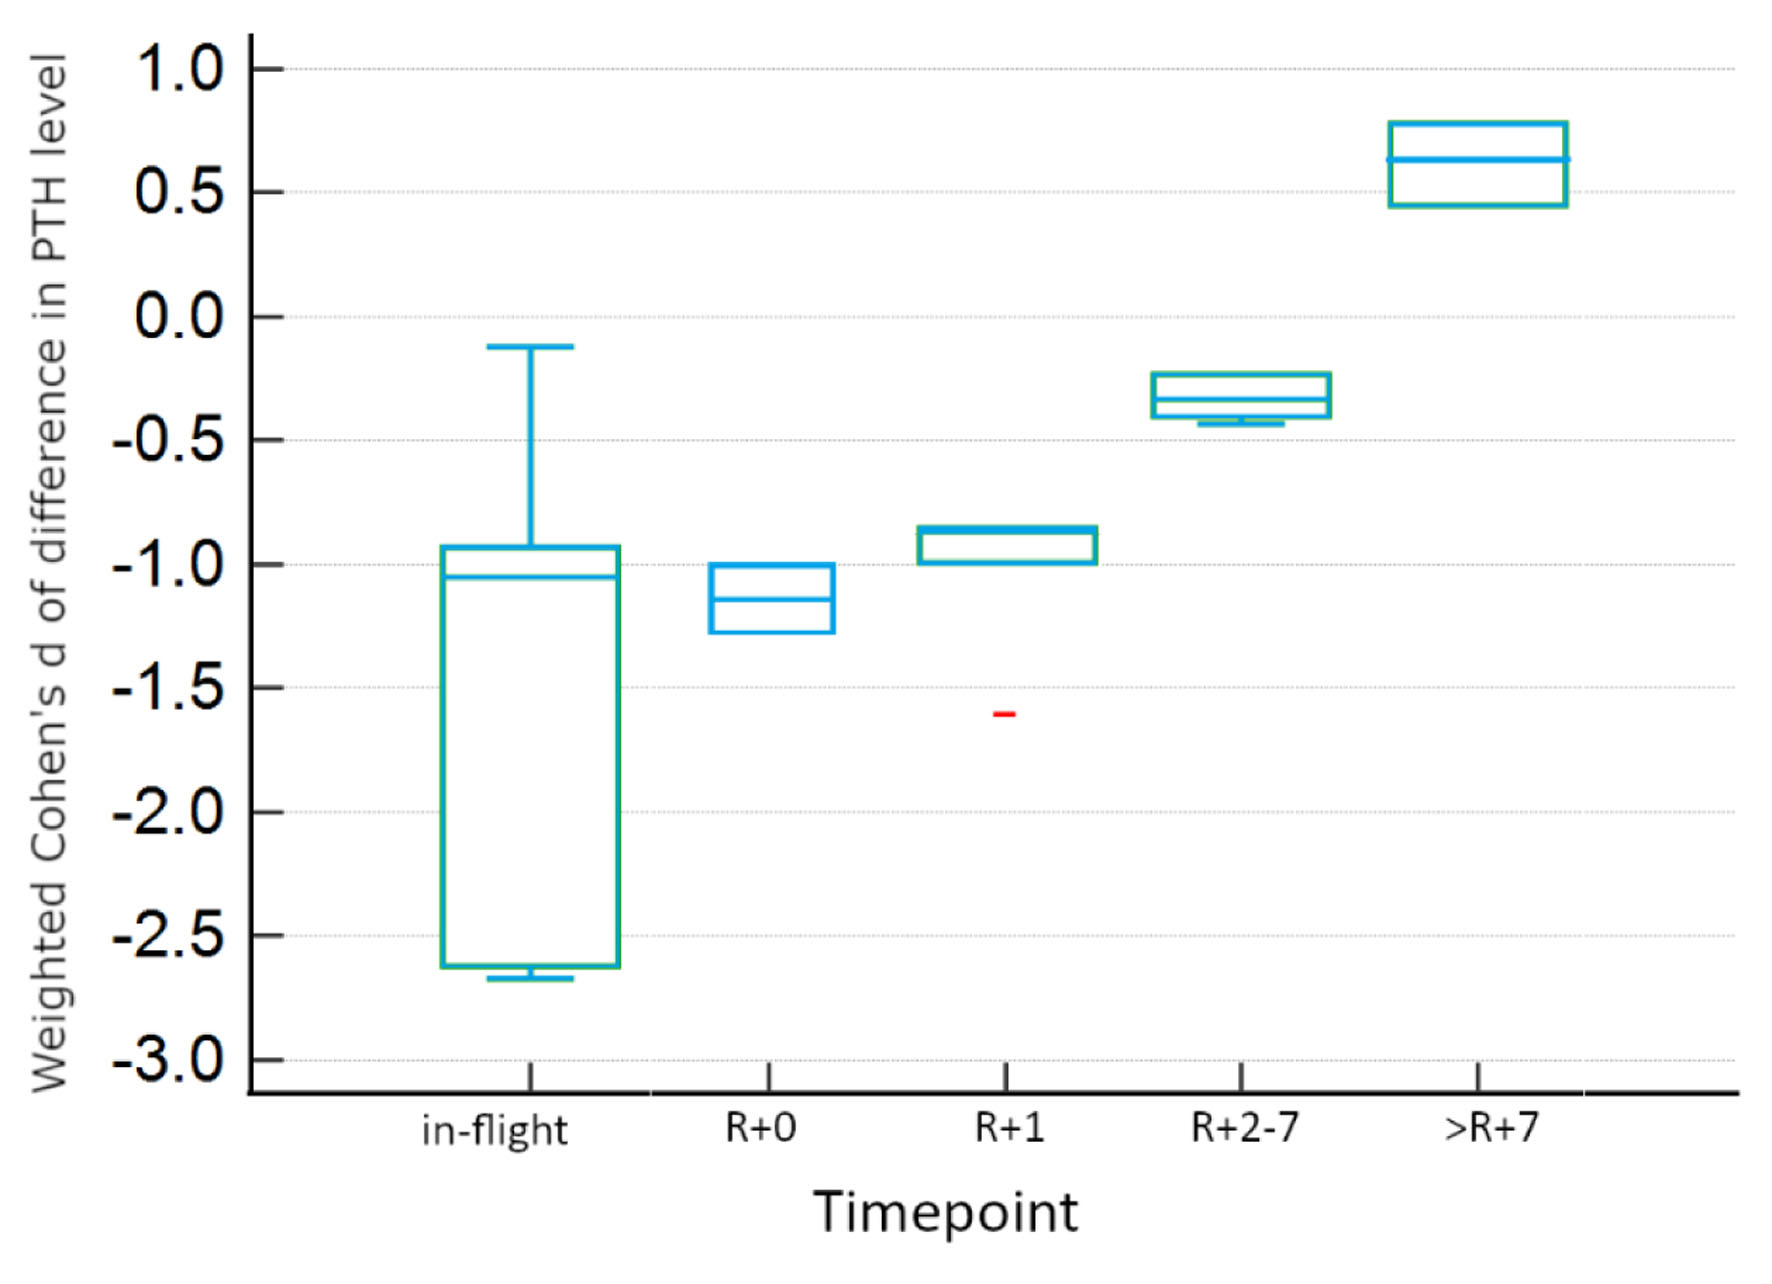
| Time | Condition | n | Mean | Standard error | 95% confidence interval |
|---|---|---|---|---|---|
| *Timepoints differ significantly (P < 0.05) by experimental condition. HSD: honestly significant difference. | |||||
| In-flight | Real | 19 | -1.5195 | 0.1698 | -1.8532 to -1.1857 |
| Simulated | 99 | -1.4803 | 0.07437 | -1.6265 to -1.3341 | |
| R+0* | Real | 28 | 0.1207 | 0.1398 | -0.1542 to 0.3956 |
| Simulated | 8 | -1.1400 | 0.2616 | -1.6544 to -0.6256 | |
| R+1* | Real | 25 | 1.1176 | 0.1480 | 0.8266 to 1.4086 |
| Simulated | 50 | -0.7226 | 0.1046 | -0.9283 to -0.5169 | |
| R+2-7* | Real | 31 | 0.8897 | 0.1329 | 0.6284 to 1.1510 |
| Simulated | 71 | -0.3001 | 0.08782 | -0.4728 to -0.1275 | |
| >R+7 | Real | 37 | 0.8681 | 0.1217 | 0.6289 to 1.1073 |
| Simulated | 35 | 0.6857 | 0.1251 | 0.4398 to 0.9316 | |
| Serum calcium | Urinary calcium | ||||
|---|---|---|---|---|---|
| Cond. (n) | # significant | In-flight x | Cond. (n) | # significant | In-flight x |
| Results are included from all studies as well as separated by microgravity condition. Data include the weighted average x of Cohen’s d and number of studies reporting significant change. Ionized calcium is not included due to a lack of data. | |||||
| All (11) | 3 | 0.300 | All (6) | 6 | 0.803 |
| Real (3) | 0 | -0.460 | Real (2) | 2 | 0.797 |
| Simulated (8) | 3 | 0.589 | Simulated (4) | 4 | 0.806 |
| Calcifediol | Calcitriol | ||||
|---|---|---|---|---|---|
| Cond. (n) | # significant | In-flight x | Cond. (n) | # significant | In-flight x |
| Results are included from all studies as well as separated by microgravity condition. Data include the weighted average x of Cohen’s d and number of studies reporting significant change. | |||||
| All (8) | 1 | 0.411 | All (9) | 6 | -0.960 |
| Real (4) | 0 | -0.313 | Real (4) | 1 | -0.208 |
| Simulated (4) | 1 | 0.738 | Simulated (5) | 5 | -1.220 |