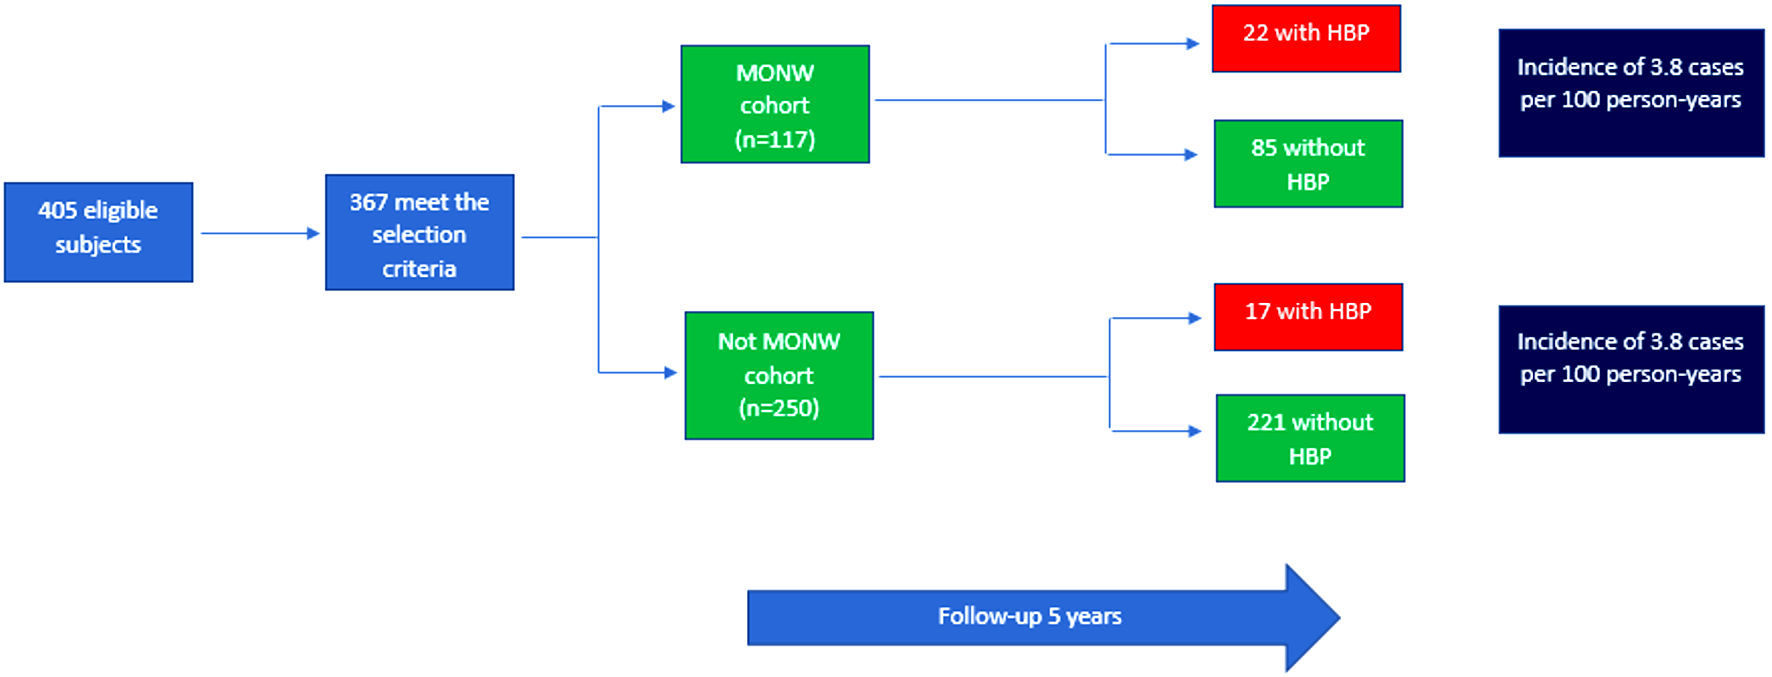
Figure 1. Reconstruction of cohorts from the PERU MIGRANT 2007 - 2008 study. HBP: high blood pressure; MONW: metabolically obese normal-weight.
| Journal of Endocrinology and Metabolism, ISSN 1923-2861 print, 1923-287X online, Open Access |
| Article copyright, the authors; Journal compilation copyright, J Endocrinol Metab and Elmer Press Inc |
| Journal website https://www.jofem.org |
Original Article
Volume 13, Number 1, February 2023, pages 13-19
Metabolically Obese Normal-Weight Phenotype as a Risk Factor for High Blood Pressure: A Five-Year Cohort
Figure
Tables
| Characteristics | N (%) |
|---|---|
| aDoes not add to 367 due to missing values. MONW: metabolically obese normal-weight. | |
| Sex | |
| Feminine | 161 (43.9) |
| Masculine | 206 (56.1) |
| Age group (years) | |
| 29 to 44 years old | 177 (48.2) |
| 45 to 59 years old | 133 (36.2) |
| 60 years old or older | 57 (15.5) |
| Migration group | |
| Rural | 145 (39.5) |
| Migrant | 171 (46.6) |
| Urban | 51 (13.9) |
| Physical activity levela | |
| Low | 67 (18.5) |
| Moderate | 80 (22.1) |
| High | 214 (59.4) |
| Currently smoker | |
| No | 322 (87.7) |
| Yes | 45 (12.3) |
| Alcohol consumption | |
| Low | 327 (89.1) |
| High | 40 (10.9) |
| MONW | |
| No | 250 (68.1) |
| Yes | 117 (31.9) |
| Characteristics | Development of arterial hypertension | Pa | |
|---|---|---|---|
| No (n = 306) | Yes (n = 39) | ||
| N (%) | N (%) | ||
| aChi-square of independence. MONW: metabolically obese normal-weight. | |||
| MONW | |||
| No | 221 (92.9) | 17 (7.1) | < 0.001 |
| Yes | 85 (79.4) | 22 (20.6) | |
| Sex | |||
| Feminine | 134 (88.2) | 18 (11.8) | 0.780 |
| Masculine | 172 (89.1) | 21 (10.9) | |
| Age group (years) | |||
| 29 to 44 years old | 157 (96.7) | 5 (3.1) | < 0.001 |
| 45 to 59 years old | 109 (85.8) | 18 (14.2) | |
| 60 years old or older | 40 (71.4) | 16 (28.6) | |
| Migration group | |||
| Rural | 122 (84.1) | 23 (15.9) | 0.042 |
| Migrant | 141 (93.4) | 10 (6.6) | |
| Urban | 43 (87.8) | 6 (12.2) | |
| Physical activity level | |||
| Low | 59 (95.2) | 3 (4.8) | 0.169 |
| Moderate | 63 (88.7) | 8 (11.3) | |
| High | 179 (86.5) | 28 (13.5) | |
| Currently smoker | |||
| No | 270 (89.1) | 33 (10.9) | 0.515 |
| Yes | 36 (85.7) | 6 (14.3) | |
| Alcohol consumption | |||
| Low | 277 (89.1) | 34 (10.9) | 0.509 |
| High | 29 (85.3) | 5 (14.7) | |
| RRc | 95% CI | P | RRaa | 95% CI | P* | |
|---|---|---|---|---|---|---|
| aAdjusted for age group, sex, migration group, level of physical activity, smoking status, and alcohol consumption. *Significant P value < 0.05. RRc: crude risk ratio; RRa: adjusted risk ratio; CI: confidence interval; MONW: metabolically obese normal-weight; HBP: high blood pressure. Elaboration: own source. | ||||||
| MONW | ||||||
| No | Reference | Reference | ||||
| Yes | 2.879 | 1.594 - 5.199 | < 0.001 | 2.055 | 1.118 - 3.777 | 0.020 |