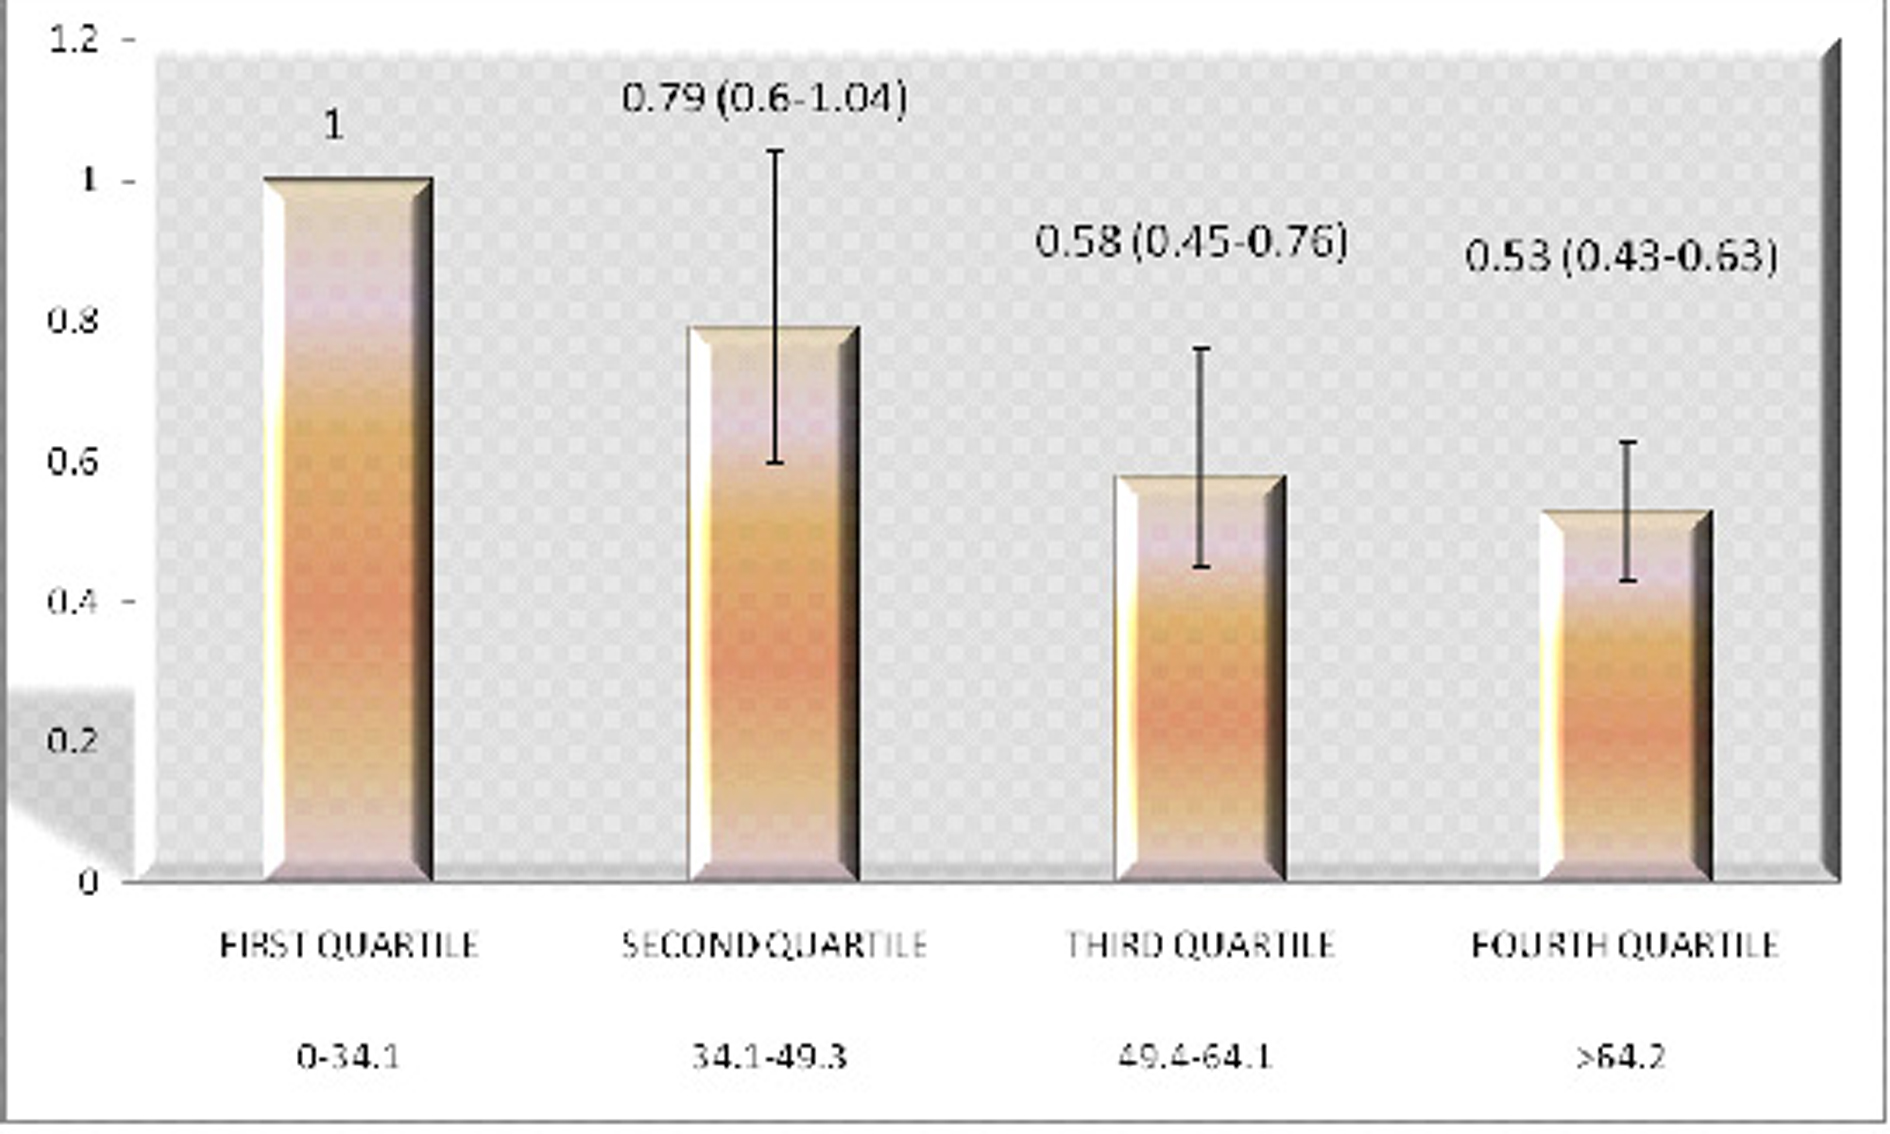
Figure 1. The adjusted odds ratios having diabetes in the four Quartiles of plasma Vitamin C levels. X Axis: Vitamin C levels in mmol/L; Y Axis: Odds Ratio.
| Journal of Endocrinology and Metabolism, ISSN 1923-2861 print, 1923-287X online, Open Access |
| Article copyright, the authors; Journal compilation copyright, J Endocrinol Metab and Elmer Press Inc |
| Journal website http://www.jofem.org |
Original Article
Volume 2, Number 2, April 2012, pages 66-71
An NHANES Analysis of 2005 - 2006 Data Examining the Relationship Between Diabetes Mellitus and Vitamin C Ingestion
Figures
Table
| Covariables | 1st Quartile Percentage (standard error) | 2nd Quartile Percentage (standard error) | 3rd Quartile Percentage (standard error) | 4th Quartile Percentage (standard error) |
|---|---|---|---|---|
| Age 20 – 40 yrs | 28.30 (2.25) | 19.45 (0.89) | 24.63 (1.57) | 27.62 (1.82) |
| Age 40 – 60 yrs | 31.33 (2.07) | 17.28 (0.94) | 22.99 (1.62) | 28.41 (1.43) |
| Age > 60 yrs | 24.31 (1.48) | 11.80 (1.07) | 18.45 (1.37) | 45.45 (1.32) |
| Non Black | 28.66 (1.59) | 16.17 (0.62) | 22.30 (1.29) | 32.87 (1.14) |
| Black | 27.86 (2.10) | 22.00 (2.01) | 24.59 (1.31) | 25.54 (1.93) |
| Male | 32.15 (1.74) | 19.29 (1.25) | 22.74 (1.10) | 25.83 (1.22) |
| Female | 25.24 (1.49) | 14.58 (1.00) | 22.41 (1.48) | 37.77 (1.63) |
| Less than high school | 35.34 (2.11) | 18.55 (1.16) | 20.53 (1.61) | 25.58 (1.47) |
| Greater than high school | 27.09 (1.35) | 16.47 (0.78) | 23.01 (1.21) | 33.43 (1.16) |
| Unmarried | 30.84 (1.48) | 18.52 (1.02) | 23.09 (1.40) | 27.55 (0.92) |
| Married | 26.88 (1.86) | 15.61 (0.65) | 22.18 (1.36) | 35.33 (1.33) |
| Income Level Low | 32.49 (1.86) | 16.51 (1.09) | 22.22 (1.56) | 28.78 (1.00) |
| Income Level Medium | 28.96 (2.13) | 18.42 (0.82) | 22.05 (1.75) | 30.56 (2.17) |
| Income Level High | 25.59 (1.74) | 15.87 (1.05) | 23.42 (1.23) | 35.12 (1.54) |
| No Alcohol | 29.78 (1.78) | 17.63 (0.72) | 22.89 (1.34) | 29.70 (1.11) |
| Moderate or (vere Alcohol) | 24.36 (1.55) | 14.13 (1.09) | 21.43 (1.14) | 40.08 (1.58) |
| BMI Normal | 25.64 (2.18) | 13.89 (0.98) | 19.70 (1.90) | 40.77 (1.54) |
| BMI Overweight | 25.49 (1.15) | 16.55 (1.35) | 24.35 (1.49) | 33.71 (1.49) |
| BMI Obese | 34.45 (1.82) | 20.10 (1.01) | 23.84 (1.26) | 21.62 (1.08) |
| No Hypertension | 28.27 (1.61) | 16.67 (0.67) | 22.96 (1.18) | 32.10 (1.20) |
| Hypertension | 30.07 (1.62) | 17.73 (1.53) | 20.57 (1.84) | 31.63 (1.52) |
| No Diabetes | 27.66 (1.52) | 16.72 (0.58) | 22.93 (1.19) | 32.66 (1.15) |
| Diabetes | 37.30 (1.24) | 17.73 (1.78) | 19.01 (1.66) | 25.96 (2.09) |
| Waist Circumference Less than 88 cm in females or 102 cm in males | 26.82 (1.75) | 15.89 (0.87) | 32.29 (1.23) | 35.00 (1.50) |
| Waist Circumference greater than or equal to 88 cm in females or 102 cm in males | 30.29 (1.36) | 17.79 (1.01) | 22.84 (1.41) | 29.08 (0.94) |
| Triglycerides Less than 150 mg/dL | 28.41 (2.03) | 15.74 (1.02) | 21.71 (1.33) | 34.14 (1.23) |
| Triglycerides Greater than or equal to 150 mg/dL | 28.86 (1.73) | 18.92 (1.00) | 24.19 (1.57) | 28.04 (1.24) |
| Uric acid Less than 7.8 mg/dL | 28.41 (2.03) | 15.74 (1.02) | 21.71 (1.33) | 34.14 (1.23) |
| Uric acid Greater than 7.8 mg/dL | 34.27 (3.41) | 21.22 (2.82) | 27.09 (2.05) | 17.42 (3.05) |