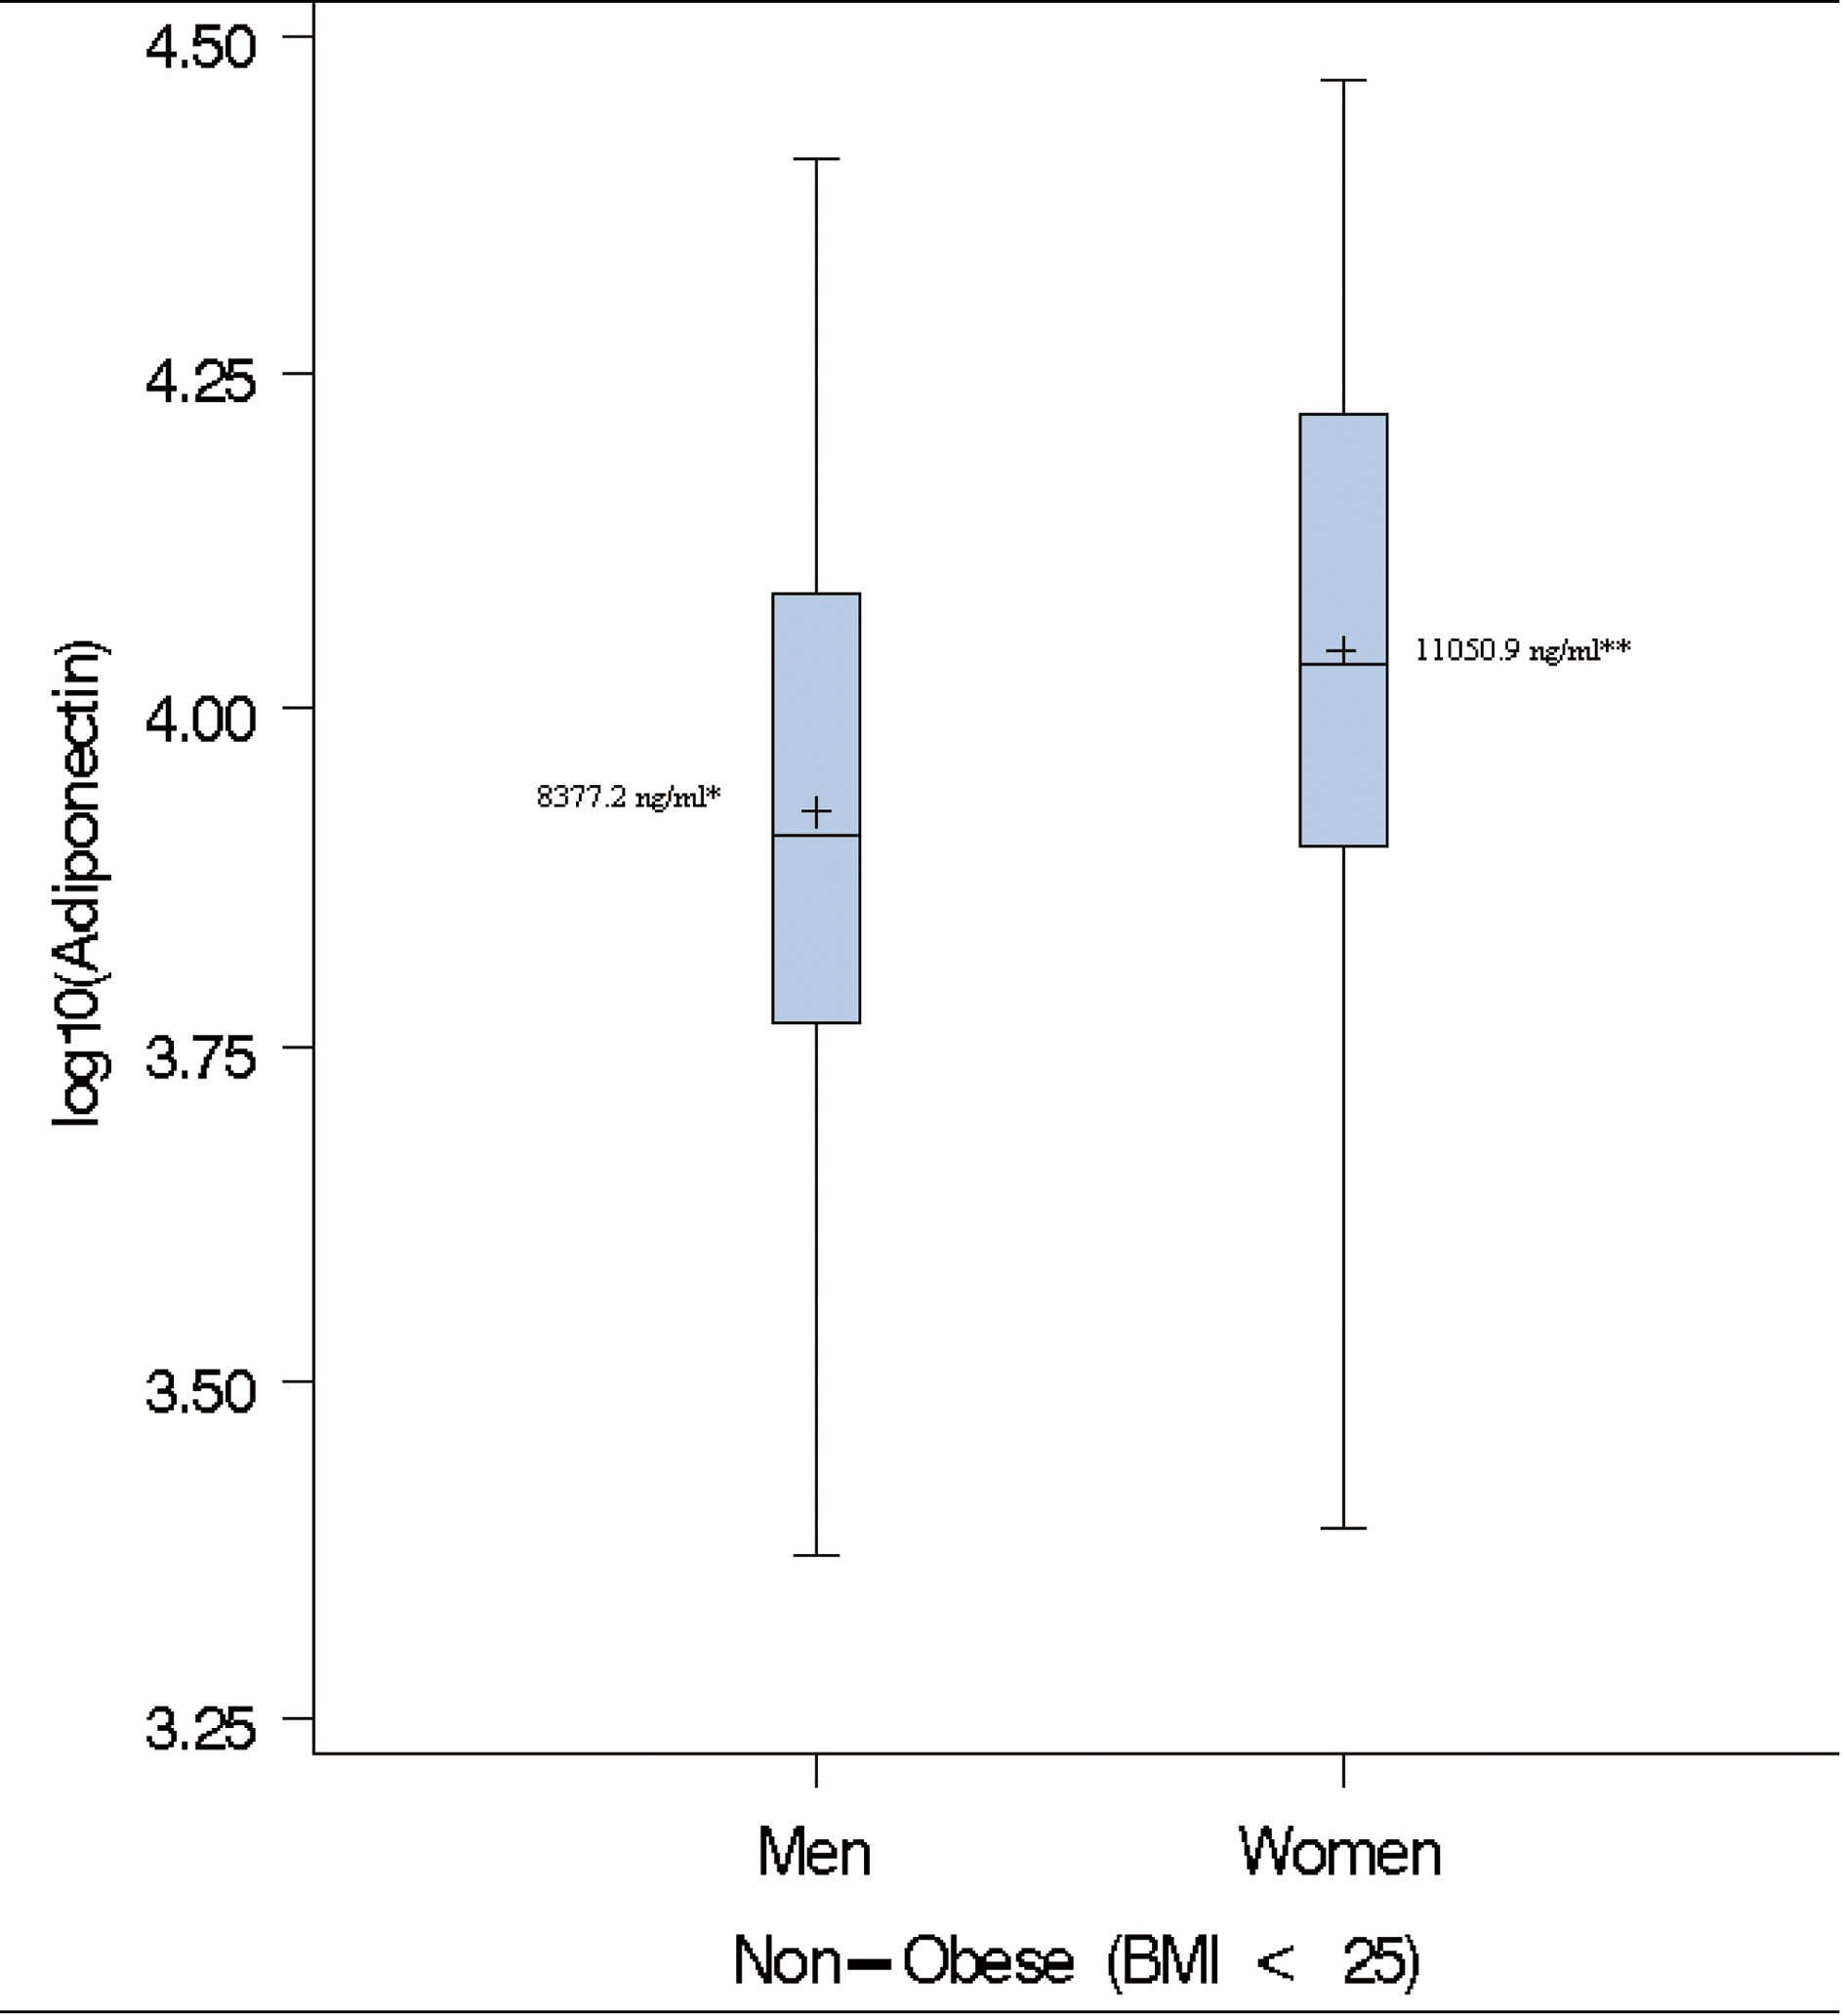
Figure 1. Box-plots of log adiponectin in lean individuals. ( + ) denotes the geometric mean; * Cut-off used to define paradoxical hyperadiponectinemia in Men; ** Cut-off used to define paradoxical hyperadiponectinemia in Women.
| Journal of Endocrinology and Metabolism, ISSN 1923-2861 print, 1923-287X online, Open Access |
| Article copyright, the authors; Journal compilation copyright, J Endocrinol Metab and Elmer Press Inc |
| Journal website http://www.jofem.org |
Original Article
Volume 2, Number 2, April 2012, pages 51-65
Paradoxical Hyperadiponectinemia is Associated With the Metabolically Healthy Obese (MHO) Phenotype in African Americans
Figures
Tables
| Variable | Men (n = 364) | Women (n = 458 ) | P-value |
|---|---|---|---|
| Data is presented as mean ± standard deviation; values in parenthesis ( ) are geometric means when variables were not normally distributed; t-student test was used to assess difference between men and women. | |||
| Age (years) | 43.9 ± 10.9 | 42.8 ± 10.7 | 0.13 |
| BMI (kg/m2) | 27.9 ± 6.8 | 31.3 ± 8.8 | 6.5 × 10⁻¹⁰ |
| PFM | 27.9 ± 9.2 | 41.1 ± 9.3 | 8.7 × 10-73 |
| WC (cm) | 93.3 ± 15.9 | 94.35 ± 16.87 | 0.35 |
| WHR | 0.89 ± 0.07 | 0.84 ± 0.07 | 2.5 × 10⁻²⁶ |
| Glucose (mg/dL) | 86.3 ± 12.3 | 83.7 ± 10.2 | 0.001 |
| Insulin (µU/mL) | |||
| Mean | 10.7 ± 13.2 | 12.3 ± 18.2 | 0.16 |
| Geometric mean | 6.6 | 8.1 | |
| Median (IQR) | 7.4 (9.5) | 7.8 (9.2) | |
| HOMA-IR | |||
| Mean | 2.5 ± 3.6 | 2.7 ± 4.7 | 0.46 |
| Geometric mean | 1.4 | 1.7 | |
| Median (IQR) | 1.6 (2.1) | 1.6 (2.1) | |
| HDL-C (mg/dL) | 52.9 ± 19.2 | 54.7 ± 16.8 | 0.15 |
| LDL-C (mg/dL) | 111.6 ± 40.8 | 116.8 ± 38.1 | 0.06 |
| TG (mg/dL) | |||
| Mean | 111.3 ± 69.6 | 100.72 ± 68.5 | 0.03 |
| Geometric mean | 97.7 | 87.1 | |
| Median (IQR) | 95 (62) | 83 (54) | |
| Total cholesterol (mg/dL) | 187.0 ± 44.9 | 192.4 ± 42.6 | 0.08 |
| Adiponectin (ng/mL) | |||
| Mean | 7855.2 ± 4704.0 | 9186.3 ± 5551.8 | 0.0002 |
| Geometric mean | 6760.8 | 7762.4 | |
| Median (IQR) | 6527.9 (5853) | 7734.7 (6983) | |
| Hypertension (%) | 36.8 | 32.5 | |
| SBP (mmHg) | 130.1 ± 19.4 | 82.0 ± 13.6 | 0.003 |
| DBP (mmHg) | 126.1 ± 18.3 | 79.8 ± 11.8 | 0.016 |
| Variables | Men (n = 110) | Females (n =233) | P-value |
|---|---|---|---|
| Data is presented as mean ± standard deviation; values in parenthesis ( ) are geometric means when variables were not normally distributed; Student's t-test was used to assess difference between men and women. | |||
| Age (years) | 42.9 ± 10.5 | 42.8 ± 9.8 | 0.95 |
| BMI (kg/m 2 ) | 35.7 ± 6.5 | 38.0 ± 7.0 | 0.004 |
| PFM | 36.0 ± 7.5 | 46.6 ± 6.4 | 0.000 |
| WC (cm) | 110.9 ± 14.4 | 106.0 ± 13.4 | 0.002 |
| WHR | 0.94 ± 0.06 | 0.85 ± 0.07 | < 0.0001 |
| SBP (mmHg) | 131.8 ± 17.4 | 129.4 ± 18.5 | 0.26 |
| DBP (mmHg) | 83.4 ± 11.0 | 81.0 ± 11.6 | 0.08 |
| Glucose (mg/dL) | 90.9 ± 12.3 | 86.0 ± 9.8 | < 0.0001 |
| Insulin (µU/mL) | 16.8 ± 18.9 (12.6) | 16.4 ± 23.7 (11.5) | 0.87 |
| HOMA-IR | 4.01 ± 5.4 (2.7) | 3.7 ± 6.3 (2.4) | 0.61 |
| HDL-C (mg/dL) | 43.8 ± 11.3 | 51 ± 15.3 | < 0.0001 |
| LDL-C (mg/dL) | 126.7 ± 44.4 | 120.3 ± 39.5 | 0.18 |
| TG (mg/dL) | 128.2 ± 77.9 (109.6) | 105.1 ± 63.8 (93.3) | 0.007 |
| Total cholesterol (mg/dL) | 196.1 ± 47.7 | 192.3 ± 43.8 | 0.46 |
| Adiponectin (ng/mL) | 6023.8 ±3227.1 (5248.1) | 7541.2 ±4759.0 (6309.6) | 0.001 |
| Variable | Men | Women | ||||
|---|---|---|---|---|---|---|
| Obese without PHA n = 89 | Obese with PHA n = 21 | P-value | Obese without PHA (n = 188) | Obese with PHA (n = 45) | P-value | |
| Data is presented as mean ± standard deviation; values in parenthesis ( ) are geometric means when variables were not normally distributed. In females: “obese without PHA” was defined as adiponectin level below 11050.9 ng/mL and obese with PHA was defined as adiponectin level above 11050.9 ng/mL; In males: “Obese without PHA” was defined as adiponectin level below 8377.2 ng/mL and “Obese with PHA” was defined as adiponectin level above 8377.2 ng/mL; Student -t tests were used to compare means between “obese without PHA” and “obese with PHA” within gender. | ||||||
| Age (years) | 42.3 ± 10.6 | 45.3 ± 10.2 | 0.25 | 41.9 ± 9.8 | 46.7 ± 8.9 | 0.003 |
| BMI (kg/m2) | 35.9 ± 6.6 | 34.8 ± 6.7 | 0.48 | 38.5 ± 7.3 | 35.9 ± 5.4 | 0.007 |
| PFM | 36.0 ± 7.0 | 36.3 ± 9.7 | 0.86 | 46.7 ± 6.5 | 46.2 ± 6.3 | 0.67 |
| WC (cm) | 111.7 ± 14.2 | 107.5 ± 15.3 | 0.23 | 107.5 ± 13.4 | 99.8 ± 11.8 | 0.0005 |
| WHR | 0.94 ± 0.06 | 0.92 ± 0.06 | 0.10 | 0.86 ± 0.07 | 0.84 ± 0.08 | 0.08 |
| SBP (mmHg) | 131.4 ± 16.9 | 133.2 ± 19.7 | 0.68 | 129.1 ± 18.8 | 130.6 ± 17.4 | 0.62 |
| DBP (mmHg) | 83.1 ± 10.5 | 84.5 ± 13.3 | 0.60 | 80.7 ± 11.7 | 82.2 ± 11.4 | 0.45 |
| Glucose (mg/dL) | 91.8 ± 12.4 | 87.2 ± 11.3 | 0.13 | 86.9 ± 10.0 | 82.23 ± 8.11 | 0.004 |
| Insulin (µU/mL) | 17.9 ± 20.6 (13.2) | 12.3 ± 7.5 (10.2) | 0.04 | 18.4 ± 26.0 (12.9) | 8.3 ± 4.5 (6.9) | 1.2 × 10-06 |
| HOMA-IR | 4.3 ± 5.9 (3.0) | 2.7 ± 1.8 (2.2) | 0.03 | 4.14 ± 6.89 (2.8) | 1.68 ± 0.9 (1.4) | 4.8 × 10-06 |
| HDL (mg/dL) | 41.8 ± 9.8 | 52.2 ± 13.4 | 0.002 | 48.1 ± 14.4 | 62.8 ± 13.4 | 2.13 × 10-09 |
| LDL-C (mg/dL) | 125.7 ± 43.9 | 130.9 ± 50.7 | 0.63 | 120.7 ± 38.5 | 118.5 ± 43.7 | 0.74 |
| TG (mg/dL) | 131.5 ± 79.0 (114.8) | 114.2 ± 73.0 (97.7) | 0.36 | 109.8 ± 68.2 (97.7) | 85.4 ± 34.2 (79.4) | 0.0008 |
| Total Cholesterol (mg/dL) | 193.8 ± 45.7 | 206.0 ± 55.82 | 0.30 | 190.8 ± 42.9 | 198.4 ± 47.3 | 0.30 |
| Adiponectin (ng/mL) | 4772.7 ± 1746.7 (4466.8) | 11352.1 ± 2561.0 (11220.2) | 4.0 × 10⁻¹¹ | 5648.4 ± 2283.0 (5128.6) | 15449.2 ± 4242.3 (14791.1) | 3.5 × 10⁻²⁰ |
| Variable | Men | Women | ||||
|---|---|---|---|---|---|---|
| Non MHO (n = 78) | MHO (n = 32) | P-value | Non MHO (n = 169) | MHO (n = 64) | P-value | |
| Data is presented as mean ± standard deviation; values in parenthesis ( ) are geometric means when variables were not normally distributed. Student-t tests were used to compare means between “metabolically healthy obese” and “non metabolically healthy obese” within gender. | ||||||
| AGE (years) | 43.1 ± 9.7 | 42.3 ± 12.5 | 0.70 | 43.1 ± 9.6 | 42.2 ± 10.5 | 0.55 |
| BMI (kg/m2) | 36.3 ± 7.3 | 34.2 ± 3.7 | 0.05 | 38.4 ± 7.2 | 37.0 ± 6.4 | 0.18 |
| PFM | 36.3 ± 7.9 | 35.2 ± 6.6 | 0.49 | 46.6 ± 6.4 | 46.6 ± 6.6 | 0.99 |
| WC (cm) | 112.1 ± 15.5 | 107.9 ± 10.9 | 0.11 | 107.4 ± 13.7 | 102.3 ± 12.2 | 0.01 |
| WHR | 0.94 ± 0.06 | 0.94 ± 0.06 | 0.60 | 0.87 ± 0.07 | 0.83 ± 0.08 | < 0.0001 |
| SBP (mmHg) | 137.2 ± 17.4 | 118.4 ± 7.1 | < 0.0001 | 134.0 ± 19.5 | 117.2 ± 6.9 | < 0.0001 |
| DBP(mmHg) | 87.1 ± 10.2 | 74.2 ± 7.0 | < 0.0001 | 83.4 ± 12.6 | 74.8 ± 5.0 | < 0.0001 |
| GLUCOSE (mg/dL) | 91.3 ± 12.6 | 90.1 ± 11.7 | 0.65 | 86.2 ± 10.1 | 85.4 ± 9.04 | 0.55 |
| Insulin (µU/mL) | 18.8 ± 21.7 (13.5) | 11.8 ± 6.4 (10) | 0.01 | 17.4 ± 26.3 (11.7) | 13.8 ± 15.04 (10.2) | 0.19 |
| HOMA-IR | 4.6 ± 6.3 (3.0) | 2.7 ± 1.5 (2.2) | 0.01 | 3.9 ± 7.0 (2.4) | 3.0 ± 3.9 (2.1) | 0.23 |
| HDL-C (mg/dL) | 41 ± 11.1 | 50.4 ± 9.0 | < 0.0001 | 47.1 ± 15.5 | 61.3 ± 8.5 | < 0.0001 |
| LDL-C (mg/dL) | 123.8 ± 42.3 | 133.9 ± 49.0 | 0.28 | 121.9 ± 38.9 | 116 ± 40.9 | 0.30 |
| TG (mg/dL) | 135.6 ± 85.4 (117.5) | 110.2 ± 52.3 (97.7) | 0.06 | 113.3 ± 70.0 (100) | 83.2 ± 34.9 (77.6) | < 0.0001 |
| Total cholesterol (mg/dl) | 191.9 ± 44.34 | 206.3 ± 54.6 | 0.15 | 191.7 ± 43.5 | 193.9 ± 44.9 | 0.73 |
| Adiponectin (ng/mL) | 5508.2 ± 2646.6 (4897.8) | 7297.7 ± 4108.0 (6309.6) | 0.03 | 6974.7 ± 4193.6 (5888.5) | 9037.2 ± 5776.8 (7585.8) | 0.01 |
| Dependant variable: MHO (yes = 1; no = 0) | ||||
|---|---|---|---|---|
| Gender | PHA: yes/no (covariates) | B ± S.E. | OR (95% CI) | P-value |
| B: coefficient, S.E. standard error of B, OR: estimated odds ratio, CI: confidence interval of OR; HTN: hypertension (0 = no hypertension, 1 = hypertension), WC = waist circumference, INS =log - insulin; ¥ PHA status was coded 1, if adiponectin level is above 8377.2 ng / mL and 11050.9 ng / mL for men and women respectively; or 0, if adiponectin level is below 8377.2 ng / mL and 11050.9 ng / mL for men and women respectively. * Denote significant P-value (P < 0.05) | ||||
| Men | PHA ¥ | 1.01 ± 0.50 | 2.8 (1.03 - 7.40) | 0.04* |
| PHA ¥ ( age) | 1.10 ± 0.51 | 2.9 (1.1 - 7.80) | 0.04* | |
| PHA ¥ (age, HTN) | 1.30 ± 0.56 | 3.5 (1.2 - 10.55) | 0.03* | |
| PHA ¥ (age, HTN, WC) | 1.20 ± 0.57 | 3.3 (1.1 - 10.02) | 0.04* | |
| PHA ¥ (age, HTN, WC, INS) | 1.30 ± 0.59 | 3.6 (1.1 - 11.5) | 0.03* | |
| Women | PHA ¥ | 0.72 ± 0.35 | 2.1 (1.04 - 4.10) | 0.04* |
| PHA ¥ (age) | 0.80 ± 0.4 | 2.2 (1.10 - 4.51) | 0.03* | |
| PHA ¥ (age, HTN) | 0.90 ± 0.39 | 2.4 (1.10 - 5.03) | 0.03* | |
| PHA ¥ (age, HTN, WC) | 0.65 ± 0.40 | 1.9 (0.90 - 4.20) | 0.10 | |
| PHA ¥ (age, HTN, WC, INS) | 0.61 ± 0.41 | 1.8 (0.80 - 4.12) | 0.14 | |