


| Journal of Endocrinology and Metabolism, ISSN 1923-2861 print, 1923-287X online, Open Access |
| Article copyright, the authors; Journal compilation copyright, J Endocrinol Metab and Elmer Press Inc |
| Journal website https://www.jofem.org |
Original Article
Volume 14, Number 1, February 2024, pages 1-12

Associations Between Type 2 Diabetes Subtypes and Complications: Analysis of the Malaysia National Diabetes Registry
Rasa Kazlauskaitea ![]() , Nathan Ellermeierb, f
, Nathan Ellermeierb, f ![]() , Carrie Ngongoc
, Carrie Ngongoc ![]() , Arunah Chandrand
, Arunah Chandrand ![]() , Pankaja Desaie
, Pankaja Desaie ![]() , Ethan Ritze
, Ethan Ritze ![]() , Rachel Nugentc
, Rachel Nugentc ![]() , Feisul Idzwan Mustaphad
, Feisul Idzwan Mustaphad ![]()
aDepartment of Medicine, Rush University Medical Center, Chicago, IL 60612, USA
bRTI International, Geospatial Science and Technology, Research Triangle Park, NC 27709, USA
cRTI International, Global Health Division, Research Triangle Park, NC 27709, USA
dDisease Control Division, Ministry of Health Malaysia, Putrajaya 62590, Malaysia
eDepartment Internal Medicine, Rush University Medical Center, Chicago, IL 60612, USA
fCorresponding Author: Nathan Ellermeier, RTI International, Geospatial Science and Technology, Research Triangle Park, NC 27709, USA
Manuscript submitted August 22, 2023, accepted November 15, 2023, published online December 9, 2023
Short title: Subtyping Type 2 Diabetes in Malaysia
doi: https://doi.org/10.14740/jem879
| Abstract | ▴Top |
Background: The aim of the study was to investigate type 2 diabetes (DM2) subtypes and associations with complications in a multiethnic Asian population.
Methods: Analytical cohort (n = 60,946), extracted from 2019 Malaysia National Diabetes Registry, included 63.8% Malay, 16.7% Chinese, 11.3% Indian, and 11.3% other. A K-means cluster analysis was performed with complete data on six variables: age, DM2 duration, body mass index, metabolic syndrome severity, triglyceride-glucose index, and glycated hemoglobin. Separate Cox regression models and time-to-event analysis (from DM2 diagnosis) assessed the hazard ratio (HR) and time-to-complications, adjusting for sex, age, and ethnicity.
Results: Four clusters emerged: mild age-related diabetes (MARD) in 21,059 (35.6%), severe insulin-deficient diabetes (SIDD) in 11,751 (19.3%), mild obesity-related diabetes (MOD) in 14,700 (24.1%), and severe insulin-resistant diabetes (SIRD) in 13,436 (22.0%). Each cluster was compared to MARD. SIDD had later-onset and lowest HR for chronic kidney disease (CKD) (HR 0.25 (0.24 - 0.26)), retinopathy (HR 0.28 (0.27 - 0.30)), cerebrovascular disease (HR 0.57 (0.47 - 0.69)), and ischemic heart disease (HR 0.83 (0.76 - 0.91)). MOD had lowest HR (0.53 (0.34 - 0.84)) for limb amputations, and low HR for CKD, retinopathy, and cerebrovascular disease. SIRD had highest HR (1.43 (1.13 - 1.81)) for foot ulcers, and low HR (0.59 (0.56 - 0.63)) for retinopathy and CKD (HR 0.77 (0.74 - 0.80)). Known severe CKD cases were excluded from National Diabetes Registry.
Conclusions: DM2 subtypes associate differently with complications in Malaysia, similar to patterns found in European cohorts. DM2 subtypes complications, particularly for advanced CKD, are affected by registry-related selection bias and deserve further longitudinal investigation.
Keywords: Diabetes subtypes; Cluster analysis; Ethnic diversity
| Introduction | ▴Top |
Data-driven approaches have been applied to study heterogeneity of type 2 diabetes (DM2) based on pathophysiological, molecular, and genetic profiles [1, 2]. Recently, five subtypes of DM2 have been identified in European studies [3-5] and validated in other cohorts [6]. Five subtypes (Table 1), severe autoimmune diabetes (SAID), mild age-related diabetes (MARD), mild obesity-related diabetes (MOD), severe insulin-resistant diabetes (SIRD), or severe insulin-deficient diabetes (SIDD) [3], have been identified based on autoimmunity, age at diagnosis, adiposity, glycemia, relative beta-cell dysfunction, and insulin resistance [6]. Significantly, these subtypes had differential associations with the onset of diabetes complications in European cohorts [3, 4]. Identifying diabetes subtypes is essential for precision medicine on pathophysiology, treatment selection, and complication prevention, with implications for research, clinical practice, and public health.
 Click to view | Table 1. DM Subtype Characteristics |
The prevalence of diabetes (18.3%) differs among ethnic groups in Malaysia, with ethnic Indians having the highest prevalence (31.4%), followed by Malays (21.6%) and ethnic Chinese (15.4%). There is also evidence of ethnic differences in the prevalence of complications [7]. Yet, DM2 subtypes and associations with complications are inadequately investigated in Asia-Pacific populations [8]. Heterogeneity of Asia-Pacific populations suggests the need to explore diabetes subtyping based on diabetes features in addition to ethnicity.
This study examined data from the Malaysian National Diabetes Registry (NDR) to identify DM2 subtypes in a multi-ethnic Malaysian population and explored the relationship of the subtypes to diabetes complications [7].
| Materials and Methods | ▴Top |
Institutional Review Board approval
The study was approved by Malaysian Ministry of Health Medical Research and Ethics Committee (NMRR-21-172-58258 (IIR)).
Ethical Compliance
This study is a secondary analysis of national registry data. Data collection was conducted in compliance with the ethical standards of the responsible institution on human subjects.
Registry
The Malaysia NDR was established in 2011 to support the optimal clinical care of patients with DM2 in public primary care facilities nationwide, in all 13 states and three federal territories. Since its establishment, the NDR has registered 1.69 million ethnically diverse Malaysians, consisting primarily of Malays, ethnic Chinese, and ethnic Indians. This rich longitudinal database enables program managers to monitor glycemic control and track specific clinical outcomes and complication screening rates at the national, state, district, and facility levels [9]. The registry database includes two major components: a patient registry and an annual clinical audit dataset. The annual clinical audit dataset is a randomly sampled subset of the DM2 patient registry, including sociodemographic, clinical, and outcome variables. The sample size is typically determined at the district level based on the number of DM2 patients, although some states sample at the clinic level for comparability between health clinics. This variation creates some sample size differences at the state and district levels. Sampling is required to minimize data collection and entry work burden since the health clinics use paper-based medical records.
Analytical cohort
We used the 2019 NDR audit dataset (n = 181,635). After excluding outliers (n = 1,459), incomplete metabolic syndrome data (n = 116,939), and incomplete glycated hemoglobin (A1c) and body mass index (BMI) data (n = 2,291), the analytical cohort for cluster analysis (see below) constituted 60,946 cases (Table 2 and Fig. 1).
Click to view | Table 2. Characteristics of Patients With Type 2 Diabetes |
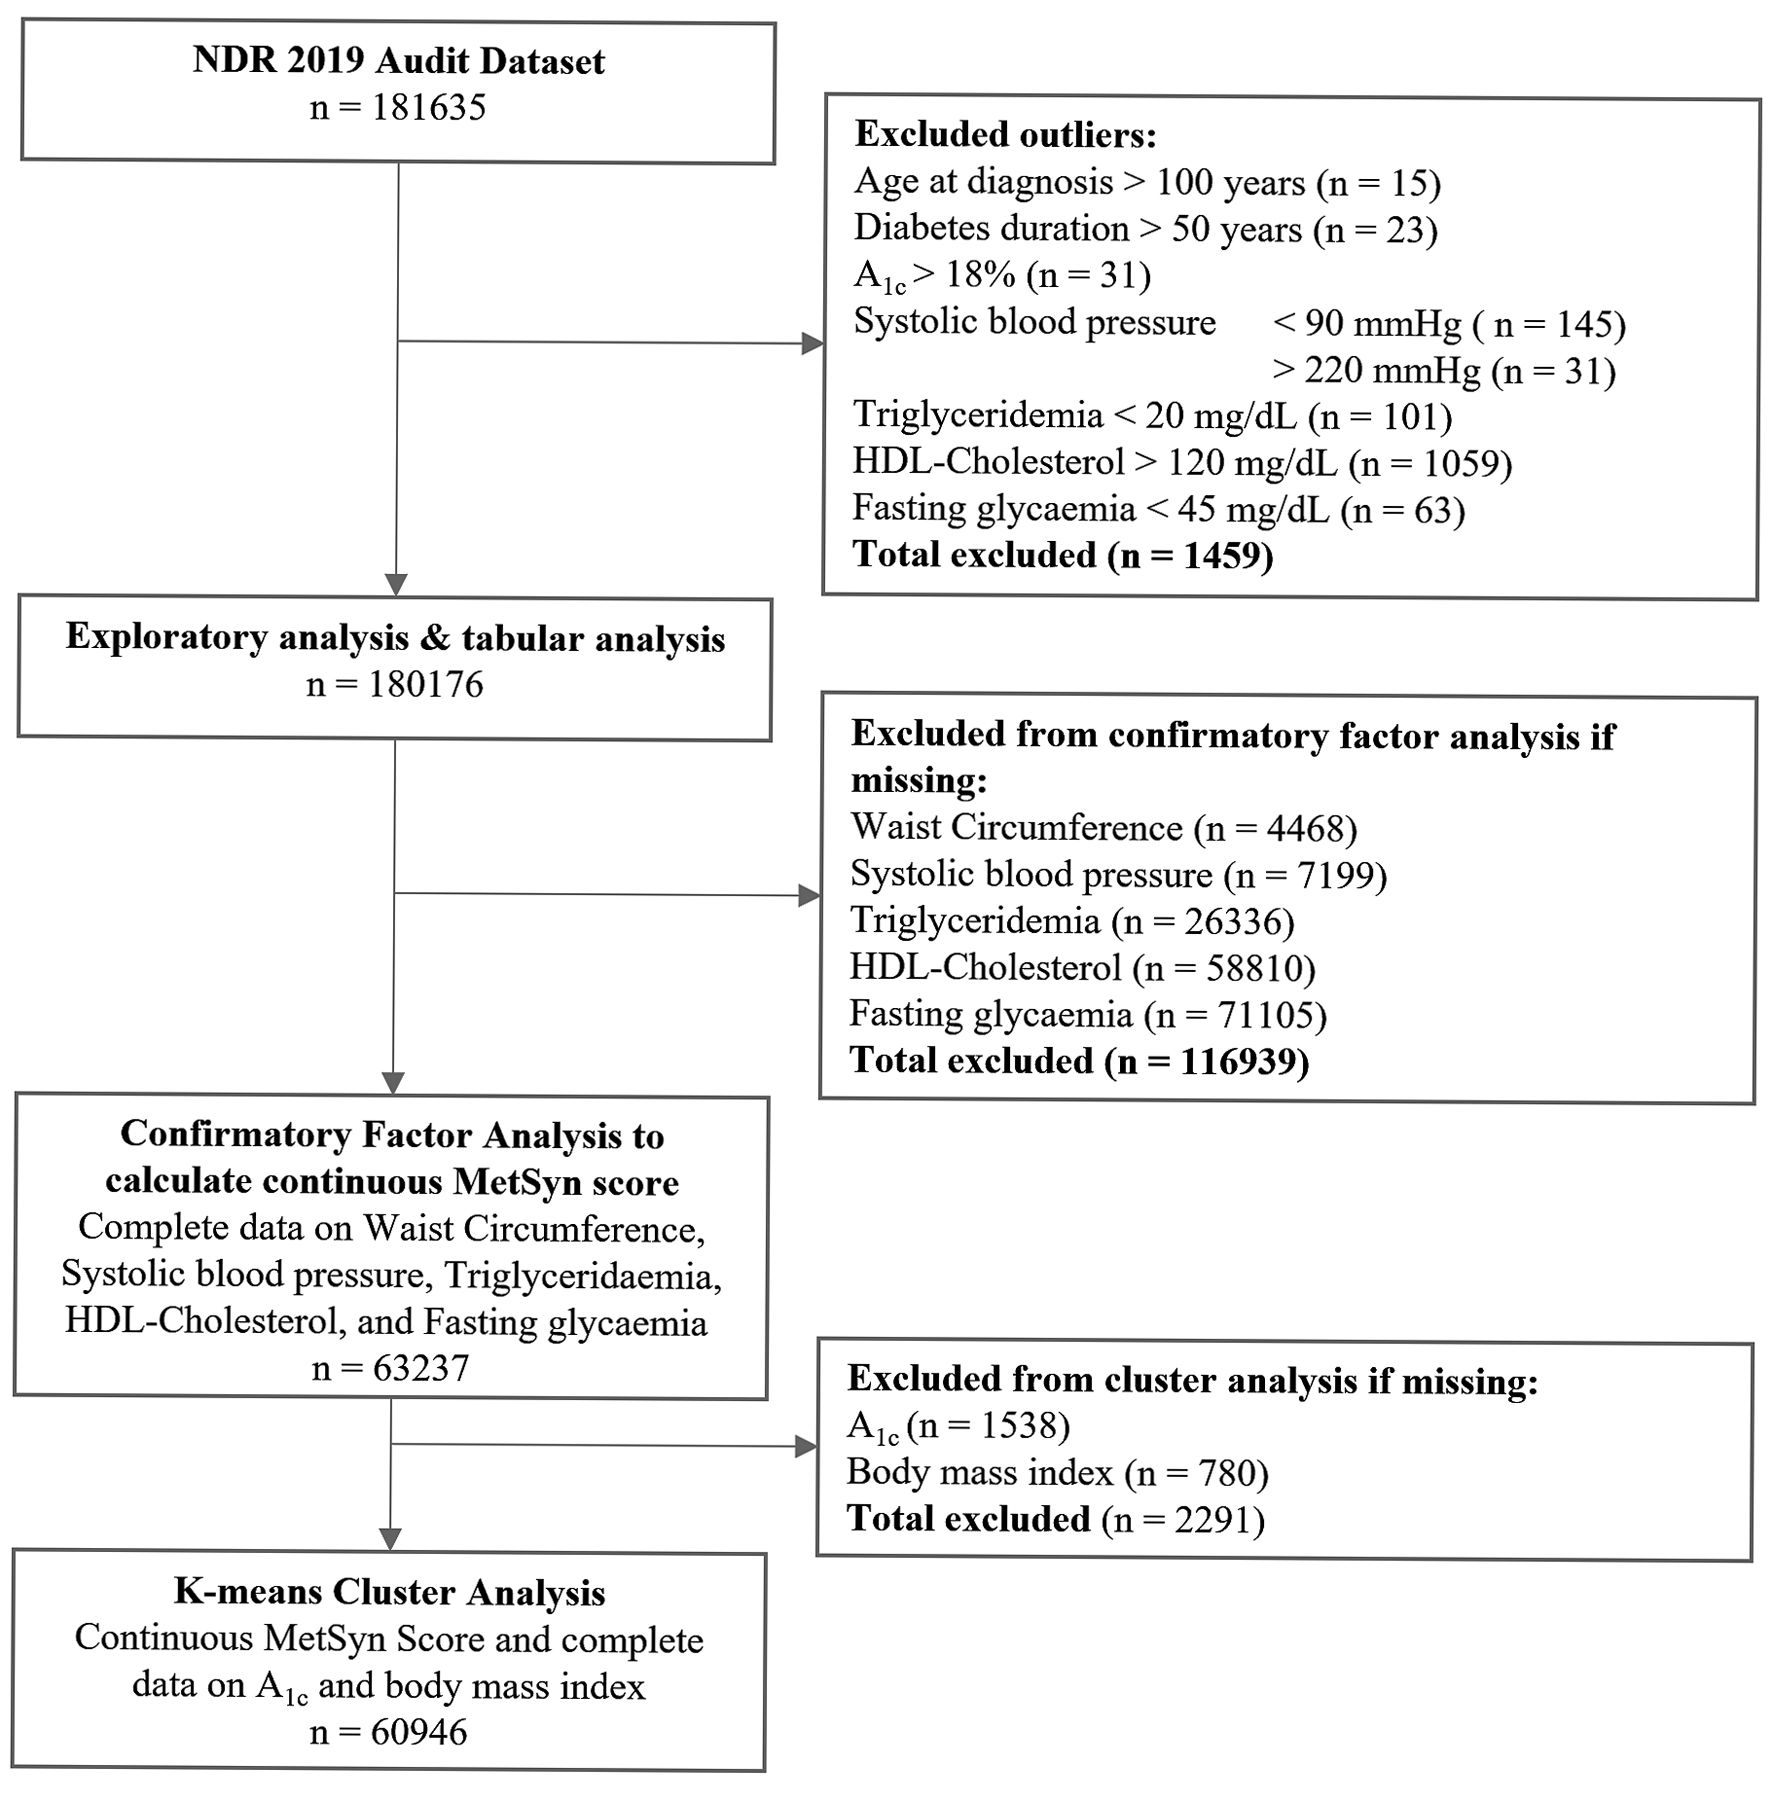 Click for large image | Figure 1. Study flow diagram. |
Clinical indicators for diabetes subtyping
Differences in the onset of diabetes complications among the five diabetes clusters-subtypes (for descriptions, Table 1) were found in previous studies [3, 4, 10-12], prompting interest in DM2 subtyping in research and clinical precision medicine settings [1, 2]. Data-driven diabetes subtyping must rely on relevant and available clinical indicators [3, 6]. The NDR collected age at diagnosis, BMI, and A1c, three clinical parameters previously used for DM2 subtyping [3]. However, C-peptide measures and autoimmune markers of diabetes, often not available in clinical practice, were not captured. The registry excluded known type 1 (severe autoimmune) diabetes cases (Table 1) [7].
To define insulin resistance, we relied on an alternative/surrogate measure, metabolic syndrome [13]. Metabolic syndrome severity was assessed using continuous metabolic syndrome z-score (cMetSyn, see derived variable calculations) [14-17]. A lower (negative) cMetSyn suggests lower insulin resistance and a more significant influence of relative insulin deficiency in the pathogenesis of DM2 (as in SIDD, Table 1).
Lipotoxicity of fatty infiltration of the viscera [18] seems to be particularly characteristic of patients with SIRD (Table 1) [3, 4]. As a formal imaging/tissue assessment of fatty liver was not available in the registry (a substantial limitation of our analysis), we calculated a triglyceride-glucose index (TyGI; see derived variable calculations), which has been demonstrated to represent the risk of fatty liver better than the homeostasis model in Asia-Pacific cohorts [19-21].
We used the following six variables to cluster diabetes subtypes: A1c, BMI, age at assessment, diabetes duration, cMetSyn, and TyGI. K-means cluster analysis was used to identify DM2 subtypes.
Definition of diabetes complications
The NDR included data on several microvascular and macrovascular diabetes complications: chronic kidney disease (CKD), retinopathy, cerebrovascular disease, ischemic heart disease, diabetes foot ulcers, and limb amputations. The NDR also included cases from primary care settings until the point when patients developed CKD stage 3a or worse. At that point, the patients were transferred to specialty care and were no longer followed in the registry (a potential source of selection bias). In addition to the reported CKD, the estimated glomerular filtration rate < 60 mL/min/1.73 m2 was classified as “CKD3a or worse” using the CKD Epidemiology Collaboration CKD-EPI creatinine equation [22]. Previously diagnosed retinopathy or abnormal funduscopic examination at the time of assessment were defined as retinopathy. Cerebrovascular disease, ischemic heart disease, diabetes foot ulcers and limb amputations were reported by primary care clinics per relevant Malaysian Clinical Practice Guidelines.
Statistical analysis
Analysis was performed using R software/environment, version 4.1.0 (Free Software Foundation, Inc. 2021-05-18).
Derived variables
Metabolic syndrome represents insulin resistance based on co-morbid impaired glycemia, abdominal adiposity, hypertension, and metabolic dyslipidemia, with approximately 80% of DM2 patients meeting at least three of the five metabolic syndrome criteria [1]. However, the categorical definition of metabolic syndrome does not sufficiently reflect the severity of insulin resistance. cMetSyn has been validated to estimate the severity of the metabolic syndrome [14-17, 23]. To derive cMetSyn, we first performed a confirmatory factor analysis to parameterize the model [17]: cMetSyn = WC + BP + HDL + TG + FG, where WC, BP, HDL, TG, and FG refer to standardized and centered variables for waist circumference, systolic blood pressure, high-density lipoprotein cholesterol, fasting triglyceridemia, and fasting glycemia, as described previously [17]. Our multi-group model allowed for variations in factor loadings according to patient sex and ethnicity [17]. Confirmatory factor analysis (CFA) was calculated using maximum likelihood and evaluated for the goodness of fit using root mean square error and comparative fit index. The resulting output was a population-specific z-score validated using receiver-operating characteristic (ROC) analysis against the dichotomous categories of metabolic syndrome [13-17]. The CFA-derived cMetSyn provided the most accurate diagnosis of metabolic syndrome severity on a continuous scale (area under the curve (AUC): 81.7%) compared to other relevant calculations of cMetSyn from similar studies [14-17, 23].
A formal assessment of fatty liver or variables for homeostasis model calculations were not available in the Malaysia NDR; thus, we calculated a TyGI. TyGI was reported to be better than the homeostasis model in Asia-Pacific cohorts as a surrogate marker of lipotoxicity of fatty liver [19-21]. Thus we used TyGI as a surrogate marker of lipotoxicity, as Malaysia NDR did not have imaging/tissue diagnosis of fatty liver [6].
TyGI was calculated as described previously [20] using the formula: ln(fasting triglyceridemia × fasting glycemia/2).
K-means cluster analysis to identify DM2 subtypes
CFAs were performed using the K-means cluster package.
The following six markers were used to cluster diabetes subtypes (Table 1): 1) Age at assessment, as aging contributes to diabetes pathophysiology [8]. For example, aging of insulin-producing β cells reduces insulin production reserve [1], and thus could accelerate MARD. Age variable has been previously used in diabetes subtyping [10]. 2) Diabetes duration has an impact on diabetes physiology and complications [4]. 3) A1c may reflect diabetes severity. For example, patients with MOD may have lower A1c than those with SIDD [3]. A1c variable has been previously used in diabetes subtyping [10]. 4) BMI reflects nutritional habits, fat storage capacity, and diabetes pathophysiology. Only about 40-60% of diabetes patients are obese [13, 14]. BMI variable has been previously used in diabetes subtyping [10]. 5) Insulin resistance and β-cell dysfunction, assessed as cMetSyn [16]. Components for the homeostasis model assessment of β-cell dysfunction and insulin resistance were unavailable in the registry. The lower cMetSyn suggests predominant β-cell dysfunction over insulin resistance (as in SIDD). 6) Fatty liver, lipotoxicity, assessed by TyGI. TyGI has been reported to reflect severe insulin resistance better than the homeostasis model in Asia-Pacific cohorts [19-21]. Higher TyGI may reflect lipotoxicity of diabetes (fatty liver), as in SIRD [3].
Analysis was performed using R version 4.1.0 (2021-05-18). CFAs were done using the {lavaan} package, K-means cluster analysis using the {cluster} package. A series of iterative K-means cluster analyses were performed to determine optimal clustering. Cluster analysis was performed on variables after first scaling and centering each variable to a mean of 0 and a standard deviation of 1. Despite intuitively starting with k = 4 based on previous analyses [3] (where the fifth cluster of autoimmune diabetes was excluded for lack of a relevant marker in the dataset), subtypes were assessed for optimal clustering using the elbow heuristic (Table 3). Clusterwise stability was assessed by resampling the data 2,000 times and then computing the Jaccard similarities of the original clusters to the most similar clusters in the resampled data [3]. Stable clusters are expected to yield a clusterwise mean Jaccard similarity of 0.75 or more, and highly stable clusters a mean of 0.85 [12].
Click to view | Table 3. Four-Cluster Diabetes Subtyping With Characteristics of the Clusters (n = 60,946) |
Cluster labels were assigned by examining cluster variable means. We compared the characteristics of derivative DM2 clusters/subtypes with previously reported characteristics of MARD, SIDD, SIRD, and MOD [10].
Cox regression to examine the association between DM2 subtypes and complications
Cox regression was used to examine the association between DM2 subtypes and complications. Survival analysis and Cox regression analyses were performed using R software/environment, version 4.1.0 (Free Software Foundation, Inc. 2021-05-18), packages {survival} and {survminer}. Time-to-event analysis starting from diabetes diagnosis was performed using separate models for each diabetes complication as an outcome with the data available in the NDR. Cox proportional hazard regression models assessed outcome differences by cluster with MARD as a reference, and adjusted for age, sex, and ethnicity.
Missing data
While the 2019 clinical audit dataset included 181,635 records (Fig. 1), only 63,237 had complete data for computation of metabolic syndrome severity score [14-17] and the K-means cluster analysis [3]. Comparison of cases with missing data to cases with complete data revealed that most patient demographics, biomarkers, and test results remained consistent between the two groups. That is, cases with missing triglyceridemia measurements had, on average, similar systolic blood pressure, age at diagnosis, and A1c as those with complete information on triglyceridemia. Variation was most prominent in the clinical site and ethnicity variables, as would be expected given the variability in district-level data collection. Anomalous data points were eliminated based on clinical improbability, with outlier thresholds detailed in Figure 1.
| Results | ▴Top |
Among 60,946 cases, 62.1% were women. The mean age at assessment was 61.1 (standard deviation (SD) 10.7) years, and the mean age at DM2 diagnosis was 53.3 (SD 10.6) years. The cohort was ethnically diverse, with 63.8% Malay, 16.7% ethnic Chinese, 11.3% ethnic Indian, and 11.3% other ethnicities. The median DM2 duration was 6.8 (interquartile range (IQR): 3.6 - 11.0) years, with 30.4% of cases having DM2 longer than 10 years. The mean BMI was 27.8 (SD 5.2) kg/m2, with 39.3% overweight and 29.8% obese cases. Nearly all (88.5%) met three or more criteria for metabolic syndrome [13]. The mean A1c was 6.6% (1.1%), and the mean TyGI was 9.06 (SD 0.64).
Clustering of DM2 subtypes
Using customized cluster-defining criteria based on available clinical variables, four DM2 clusters were identified, reiterating the basic phenotypes of the clusters previously observed in European cohorts [3, 4, 10]. Clusters that were determined all had Jaccard similarity values > 0.85, including MARD, SIDD, SIRD, and MOD (Fig. 2).
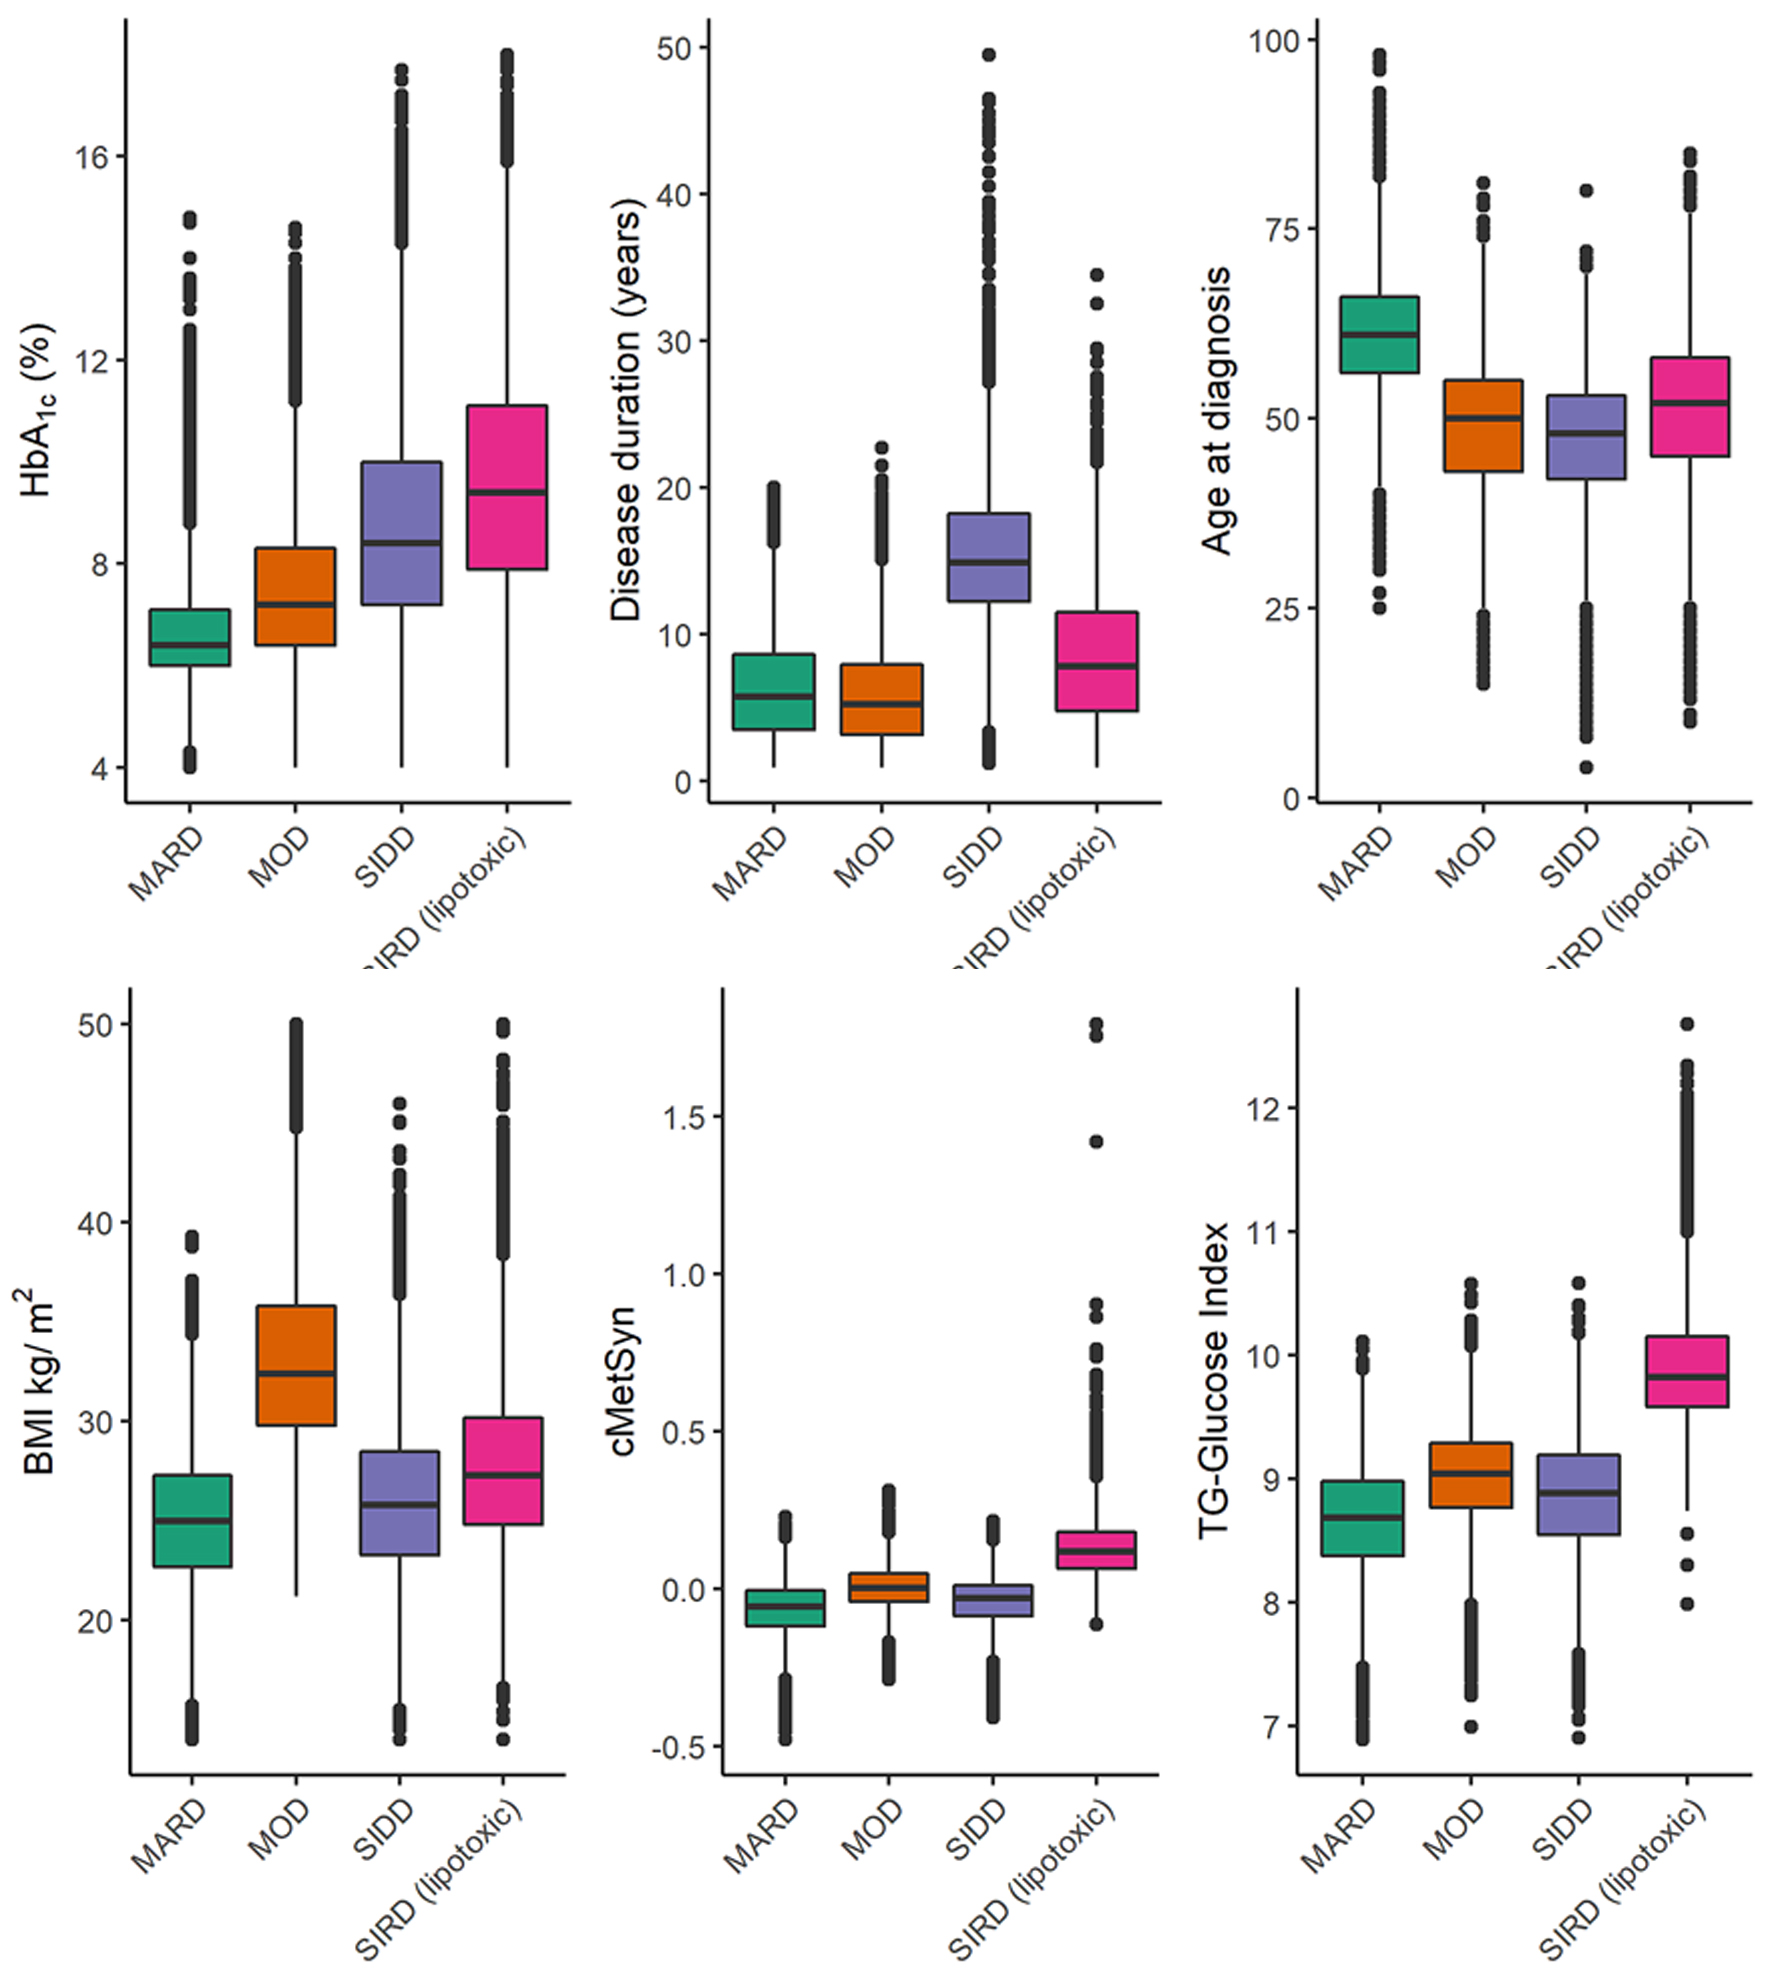 Click for large image | Figure 2. Malaysia NDR cluster boxplots, variables used in cluster analysis. MARD: mild age-related diabetes; MOD: mild obesity-related diabetes; NDR: National Diabetes Registry; SIDD: severe insulin deficient diabetes; SIRD: severe insulin-resistant diabetes. |
The MARD subtype of older-onset and shorter-duration diabetes constituted the most considerable portion of the cohort (35%) and had the mildest metabolic derangements: modestly elevated A1c of 6.7%, lowest mean BMI, below average (negative) cMetSyn z-score (low insulin resistance), and lowest TyGI (low estimated lipotoxicity) index (Table 4 and Fig. 2).
Click to view | Table 4. Characteristics of Patients With Type 2 Diabetes by Cluster Allocation |
The SIDD subtype of youngest-onset and longest-duration diabetes accounted for 19% of the cohort. They had lower BMI, the lowest (negative) cMetSyn (lowest insulin resistance), low TyGI (low lipotoxicity) index, and moderate hyperglycemia (mean A1c: 8.7%). Although we could not assess beta-cell function, this cluster seems to represent the lowest insulin resistance with elevated A1c, therefore suggesting insulin deficiency (Table 4 and Fig. 2).
The SIRD cases constituted 22% of the cohort and had similar mean age as the SIDD and MOD cohorts but were younger than MARD. SIRD cases had moderate diabetes duration, with BMI in the obesity range, and with severe hyperglycemia (mean A1c: 9.6%), and the worst TyGI (highest lipotoxicity) and the most severe cMetSyn score, suggesting the most severe insulin resistance (Table 4 and Fig. 2).
The MOD cases constituted 24% of the total cohort and were usually diagnosed in midlife, with the shortest diabetes duration. MOD cases had mild hyperglycemia (mean A1c: 7.5%) and most severe obesity but milder insulin resistance indices (cMetSyn, and lipotoxicity scores) compared to SIRD cases (Table 4 and Fig. 2).
CKD and DM2 subtypes
Among 60,155 cases, stage 3a or worse CKD (CKD3+) was reported in 19,915 (33.1%). Notably, the results are affected by registry-related selection bias, as cases were transferred to specialty care after developing CKD3+ and were no longer followed in the registry. The highest proportion of CKD3+ was in the SIDD cluster (40.5%), closely followed by SIRD (38.2%), MARD (32.7%), and MOD (23.1%), as reported in Table 4. Compared to MARD, the other three DM2 subtypes had significantly lower HRs and cumulative incidences of CKD3+, with SIDD having the lowest HR for CKD3+, adjusted for age, sex, and ethnicity (Table 5 and Fig. 3a).
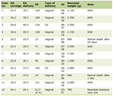
Click to view | Table 5. Hazard Ratios and 95% Confidence Intervals for Diabetes Complications by Cluster Compared to MARD |
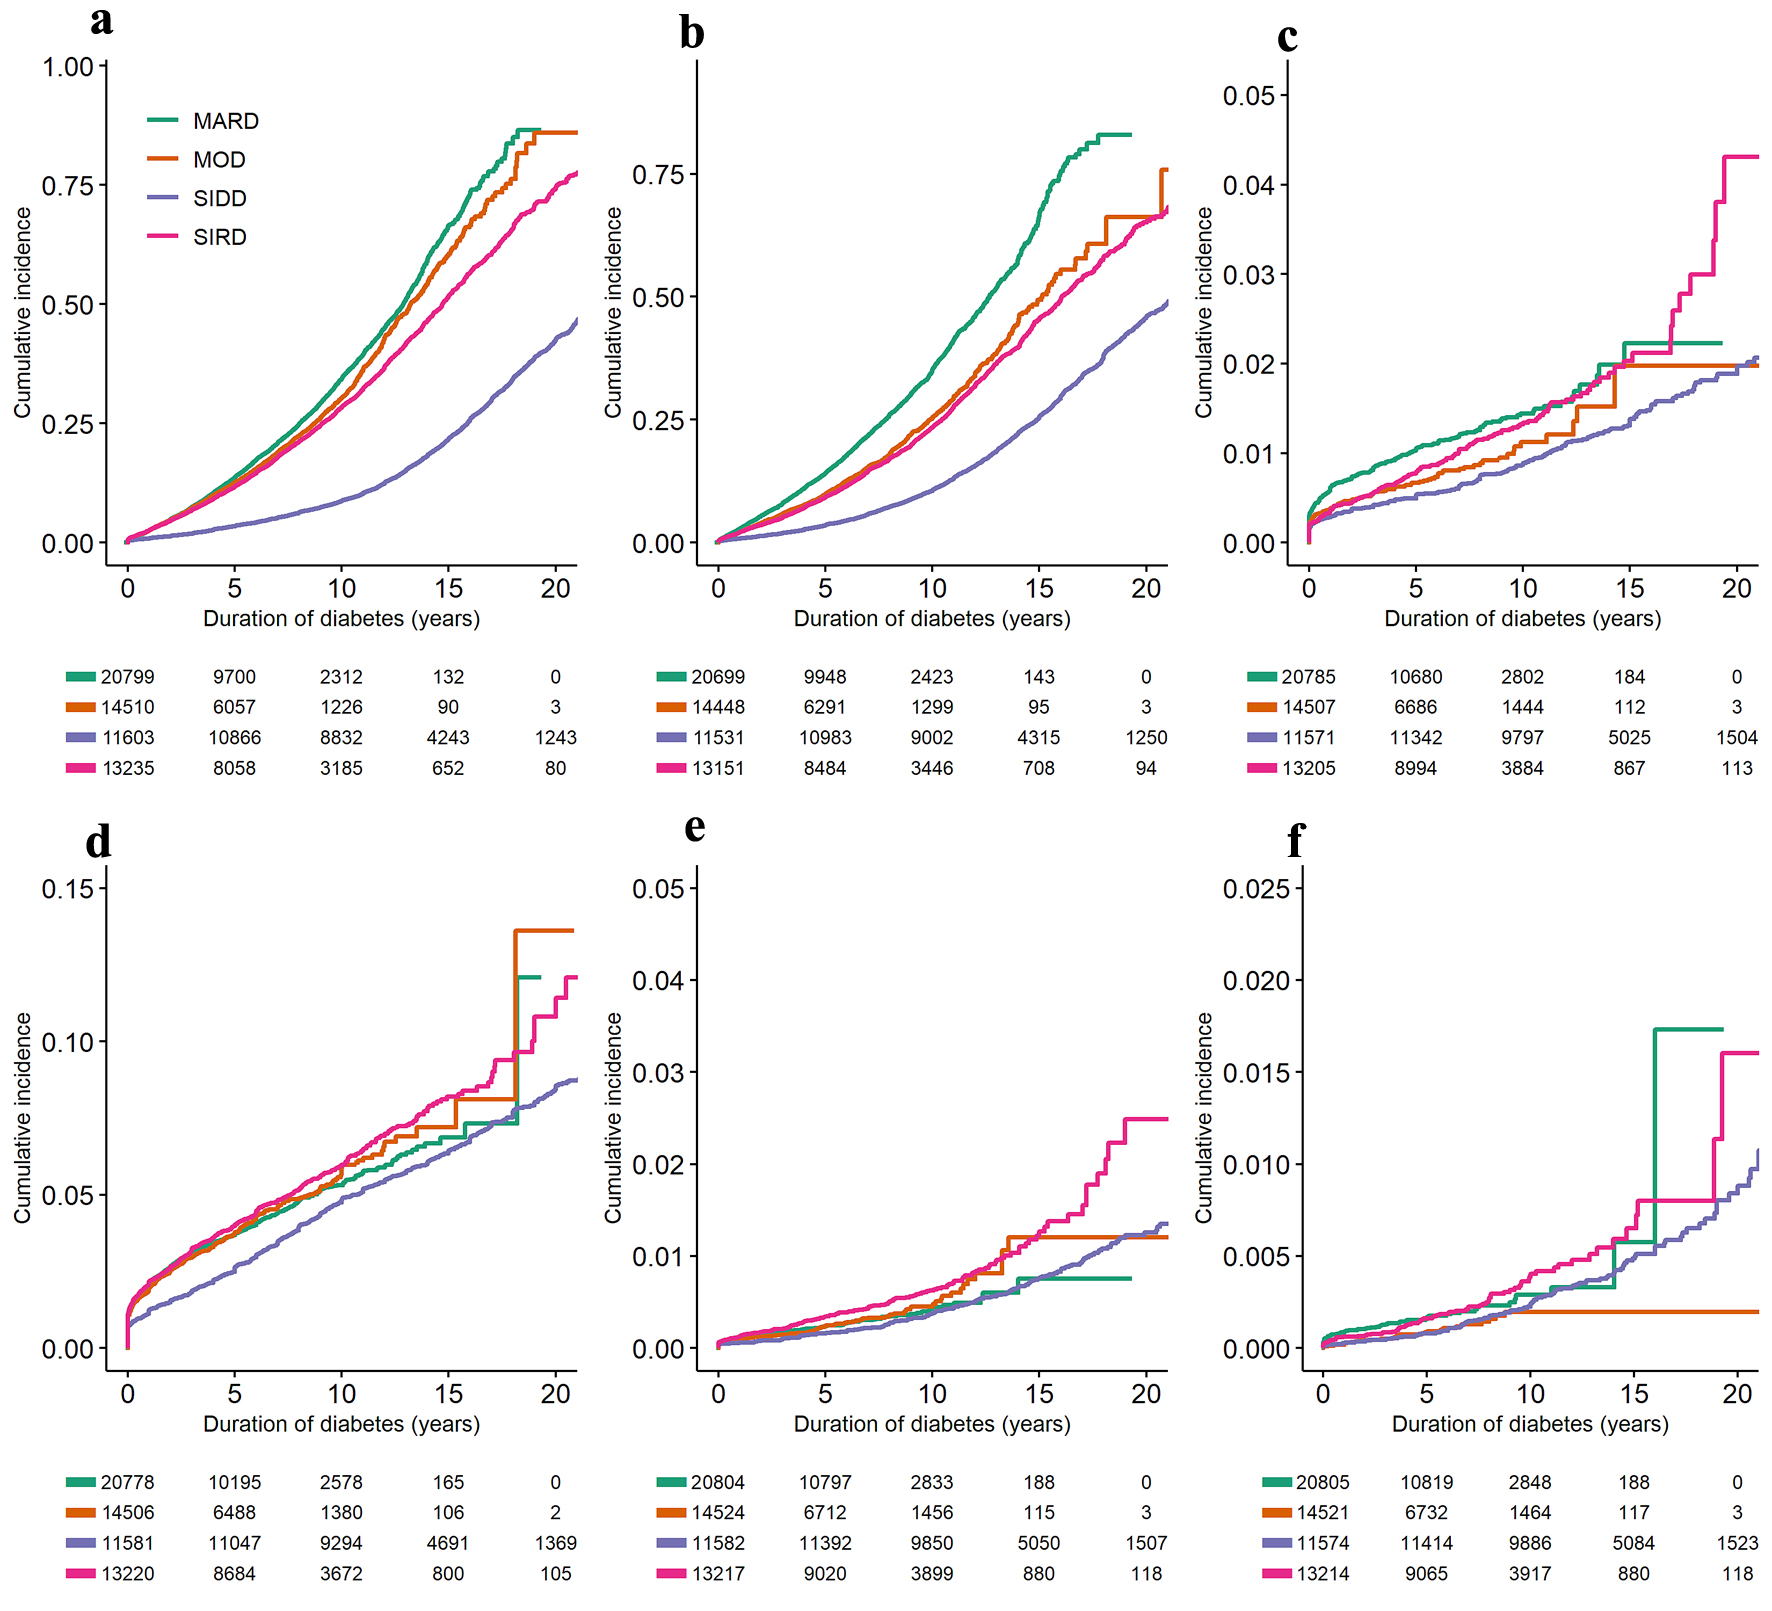 Click for large image | Figure 3. Cumulative incidence curves and risk tables for diabetes complications, adjusted for age, sex, and ethnicity: (a) stage 3a and more severe chronic kidney disease; (b) retinopathy; (c) cerebrovascular disease; (d) ischemic heart disease; (e) diabetes foot ulcers; (f) limb amputations. Models adjusted for sex and age and stratified by diabetes subtype. MARD: mild age-related diabetes; MOD: mild obesity-related diabetes; SIDD: severe insulin deficient diabetes; SIRD: severe insulin-resistant diabetes. |
Retinopathy and DM2 subtypes
Among 59,832 cases, retinopathy was reported in 12,699 (21.2%). As illustrated in Table 4, the highest proportion of retinopathy cases was in the SIDD cluster (30.8%) and the lowest in the MOD cluster (13.6%). SIRD and MARD clusters had a similar proportion of retinopathy cases (21.6% and 21.0%, respectively). Compared to MARD, the other three DM2 subtypes had significantly lower HRs and cumulative incidences of retinopathy, adjusted for age, sex, and ethnicity (Table 5 and Fig. 3b).
Cerebrovascular disease and DM2 subtypes
Among 60,070 cases, the cerebrovascular disease was reported in 925 (1.5%). As illustrated in Table 4, the highest proportion of cerebrovascular disease cases was in the SIDD cluster (2.0%) and the lowest in the MOD cluster (3.8%). SIRD and MARD clusters had a similar proportion of cerebrovascular disease (6.1% and 5.9%, respectively). Compared to MARD, SIDD and MOD had significantly lower HRs and cumulative incidences of cerebrovascular disease, adjusted for age, sex, and ethnicity (Table 5 and Fig. 3c).
Ischemic heart disease and DM2 subtypes
Among 60,087 cases, ischemic heart disease was reported in 3,604 (6.0%). As illustrated in Table 4, the highest proportion of ischemic heart disease cases in the SIDD cluster (8.7%) and the lowest in the MOD cluster (3.8%). SIRD and MARD clusters had a similar proportion of ischemic heart disease (6.1% and 5.9%, respectively). Compared to MARD, SIDD had a significantly lower HR and cumulative incidence of ischemic heart disease, adjusted for age, sex, and ethnicity (Table 5 and Fig. 3d).
Diabetes foot ulcers and limb amputations and DM2 subtypes
Among 60,126 and 60,116 cases included in the analysis, a low prevalence was reported for diabetes foot ulcers (n = 684, 1.1%) and limb amputations (n = 288, 0.5%), respectively. As illustrated in Table 4, the highest proportions of diabetes foot ulcers and amputations were in the SIDD cluster (2.0% and 1.0%, respectively) and lowest in the MOD cluster (0.6% and 0.3%, respectively). SIRD and MARD clusters had a similar proportion of diabetes foot ulcers and limb amputations. As reported in Table 5 and Figure 3e, f, SIRD had a significantly higher HR and cumulative incidence of diabetes foot ulcers, and MOD had a significantly lower HR and cumulative incidence of limb amputations compared to MARD after adjustment for age, sex, and ethnicity.
| Discussion | ▴Top |
Our principal finding was the differential relationship of DM2 subtypes with microvascular and macrovascular complications in a diverse multi-ethnic Asian cohort. The heterogeneity of DM2 and the differential relationship of DM2 subtypes to complications are important for research and clinical practice. For example, recognizing different subtypes in clinical practice for therapy selection, screening schedule for complications, and team-based care may be more expensive short-term but cost-saving in the long-run. More tailored care can improve patient outcomes and defer or avoid complications. The need for DM2 subtyping has been emphasized in the new classification reports [1, 2], and recently has been at the forefront of research [4-6, 24]. The original DM2 subtyping was described in European cohorts [3, 4], but needed further validation in diverse multi-ethnic Asia-Pacific populations [6, 11, 24]. Our analysis contributes to evidence of diabetes heterogeneity and the diverse relationship of DM2 subtypes to diabetes complications in a multi-ethnic Malaysian cohort [9].
Our results support the suggestion of a differential risk of diabetic kidney disease among the DM2 subtypes. We found that the SIDD results in later onset and overall lower HR of CKD3+ despite the worst glycemic control after adjusting for age, sex, and ethnicity. Notably, the SIDD cases had the youngest onset and the longest duration of diabetes compared to other cohorts. The CKD3+ cases manifested later after diabetes diagnosis in the SIDD subtype compared to the other DM2 subtypes. Contrary to Scandinavian cohorts [3], Malaysian the NDR did not detect early onset of kidney disease in the SIRD cluster. We believe that the Malaysian NDR may have underestimated the early onset of kidney disease due to selection bias, as patients with CKD3+ may have been referred to specialty care rather than included in primary care NDR (by design) if they had kidney disease at the time of diabetes diagnosis. Regrettably we did not have the information to confirm this hypothesis. Thus, the association between the SIRD subtype and early-onset advanced kidney disease [3, 4, 25] in Asian populations will benefit from further study.
Retinopathy appears to develop later after diabetes onset in the SIDD cohort and early in the diabetes progression among the MARD cases. It is possible that these differences may be related to the spectrum bias in age: the mean age at diabetes diagnosis was about 14 years older in the MARD than in the SIDD cases. Perhaps the studies designed to investigate the interaction of age with glycemic control on the risk of diabetes retinopathy may clarify the etiology of these differences. Likewise, the spectrum bias in age must be considered when interpreting the analyses of the relationship between DM2 subtypes and macrovascular diabetes complications. Nevertheless, our analysis suggests that the SIRD cohort had the highest HR for diabetes foot ulcers, suggesting the potential role of severe insulin resistance in the pathogenesis of diabetic foot ulcers [26, 27].
Although glycemia-related aspects of MARD may be mild, MARD tends to be associated with higher risks of complications. MARD cases tend to be older and are potentially more likely affected by multi-morbidity (two or more chronic diseases). This hypothesis needs to be explored in future studies, and perhaps warrants future renaming of this diabetes subtype.
Our study’s strength was the use of a large national registry cohort, allowing us to test diabetes subtypes in an ethnically diverse population. The availability of an inclusive diabetes registry in a middle-income country relied on the pragmatic use of available clinical markers based on general principles of diabetes subtyping: age, adiposity, insulin resistance, lipotoxicity, glycemia, and DM2 duration. Thus, we used the same principles for subtyping, although the markers for subtyping were different than in European studies [10]. To estimate the relative contribution of insulin resistance and insulin deficiency, we assessed metabolic syndrome severity using a continuous metabolic syndrome score [14-17, 23] as the NDR systemically collects the data on metabolic syndrome components, including waist circumference. The original subtyping of new-onset diabetes [10] has not been utilized for subtyping of advanced diabetes. However, the need for re-classification of diabetes during diabetes progression has been suggested by previous studies [4]. As such, our analysis suggests that the classification of DM2 is possible in DM2 of longer duration and should include diabetes duration as a clustering variable.
The study limitations were the lack of autoimmune diabetes markers and C-peptide as a marker of endogenous insulin reserve (C-peptide along with glucose, is used to assess beta-cell reserve and to calculate the other indicators of the homeostasis model) [28]. Studies suggest up to 14% prevalence of autoimmune diabetes in adults misdiagnosed with DM2; however, no consensus exists to suggest screening for autoimmune diabetes in Asia-Pacific populations with adult-onset diabetes [29]. Although the known type 1 diabetes cases were excluded from the analytical sample, the NDR did not measure autoimmune diabetes markers; therefore, we could not assess for SAID corresponding to type 1 diabetes [3].
Due to the cross-sectional nature of the NDR data, we were unable to assess the cases at the time of diabetes diagnosis and longitudinally, rendering our analysis susceptible to the bias arising from natural variation between individuals. The data were limited on assessments of a total daily dose of insulin concomitant with endogenous insulin reserve and glycemia (affecting the severity of insulin resistance in insulin-treated cases). Lastly, the analytical sample may have included some misclassified cases of secondary, mixed etiology, or hybrid forms of diabetes [2].
In summary, the subtypes of DM2 lead to different diabetes complications in an Asia-Pacific population, generally following the patterns found in European cohorts. The relationship between DM2 subtypes and complications, particularly advanced CKD, deserves further longitudinal investigation.
Acknowledgments
The authors thank the Director General of Health Malaysia, for permission to publish this paper. We acknowledge our colleagues and stakeholders involved in implementing the National Diabetes Registry and the annual clinical audit nationwide. Thanks to Lillian Morrell for her attention to detail in helping prepare and finalize the manuscript prior to submission.
Financial Disclosure
The Malaysian NDR is funded by the Malaysian Ministry of Health. The regulatory approval data analysis and manuscript writing was internally funded by Research Triangle Institute (RTI) International and Rush University (R3 pilot grant 0272101.001.001). External agents had no role in study design; in the collection, analysis, or interpretation of data; in the writing of the report; and in the decision to submit the paper for publication.
Conflict of Interest
The authors have declared no conflict of interest.
Informed Consent
Written informed consent was not required in accordance with national guidelines due to the retrospective nature of this study.
Author Contributions
RK and RN initiated, NE, CN, AC, and FIM contributed to the concept of the diabetes subtyping and the selection of subtyping variables. NE with ER and PJ conducted the data analysis. AC and FIM verified the underlying data. All authors had full access to the data in the study, contributed to the study design, data interpretation, and report writing, and read and approved the final report.
Data Availability
The datasets generated or analyzed during the current study are not available publicly because they are subject to national data protection laws and restrictions imposed by the ethics committee to ensure the privacy of study participants. However, they can be applied for through an individual project agreement with the principal investigator of the National Diabetes Registry Malaysia. The registry protocol and the individual methods have been published in a separate report [9] and are unrestrictedly available.
Abbreviations
A1c: glycated hemoglobin; AUC: area under the curve; BMI: body mass index; CFA: confirmatory factor analysis; CKD: chronic kidney disease; cMetSyn: continuous metabolic syndrome z-score; DM2: type 2 diabetes; IQR: interquartile range; MARD: mild age-related diabetes; MOD: mild obesity-related diabetes; NDR: National Diabetes Registry; ROC: receiver-operating characteristic; SAID: severe autoimmune diabetes; SD: standard deviation; SIDD: severe insulin-deficient diabetes; TyGI: triglyceride-glucose index
| References | ▴Top |
- Cowie CC, Casagrande SS, Menke A, et al., editors. Diabetes in America, 3rd edn. Bethesda (MD): National Institute of Diabetes and Digestive and Kidney Diseases (US); 2018.
- World Health Organization. Classification of diabetes mellitus. World Health Organization. 2019.
- Ahlqvist E, Storm P, Karajamaki A, Martinell M, Dorkhan M, Carlsson A, Vikman P, et al. Novel subgroups of adult-onset diabetes and their association with outcomes: a data-driven cluster analysis of six variables. Lancet Diabetes Endocrinol. 2018;6(5):361-369.
doi pubmed - Zaharia OP, Strassburger K, Strom A, Bonhof GJ, Karusheva Y, Antoniou S, Bodis K, et al. Risk of diabetes-associated diseases in subgroups of patients with recent-onset diabetes: a 5-year follow-up study. Lancet Diabetes Endocrinol. 2019;7(9):684-694.
doi pubmed - Slieker RC, Donnelly LA, Fitipaldi H, Bouland GA, Giordano GN, Akerlund M, Gerl MJ, et al. Distinct molecular signatures of clinical clusters in people with type 2 diabetes: an IMI-RHAPSODY study. Diabetes. 2021;70(11):2683-2693.
doi pubmed pmc - Ahlqvist E, Prasad RB, Groop L. 100 YEARS OF INSULIN: Towards improved precision and a new classification of diabetes mellitus. J Endocrinol. 2021;252(3):R59-R70.
doi pubmed - National Health and Morbidity Survey 2019. Shah Alam: Institute for Public Health, Ministry of Health, Malaysia, 2020. http://iku.gov.my/images/IKU/Document/REPORT/NHMS2019/Report_NHMS2019-NCD_v2.pdf (accessed Jan 5, 2022).
- Rhee EJ. Diabetes in Asians. Endocrinol Metab (Seoul). 2015;30(3):263-269.
doi pubmed pmc - Ministry of Health Malaysia. National Diabetes Registry Report 2020. Ministry of Health Malaysia, 2021. https://www.moh.gov.my/moh/resources/Penerbitan/Rujukan/NCD/Diabetes/National_Diabetes_Registry_Report_2020.pdf.
- Ahlqvist E, Prasad RB, Groop L. Subtypes of type 2 diabetes determined from clinical parameters. Diabetes. 2020;69(10):2086-2093.
doi pubmed - Zou X, Zhou X, Zhu Z, Ji L. Novel subgroups of patients with adult-onset diabetes in Chinese and US populations. Lancet Diabetes Endocrinol. 2019;7(1):9-11.
doi pubmed - Dennis JM, Shields BM, Henley WE, Jones AG, Hattersley AT. Disease progression and treatment response in data-driven subgroups of type 2 diabetes compared with models based on simple clinical features: an analysis using clinical trial data. Lancet Diabetes Endocrinol. 2019;7(6):442-451.
doi pubmed pmc - Alberti KG, Eckel RH, Grundy SM, Zimmet PZ, Cleeman JI, Donato KA, Fruchart JC, et al. Harmonizing the metabolic syndrome: a joint interim statement of the International Diabetes Federation Task Force on Epidemiology and Prevention; National Heart, Lung, and Blood Institute; American Heart Association; World Heart Federation; International Atherosclerosis Society; and International Association for the Study of Obesity. Circulation. 2009;120(16):1640-1645.
doi pubmed - Huh JH, Lee JH, Moon JS, Sung KC, Kim JY, Kang DR. Metabolic syndrome severity score in Korean adults: analysis of the 2010-2015 Korea National Health and Nutrition Examination Survey. J Korean Med Sci. 2019;34(6):e48.
doi pubmed pmc - Wijndaele K, Beunen G, Duvigneaud N, Matton L, Duquet W, Thomis M, Lefevre J, et al. A continuous metabolic syndrome risk score: utility for epidemiological analyses. Diabetes Care. 2006;29(10):2329.
doi pubmed - Hillier TA, Rousseau A, Lange C, Lepinay P, Cailleau M, Novak M, Calliez E, et al. Practical way to assess metabolic syndrome using a continuous score obtained from principal components analysis. Diabetologia. 2006;49(7):1528-1535.
doi pubmed pmc - Gurka MJ, Lilly CL, Oliver MN, DeBoer MD. An examination of sex and racial/ethnic differences in the metabolic syndrome among adults: a confirmatory factor analysis and a resulting continuous severity score. Metabolism. 2014;63(2):218-225.
doi pubmed pmc - Low S, Khoo KCJ, Wang J, Irwan B, Sum CF, Subramaniam T, Lim SC, et al. Development of a metabolic syndrome severity score and its association with incident diabetes in an Asian population-results from a longitudinal cohort in Singapore. Endocrine. 2019;65(1):73-80.
doi pubmed - Lee SB, Kim MK, Kang S, Park K, Kim JH, Baik SJ, Nam JS, et al. Triglyceride glucose index is superior to the homeostasis model assessment of insulin resistance for predicting nonalcoholic fatty liver disease in Korean adults. Endocrinol Metab (Seoul). 2019;34(2):179-186.
doi pubmed pmc - Li W, Wang Y, He F, Liu Z, Dong J, Zhang Y, Li T, et al. Association between triglyceride-glucose index and nonalcoholic fatty liver disease in type 2 diabetes mellitus. BMC Endocr Disord. 2022;22(1):261.
doi pubmed pmc - Correa TL, Guelli MSTC, de Oliveira IO. Triglyceride-glucose Index (TyG) is Positively associated with nonalcoholic fatty liver disease. American Heart Journal. 2021;242:158-159.
- Teo BW, Xu H, Wang D, Li J, Sinha AK, Shuter B, Sethi S, et al. GFR estimating equations in a multiethnic Asian population. Am J Kidney Dis. 2011;58(1):56-63.
doi pubmed - Saponaro C, Gaggini M, Gastaldelli A. Nonalcoholic fatty liver disease and type 2 diabetes: common pathophysiologic mechanisms. Curr Diab Rep. 2015;15(6):607.
doi pubmed - Philipson LH. Harnessing heterogeneity in type 2 diabetes mellitus. Nat Rev Endocrinol. 2020;16(2):79-80.
doi pubmed pmc - Li L, Zou X, Huang Q, Han X, Zhou X, Ji L. Do East Asians with normal glucose tolerance have worse β-cell function? A meta-analysis of epidemiological studies. Front Endocrinol. 2021;12:1559.
- Gancheva S, Jelenik T, Alvarez-Hernandez E, Roden M. Interorgan metabolic crosstalk in human insulin resistance. Physiol Rev. 2018;98(3):1371-1415.
doi pubmed - Reddy P, Lent-Schochet D, Ramakrishnan N, McLaughlin M, Jialal I. Metabolic syndrome is an inflammatory disorder: A conspiracy between adipose tissue and phagocytes. Clin Chim Acta. 2019;496:35-44.
doi pubmed - Wallace TM, Levy JC, Matthews DR. Use and abuse of HOMA modeling. Diabetes Care. 2004;27(6):1487-1495.
doi pubmed - Buzzetti R, Zampetti S, Maddaloni E. Adult-onset autoimmune diabetes: current knowledge and implications for management. Nat Rev Endocrinol. 2017;13(11):674-686.
doi pubmed
This article is distributed under the terms of the Creative Commons Attribution Non-Commercial 4.0 International License, which permits unrestricted non-commercial use, distribution, and reproduction in any medium, provided the original work is properly cited.
Journal of Endocrinology and Metabolism is published by Elmer Press Inc.