


| Journal of Endocrinology and Metabolism, ISSN 1923-2861 print, 1923-287X online, Open Access |
| Article copyright, the authors; Journal compilation copyright, J Endocrinol Metab and Elmer Press Inc |
| Journal website https://www.jofem.org |
Original Article
Volume 13, Number 4, November 2023, pages 153-163

Improvement of Glycemic Control by Metformin Is Associated With Frequency of Defecation Before Treatment in Patients With Type 2 Diabetes Mellitus
Kunio Hieshimaa, d, Seigo Sugiyamaa, b, Akira Yoshidaa, Noboru Kurinamia, Tomoko Suzukia, Kaori Otsukaa, Fumio Miyamotoa, Keizo Kajiwaraa, Katsunori Jinnouchia, Tomio Jinnouchia, Hideaki Jinnouchia, b, c
aDiabetes Care Center, Jinnouchi Hospital, Kumamoto, Japan
bCardiovascular Division, Diabetes Care Center, Jinnouchi Hospital, Kumamoto, Japan
cDivision of Preventive Cardiology, Department of Cardiovascular Medicine, Kumamoto University Hospital, Kumamoto, Japan
dCorresponding Author: Kunio Hieshima, Diabetes Care Center, Jinnouchi Hospital, Kumamoto 862-0976, Japan
Manuscript submitted October 6, 2023, accepted November 18, 2023, published online November 24, 2023
Short title: Defecation-Associated Action of Metformin
doi: https://doi.org/10.14740/jem916
| Abstract | ▴Top |
Background: It was recently reported that metformin induces glucose excretion in the terminal ileum. This study reassessed the ability of metformin to promote defecation and its relationship with the glycated hemoglobin (HbA1c) level in patients with type 2 diabetes mellitus (T2DM).
Methods: We retrospectively assessed the frequency of defecation (FD) in patients with T2DM who were admitted to our hospital for glycemic control between April 2017 and March 2022. We examined the FD associated with initiation of metformin or a sodium-glucose cotransporter-2 inhibitor (SGLT2i) by calculating the change in FD after starting treatment (ΔFD). Next, we compared the FD variables (ΔFD, the FD ratio and FD before and after starting treatment) and the change in glycated hemoglobin (ΔHbA1c) at 1.5 and 6 months after discharge between the two treatment groups with no change in medications except for minor adjustments in the insulin dose.
Results: Fifty-five patients were included (metformin group, n = 30; SGLT2i group, n = 25). The mean FD increased significantly after the maximum dose was reached in the metformin group (from 0.70 ± 0.19 to 0.83 ± 0.18 times/day; P = 0.001) but not in the SGLT2i group. Surprisingly, there was no significant relationship between ΔFD or the FD ratio before and after starting treatment and the ΔHbA1c in either treatment group. However, there was a significant correlation of FD before and after starting metformin with the ΔHbA1c (r = -0.467, P = 0.009 and r = -0.509, P = 0.004, respectively). Multivariate analysis found a significant correlation of FD before and after starting metformin with ΔHbA1c (P < 0.05). However, there was no correlation of FD with ΔHbA1c before or after starting an SGLT2i.
Conclusions: Metformin improves HbA1c in patients with T2DM in an FD-associated manner but not in an FD change-associated manner. Given that ΔHbA1c was associated with FD both after and before starting metformin, we suggest that the effects of this agent may be influenced by the pretreatment FD as well as conventional dose dependence. However, metformin did increase the FD, but the reason for this phenomenon is currently unknown.
Keywords: Frequency of defecation; Metformin; Type 2 diabetes mellitus
| Introduction | ▴Top |
Following intestinal absorption, metformin is thought to exert its main effects in the liver, where it suppresses hepatic glucose production via mechanisms that are both dependent on and independent of AMP-activated protein kinase [1, 2]. However, there is some evidence suggesting that the intestinal tract is also a target of metformin [3-5]. Moreover, a recent clinical study unexpectedly found a high incidence of gastrointestinal effects in patients on metformin; a delayed-release formulation of metformin, which is largely retained in the gut with minimal absorption, was found to be as effective at lowering blood glucose as the standard immediate-release formulation in individuals with type 2 diabetes mellitus (T2DM) [6]. Therefore, the gastrointestinal tract is now considered to be an important site of action for metformin.
Gastrointestinal symptoms are well-known adverse effects of metformin but are usually mild and transient [7]. Many causes have been suggested for these adverse effects, including changes in the intestinal flora, an organic cation transporter-1 genotype, induction of secretion of glucagon-like peptide-1 (GLP-1), pooling of bile acids in the intestine, and promotion of secretion of serotonin in the intestinal tract [7]. Recently, Morita et al reported that metformin induces glucose excretion in the terminal ileum [8], where it might induce changes in the gut microbiota and stimulate production of specific metabolites, thereby altering the defecation pattern. Furthermore, if the excretion of glucose in the gut is as substantial as that induced in the kidney by sodium-glucose cotransporter 2 inhibitor (SGLT2i) therapy, it may be an important hypoglycemic mechanism in addition to suppressing hepatic glucose production.
Although there have been many reports on metformin and gastrointestinal symptoms [9], we do not know of any studies that have investigated the relationship between frequency of defecation (FD) while on metformin and the blood glucose-lowering effect of this agent. In this study, we aimed to reassess whether the initiation of metformin increases the FD in patients with T2DM, and to reassess whether there is a relationship between the ability of metformin to promote defecation and the glycated hemoglobin (HbA1c) level.
| Materials and Methods | ▴Top |
Study protocol
We retrospectively calculated the FD in patients with T2DM who were admitted to our hospital between April 2017 and March 2022 for improvement of glycemic control. We generally recommend hospitalization as much as possible for educational purposes in patients with T2DM visiting our hospital for the first time. In particular, we actively recommend hospitalization for patients with an HbA1c value > 8.0%, assess the patient’s characteristics, and consider therapeutic agents. Metformin, an SGLT2i, and/or GLP-1 receptor agonists are usually administered to patients who are obese and have insulin resistance. In the present study, we focused only on the FD, rather than the consistency or amount of each defecation. The FD was defined as the total number of defecations per day (≥ 0) as reported by patients divided by the number of days on which this was recorded before and after starting treatment with metformin or an SGLT2i. Diarrhea was defined as having a consistency equivalent to type 6 or type 7 on the Bristol Stool Form Scale [10], which was self-reported by the patients. The data needed to calculate FD were obtained from the patient records. Patients on an SGLT2i were selected as a control group. In this study, only immediate-release metformin was used because this is the only formulation presently approved in Japan. The SGLT2i agents used were luseogliflozin, ipragliflozin, dapagliflozin, tofogliflozin, and empagliflozin. If the doses of metformin or SGLT2i were increased, FD was recorded after the maximum dose was reached. Patients in whom the number of defecations per day was recorded for at least 3 days in total were included. Patients newly initiated on both metformin and SGLT2i were included in the metformin group.
We excluded patients with malignancy, autoimmune disease, chronic gastrointestinal disease, diarrhea on admission, or an HbA1c < 7.0% on admission. We did not consider any concomitant antidiabetic medications (including injectables) during hospitalization in either the metformin group or the SGLT2i group. However, absence of metformin was mandatory in the SGLT2i group. The HbA1c at 1.5 months after the date of discharge was used as the baseline value for evaluation of glycemic control for the following reasons: the HbA1c at the time of admission varied substantially; the HbA1c at 1.5 months following discharge was normally distributed; and most patients attend the hospital outpatient clinic at this time for their second post-discharge visit. The baseline date was permitted to vary by ± 1 week. Patients in whom there was no change in treatment regimen during the 6 months following discharge were included; the change in HbA1c (ΔHbA1c) over this period was calculated. Minor adjustments in insulin dose were allowed. We compared FD before and after administration of metformin or SGLT2i, calculated the change in FD after initiating treatment (by subtracting FD before initiation of treatment from that after initiation of treatment; ΔFD), and compared the ΔFD and FD before treatment to assess the influence of pretreatment FD on the subsequent ΔFD. Next, we evaluated whether the FD before and after starting treatment, ΔFD after starting treatment, and the FD ratio before and after starting treatment were associated with the ΔHbA1c. The interval before and after initiation of treatment was 0 days if the drug dose was not increased, and if the dose was increased, there was a non-counting period until the maximum dose was reached. Laboratory data were collected as previously reported [11].
Hospital meals
We first set the patient’s target weight and total energy intake at the beginning of admission in accordance with the recommendation of the Japanese Clinical Practice Guideline for Diabetes [12]. The target weight and energy intake were personalized and differed depending on various factors, such as the patient’s age, current weight, and amount of physical activity. The percentage of energy-yielding nutrient intake was 50-60% energy from carbohydrates and ≤ 20% energy from protein, and the remainder was lipids. If the lipids comprised more than 25% energy, polyunsaturated fatty acids were increased to add to the fatty acid composition [13]. The ratios of macronutrients varied depending on physical activity and the severity of diabetic complications, as well as the food preferences of each patient. The dietary fiber intake was 15 - 18 g/day, irrespective of the carbohydrate intake. Meals were prepared in our hospital kitchen under the supervision of registered dietitians and were served three times a day: breakfast (08:00 h), lunch (12:00 h), and dinner (18:00 h).
Diabetic complications
Diabetic peripheral neuropathy was diagnosed in patients who fulfilled at least two of the following criteria: a complaint of bilateral sensory symptoms in the toes and/or soles of the feet, a bilaterally diminished or absent Achilles tendon reflex, and bilaterally diminished vibration sensation in the medial malleoli, identified using a C128 tuning fork [14]. Diabetic retinopathy was diagnosed by an experienced ophthalmologist based on a standardized funduscopic examination. Diabetic nephropathy was diagnosed in patients with a spot urine albumin to creatinine ratio ≥ 30 mg/g. Hypertension and dyslipidemia were defined as reported previously [11].
Statistical analysis
Categorical data are presented with their frequency distribution and the relationships between categorical datasets were evaluated using Pearson’s Chi-squared test or the Wilcoxon rank-sum test. Continuous data were tested for normality using the Shapiro-Wilk test and are summarized as the mean ± standard deviation if normally distributed and as the median (interquartile range (IQR)) if not. If data were not normally distributed, the corresponding normally distributed data in the other group are summarized as the median for the purpose of comparison between groups, if appropriate. Datasets were compared using the unpaired t-test if normally distributed and using Spearman’s correlation analysis or the Wilcoxon rank-sum test if not normally distributed. The paired t-test was used for comparisons within groups as appropriate. The relationship between ΔHbA1c and FD was assessed in univariate analysis followed by multiple linear regression analysis. Categorical variables were numerically coded for these analyses, as described elsewhere [11]. The data were analyzed using JMP 10.0.2 software (SAS Institute Inc., Cary, NC, USA). A P-value < 0.05 was considered statistically significant.
Ethical considerations
The study was approved by the Jinnouchi Hospital Ethics Committee (approval number 2022-11 [4]) and conducted in accordance with the principles of the Declaration of Helsinki and its amendments.
| Results | ▴Top |
Fifty-five patients met the criteria for measurement of FD during hospitalization (Table 1). Metformin was newly introduced in 30 patients and an SGLT2i in 25. The median daily dose of metformin was 1,000 mg (IQR: 500 - 1,000). The SGLT2i was luseogliflozin in 12 cases, empagliflozin in seven, ipragliflozin in three, tofogliflozin in two, and dapagliflozin in one. There was no statistically significant difference between the metformin and SGLT2i groups in terms of median age (56.0 vs. 60.0 years), proportion of men (70.0% vs. 60.0%), mean body weight (67.3 vs. 66.5 kg), mean body mass index (25.3 vs. 25.8; calculated as kg/m2), median duration of diabetes (6 vs. 3 years), or median HbA1c at admission (10.2% vs. 9.5%).
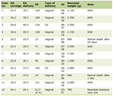 Click to view | Table 1. Baseline Characteristics of the Patients Who Were Taking Metformin or SGLT2i |
The median numbers of days on which FD was recorded before and after starting treatment were 7.0 (IQR: 4.8 - 10.0) and 6.0 (IQR: 5.0 -10.3), respectively, in the metformin group and 7.0 (IQR: 3.5 - 9.5) and 7.0 (IQR: 5.0 - 9.5) in the SGLT2i group (Table 2). The median number of days until measurement of FD was started after initiating treatment was 0 (IQR: 0 - 3) in the metformin group and 0 (IQR: 0 - 0) in the SGLT2i group; the between-group difference was statistically significant (P = 0.014; Table 2). There was no statistically significant difference in the mean FD between the metformin group and the SGLT2i group before starting treatment (0.70 ± 0.19 vs. 0.74 ± 0.21 times/day, P = 0.428; Fig. 1a (left panel) and Table 2). However, after starting treatment, the FD was significantly higher in the metformin group than in the SGLT2i group (0.83 ± 0.18 vs. 0.73 ± 0.20 times/day, P = 0.047; Fig. 1a (right panel) and Table 2). There was a significant difference in FD between before and after initiation of treatment in the metformin group (0.70 ± 0.19 vs. 0.83 ± 0.18 times/day, r = 0.428, P = 0.001, paired t-test; Fig. 1b, line (left) and dot plot (right) comparisons), but not in the SGLT2i group (0.74 ± 0.21 vs. 0.73 ± 0.20 times/day, respectively, r = -0.115, P = 0.811, paired t-test; Fig. 1c, line (left) and dot plot (right) comparisons). Although there was no statistically significant difference in the ΔFD (FD after starting treatment - FD before starting treatment) between the two groups (P = 0.062; Table 2), there was a clear difference in its distribution; the ΔFD in the metformin group was concentrated in the positive direction overall (median 0.06 times/day (IQR: 0.00 - 0.29)) whereas that in the SGLT2i group showed fluctuations above and below centering on zero (median 0.00 times/day (IQR: -0.24 - 0.27)). The median FD ratio before and after initiation of treatment was greater in the metformin group than in the SGLT2i group (1.22-fold vs. 1.00-fold); the between-group difference was not statistically significant (P = 0.110; Table 2). The incidence of diarrhea after administration of metformin or an SGLT2i during hospitalization was slightly higher in the metformin group than in the SGLT2i group but the difference was not significant (10.0% vs. 4.0%, P = 0.394; Table 2). Considering that most of the patients achieved good glycemic control during their hospital stay, the mean HbA1c was expectedly improved in the metformin group and SGLT2i group with no significant between-group difference at 1.5 months after discharge (7.34±0.81% vs. 7.20±0.69%, P = 0.477; Table 2) or at 6 months after discharge (6.95±0.90% vs. 6.74±0.85%, P = 0.399; Table 2). Other than introduction of metformin or an SGLT2i, there was no significant difference in use of antidiabetic medication during hospitalization, including of agents that had been used continuously since before admission to hospital and/or those that were newly introduced. Laxatives were used to treat constipation during hospitalization. There was no significant difference in the use of osmotic laxatives between the metformin group and the SGLT2i group (10.0% vs. 8.0%, P = 0.797; Table 2). Use of stimulant laxatives appeared to be less common in the metformin group than in the SGLT2i group but the difference was not statistically significant (23.3% vs. 40.0%, P = 0.183; Table 2).
Click to view | Table 2. Frequency of Defecation Parameters and Characteristics of the Patients After Admission According to Type of Treatment Initiated |
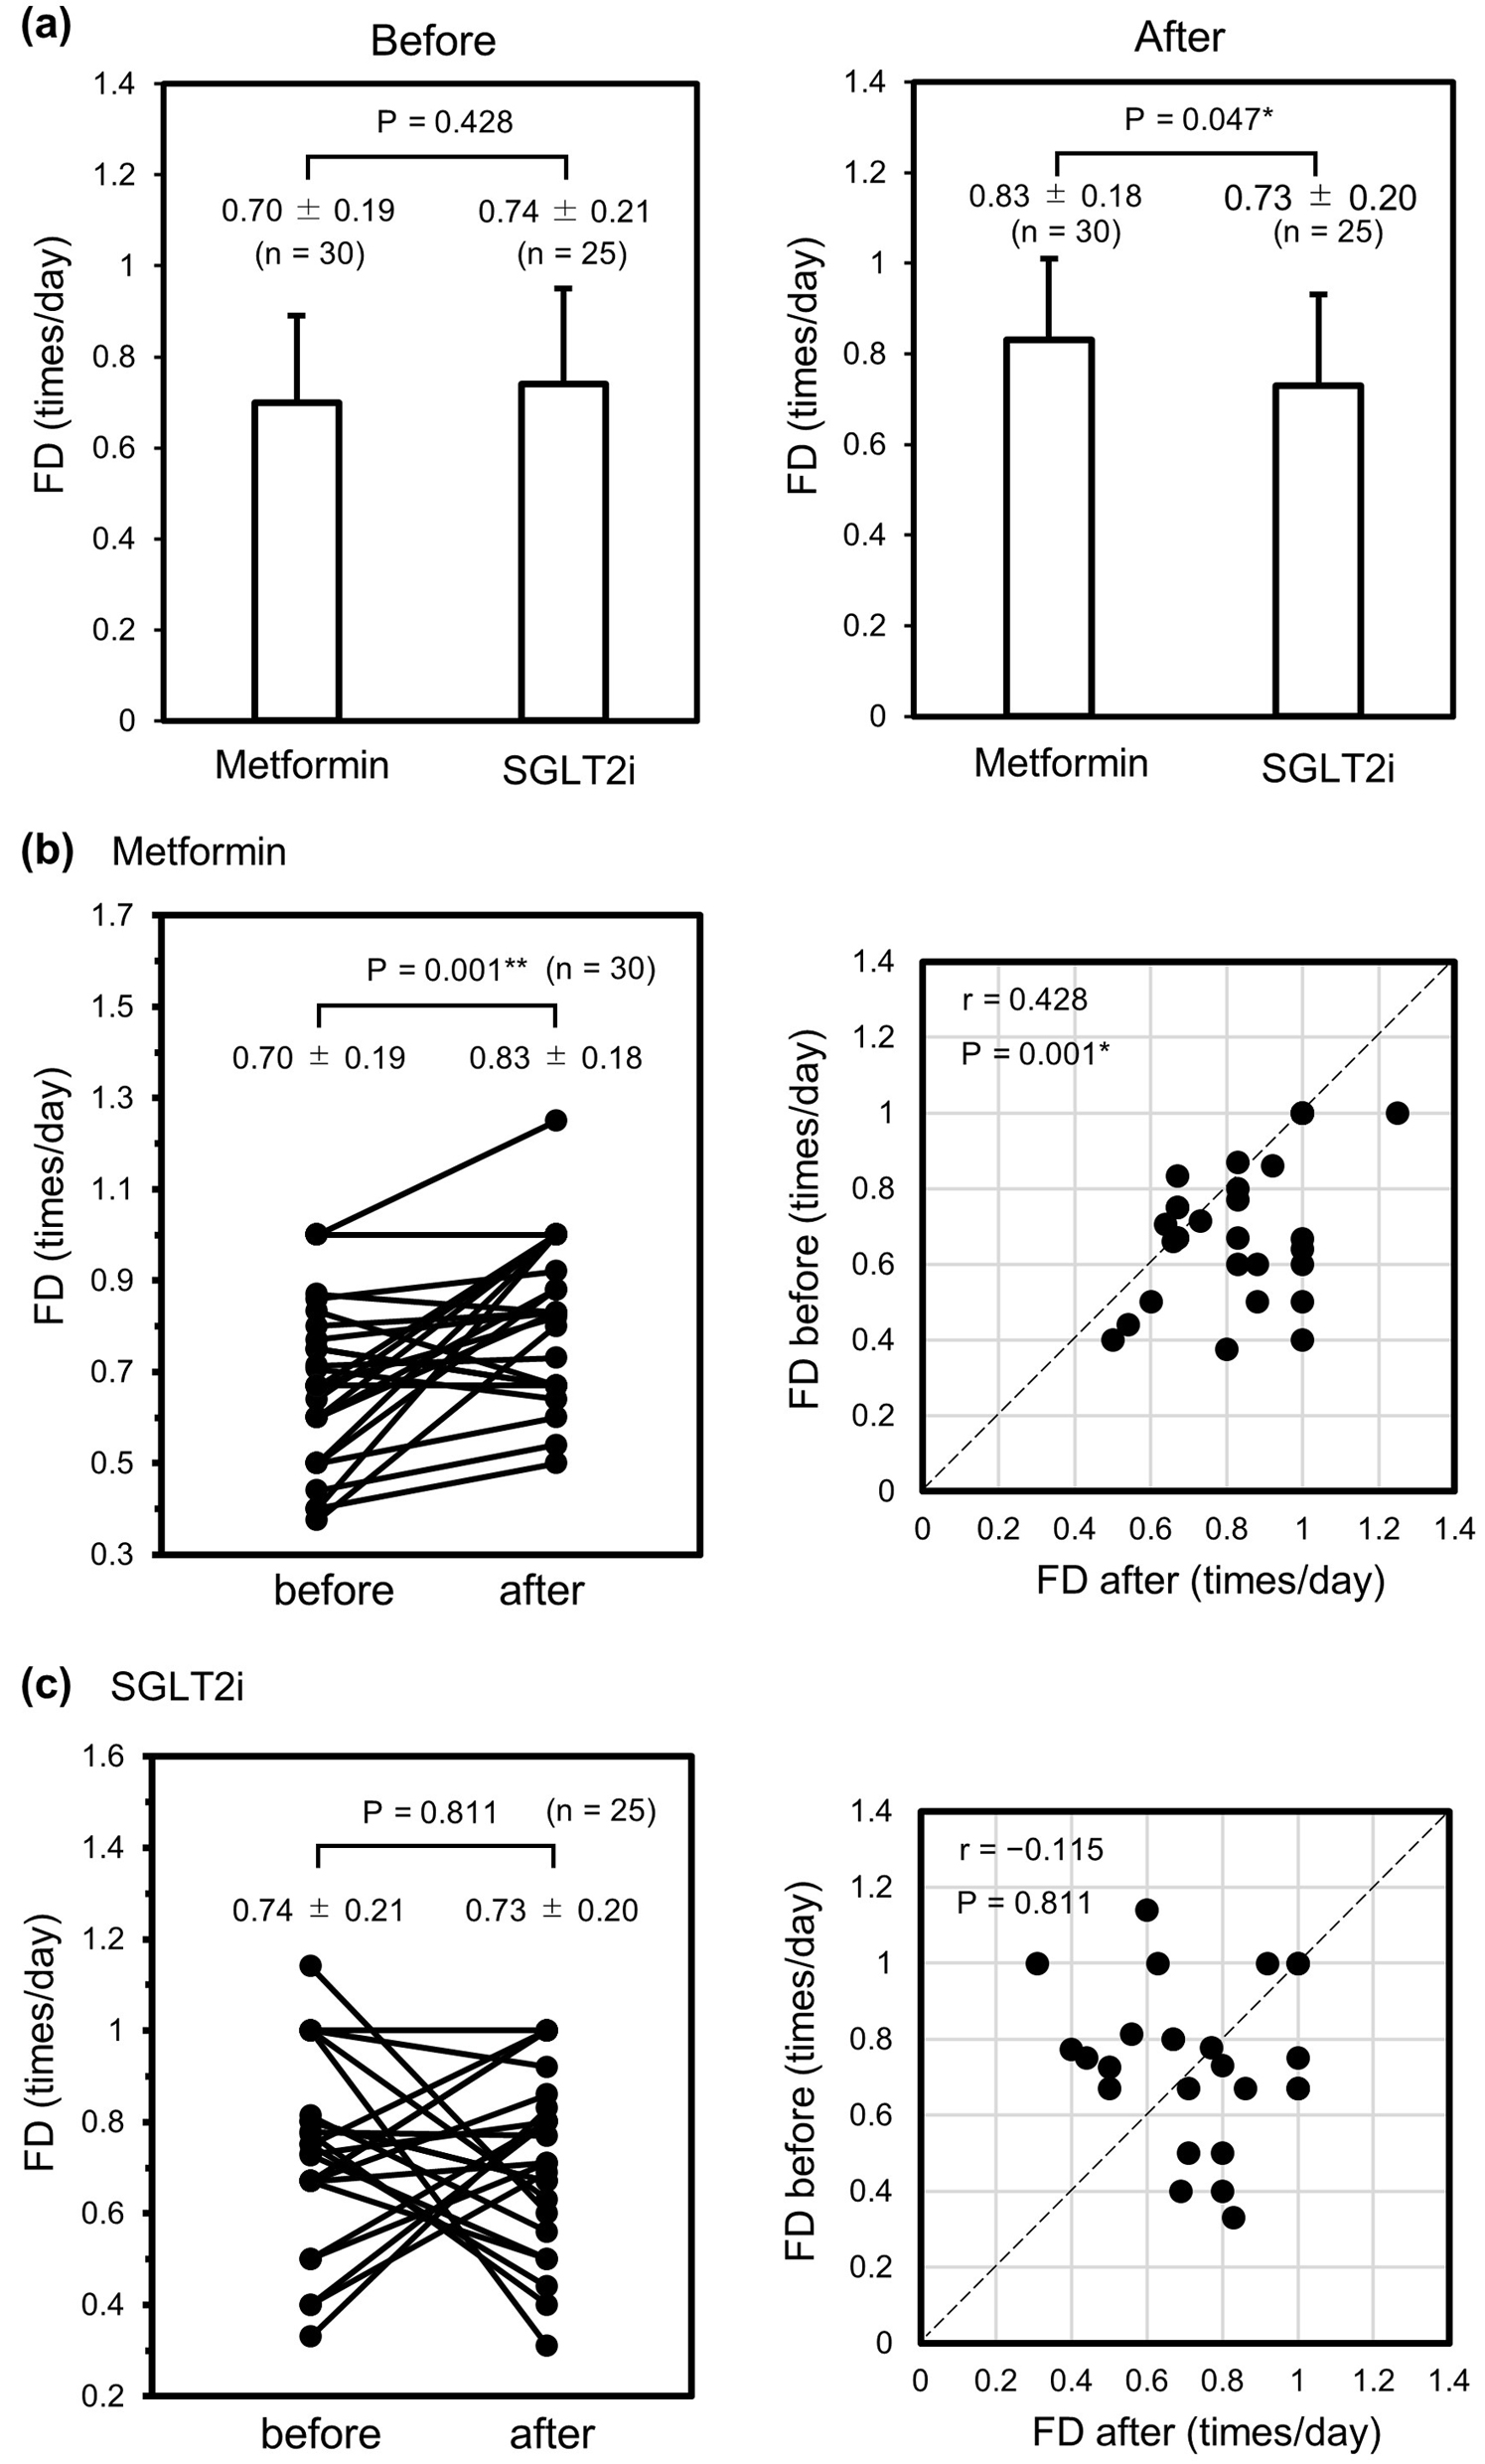 Click for large image | Figure 1. Changes in FD before and after administration of metformin or an SGLT2i during hospitalization. (a) Comparison of FD before (left panel) and after (right panel) initiation of metformin (n = 30) or an SGLT2i (n = 25). (b) Line (left) and dot plot (right) comparisons of FD among individuals in the metformin group. (c) Line (left) and dot plot (right) comparisons of FD among individuals in the SGLT2i group. Data were analyzed using the unpaired t-test in (a) and the paired t-test in (b) and (c). *P < 0.05. **P < 0.01. FD: frequency of defecation; SGLT2i: sodium-glucose cotransporter-2 inhibitor. |
Next, we examined the relationship between ΔFD and FD before initiation of treatment using Spearman’s correlation analysis (Fig. 2). In both treatment groups, ΔFD showed a significant negative correlation with FD before initiation of treatment (ρ = -0.670, P < 0.0001 in the metformin group (Fig. 2a) vs. ρ = -0.747, P < 0.0001 in the SGLT2i group (Fig. 2b)). The regression line showed an overall positive shift in the metformin group when compared with the regression line in the SGLT2i group. These results suggest that the inverse correlation between ΔFD and FD before initiation of treatment was not attributable to the effect of metformin but that metformin promoted FD overall.
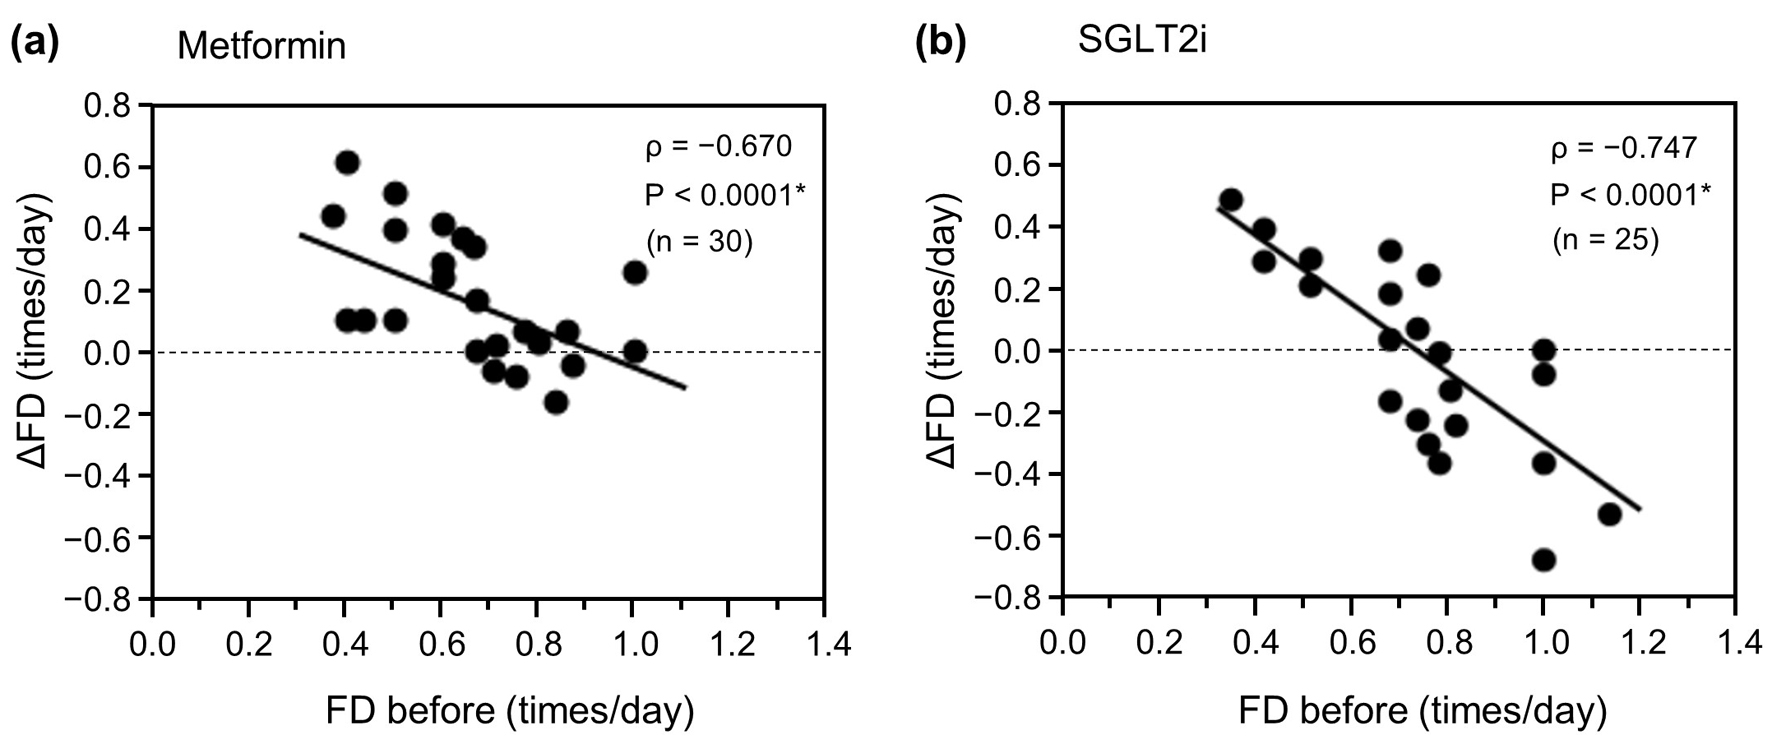 Click for large image | Figure 2. Relationship between ΔFD and FD before initiation of metformin or an SGLT2i. (a) Metformin group (n = 30). (b) SGLT2i group (n = 25). Data were analyzed using Spearman’s correlation analysis. *P < 0.01. ΔFD: change in FD; FD: frequency of defecation; SGLT2i: sodium-glucose cotransporter-2 inhibitor. |
Finally, we examined the associations of FD variables with the ΔHbA1c between 1.5 and 6 months after starting treatment using Spearman’s correlation analysis or the unpaired t-test (Fig. 3). In the metformin group (n = 30), there was no significant association between the increase in ΔFD or the FD ratio during treatment and the ΔHbA1c (ρ = 0.078, P = 0.682 (Fig. 3a) and ρ = 0.034, P = 0.857 (Fig. 3b), respectively). However, there was a significant negative correlation between FD before starting treatment and the ΔHbA1c (r = -0.467, P = 0.009; Fig. 3c) and between FD after starting treatment and the ΔHbA1c, with an overall rightward parallel shift of FD (r = -0.509, P = 0.004; Fig. 3d). These findings indicate that an improvement in ΔHbA1c is associated with FD but not with a change in FD and is associated not only with the FD after starting medication but also with that before starting medication. Conversely, in the SGLT2i group (n = 25), there was no significant relationship between ΔHbA1c and ΔFD or FD ratio before and after starting treatment (ρ = 0.133, P = 0.528 (Fig. 3e) and ρ = 0.084, P = 0.659 (Fig. 3f), respectively), or FD before or after starting treatment (r = -0.108, P = 0.606 (Fig. 3g) or r = 0.078, P = 0.710 (Fig. 3h), respectively).
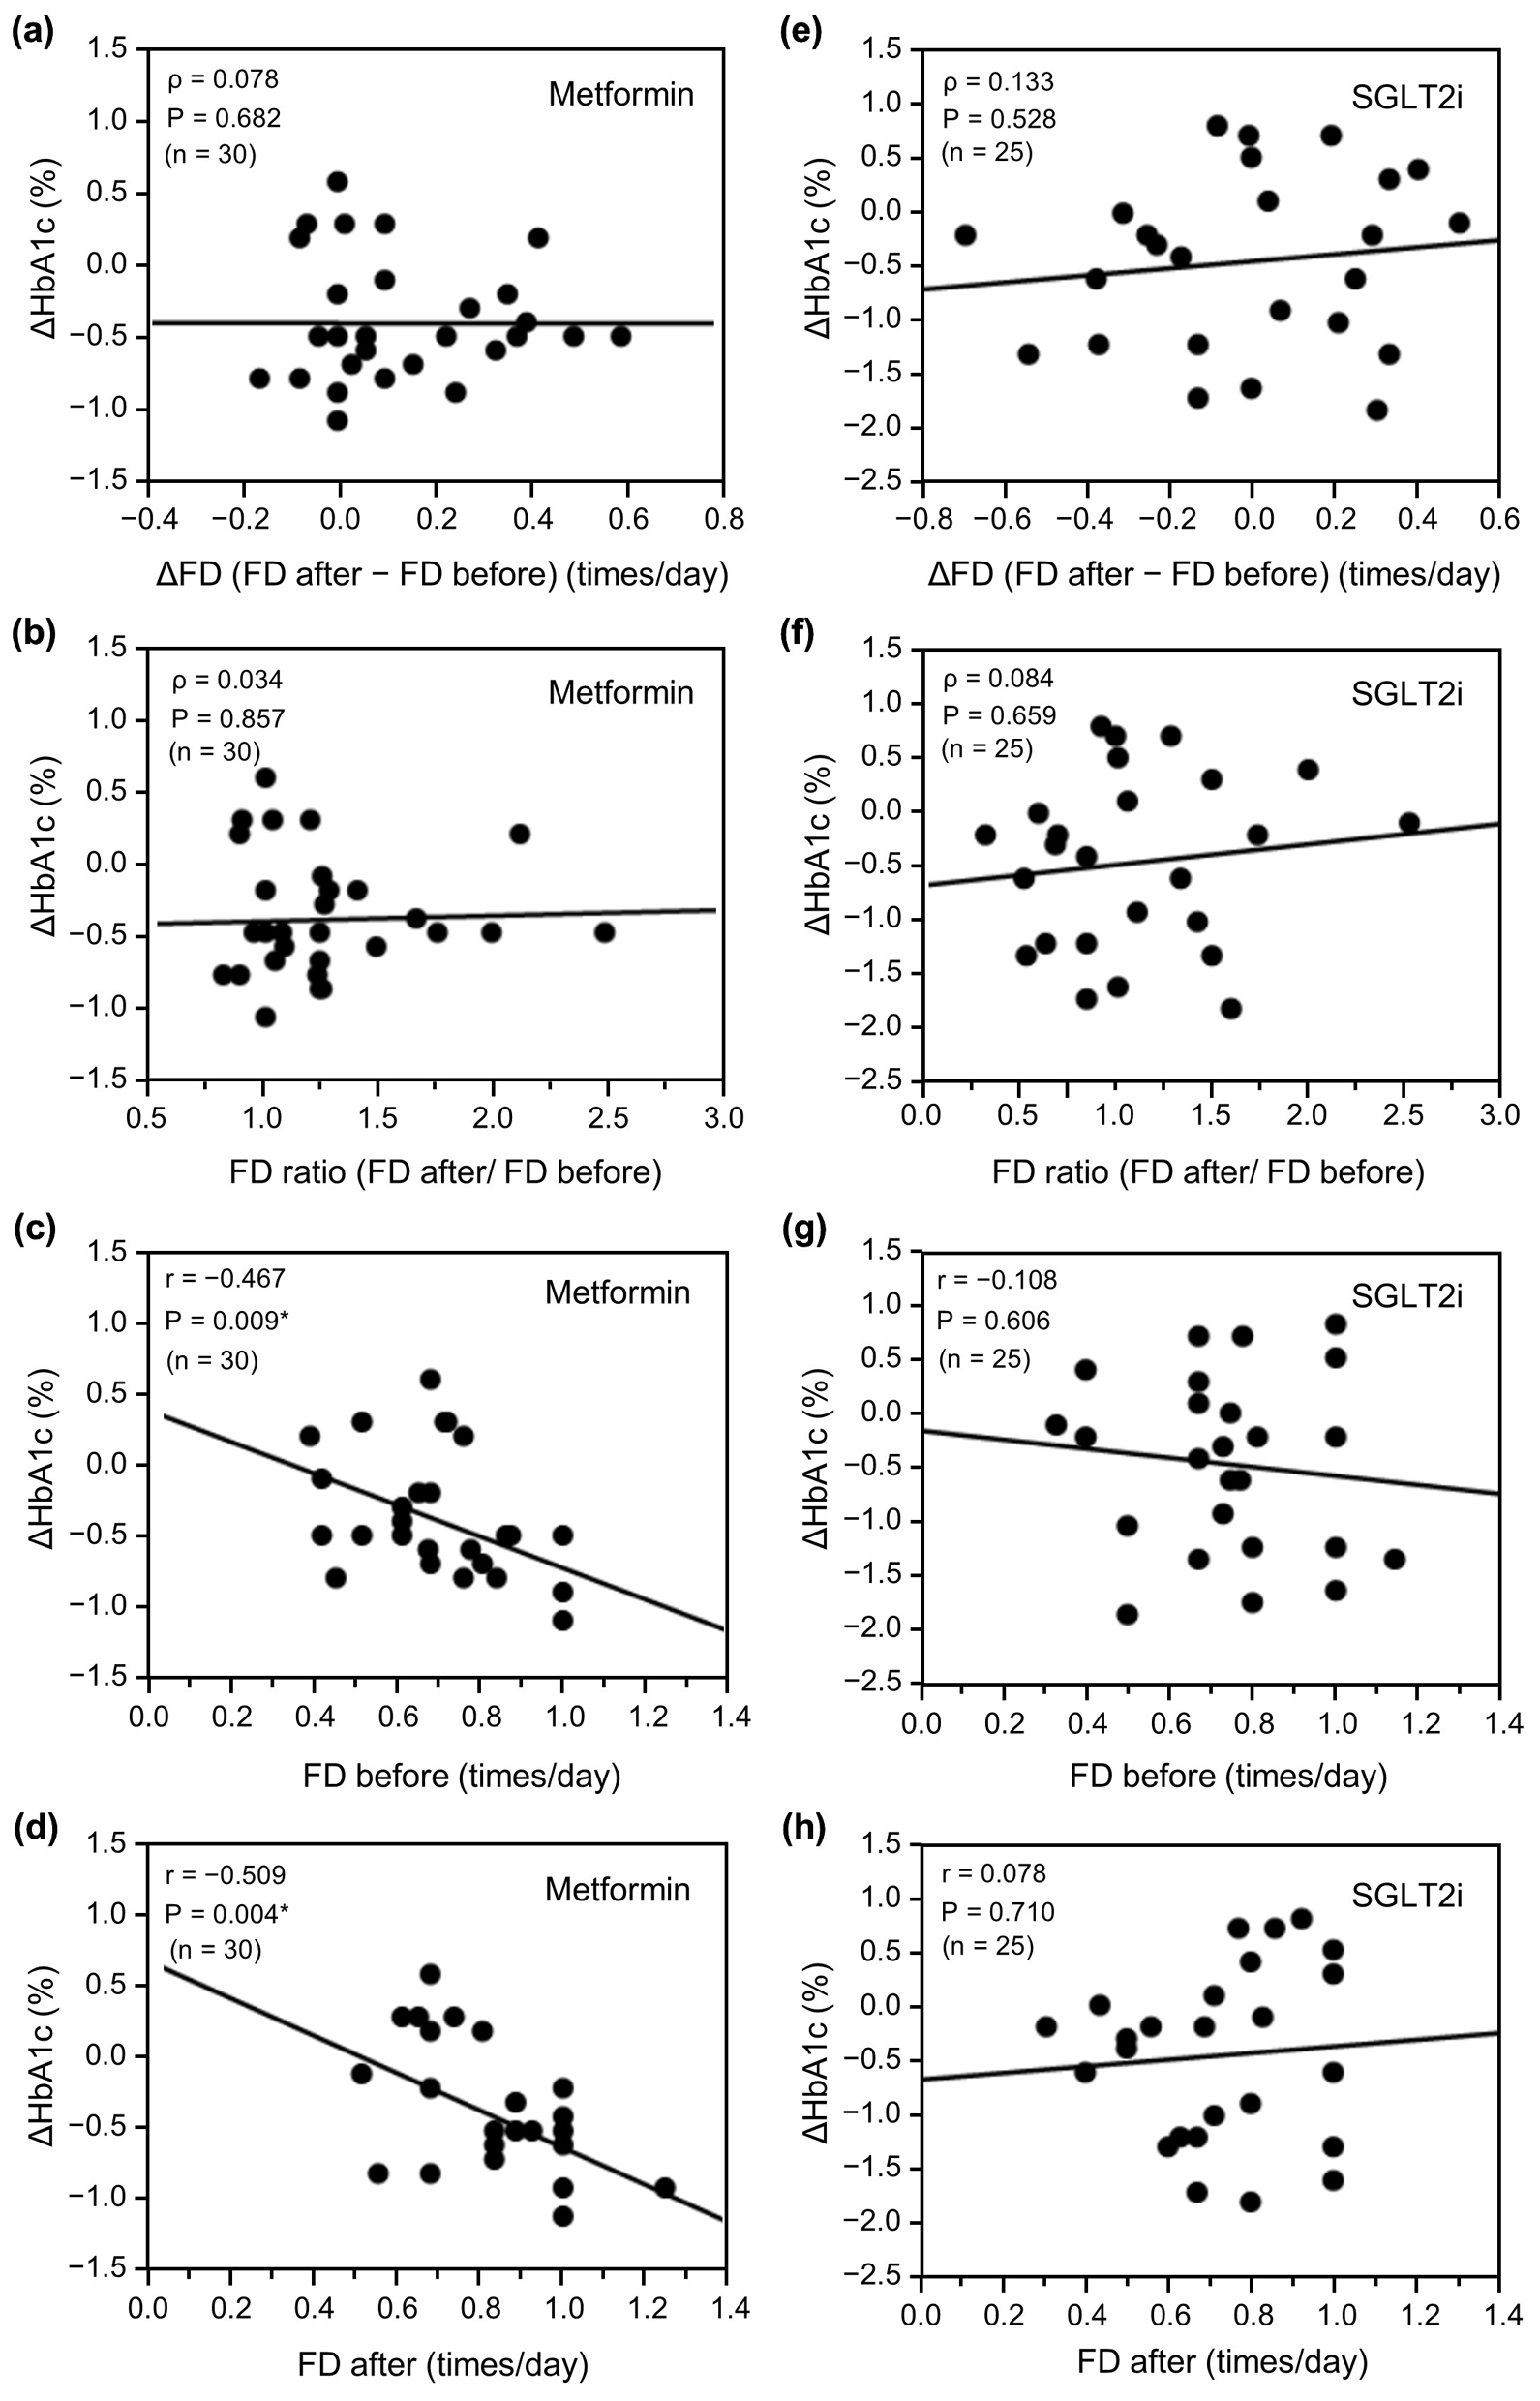 Click for large image | Figure 3. Relationship between ΔHbA1c and change in FD (ΔFD or FD ratio) or FD before and after initiation of metformin (n = 30) or an SGLT2i (n = 25). (a) ΔFD after initiation of metformin, (b) FD ratio before and after initiation of metformin, (c) FD before initiation of metformin, (d) FD after initiation of metformin, (e) ΔFD after initiation of SGLT2i, (f) FD ratio before and after initiation of SGLT2i, (g) FD before initiation of SGLT2i, and (h) FD after initiation of SGLT2i. Data in (a), (b), (e), and (f) were analyzed using Spearman’s correlation analysis and data in (c), (d), (g), and (h) were analyzed using the unpaired t-test. *P < 0.01. ΔHbA1c: change in glycated hemoglobin; ΔFD: change in FD; FD: frequency of defecation; SGLT2i: sodium-glucose cotransporter-2 inhibitor. |
In the metformin group, seven patients used a stimulant laxative during hospitalization. One of these patients had been using a stimulant laxative before admission and had achieved an excellent FD of 1.0 times daily before starting treatment. However, the other six patients had not previously received a stimulant laxative and used one for the first time during hospitalization. The FD was significantly lower before starting metformin in these patients than in those who did not use stimulant laxatives (0.53 ± 0.15 vs. 0.73 ± 0.17 times/day, P = 0.018, respectively); although the difference was not significant, the mean FD after starting metformin was also lower in these patients (0.71 ± 0.18 vs. 0.84 ± 0.15 times/day, P = 0.065).
In view of the small sample size, we repeated the multiple regression analysis with a fixed FD value and adding various explanatory variables that may affect defecation. As shown in Table 3, the respective P-values for FD before and after starting metformin were 0.017 and 0.012 after adjusting for age and sex, 0.027 and 0.001 after adjusting for duration of diabetes and use of a stimulant laxative, 0.012 and 0.004 after adjusting for use of a GLP-1 receptor agonist and an osmotic laxative, 0.015 and 0.007 after adjusting for diabetic polyneuropathy and smoking, and 0.025 and 0.024 after adjusting for diabetic nephropathy and alcohol consumption. Even after adjusting for these variables, there were still statistically significant differences for both FD before and after starting metformin (P < 0.05), with FD after starting metformin being more significant than FD before starting it. However, it is possible that the association between ΔHbA1c and FD was already established before starting treatment. In contrast, the P-values for FD before and after starting an SGLT2i indicated no significant differences after adjusting for each of the above-mentioned combinations of explanatory variables (data not shown).
Click to view | Table 3. Multiple Regression Analysis Showing the Relationships Between ΔHbA1c and Variables in the Metformin Group |
| Discussion | ▴Top |
Metformin has a dose-dependent blood glucose-lowering effect but is associated with adverse effects in the gastrointestinal tract, including diarrhea, that occur during the early stages of treatment. Although it has been suggested that there is a relationship between adverse effects and improved glycemic control in the clinical setting, no studies have quantified this relationship. In the present study, we found that metformin increased FD but improvement in HbA1c did not appear to depend on an increase in FD and seemed to depend on both the pretreatment FD and the FD after starting treatment with metformin. Our findings indicate that the FD before the dose-dependent effects of metformin were exerted had a relationship with the subsequent blood glucose-lowering effect, suggesting that the effects of metformin may be influenced by both the pretreatment FD and conventional dose dependence. Therefore, we should consider the effect of metformin in terms of increased FD and glycemic control separately. We found that even if FD increases after starting on metformin, the expected blood glucose-lowering effect cannot be obtained unless the absolute FD is sufficiently high. The beneficial effects of metformin are more likely to be obtained in patients who already have a high FD before treatment, and those without constipation may be better candidates for metformin. If so, it may be necessary to increase FD by use of laxatives before starting treatment to increase the effectiveness of metformin. It is currently unclear whether metformin has the same effect when the daily FD approaches approximately 1.0 in constipated patients using stimulant laxatives. Further studies are necessary to answer this interesting question.
In this study, the frequency of diarrhea as a side effect of metformin was not significantly different from that in the control group when the median dose of metformin was about 1,000 mg/day. As mentioned above, it is well known that metformin has a dose-dependent blood glucose-lowering effect. Considering that it is desirable to start with a small dose of metformin and gradually increase it to reduce the problem of diarrhea, it was often not possible to prescribe the maximum dose during hospitalization in this study. Furthermore, one of our study eligibility criteria was no change in the metformin dose for 6 months after discharge, so there were not many patients taking metformin at a dose ≥ 1,500 mg/day. Indeed, we confirmed a tendency for higher doses of metformin to improve ΔHbA1c, especially in the population with a naturally high FD before treatment. Therefore, FD after starting metformin might have contributed more to ΔHbA1c with addition of dose-dependent effects than FD before starting treatment when there were no dose effects. However, we have not focused on this finding in this paper in view of the small sample size. Further research is needed to determine whether metformin exerts a dose-dependent glycemic lowering effect, including at a high dose (≥ 1,500 mg/day), in a pretreatment FD-associated manner.
There was no relationship between the increase in FD or the FD ratio and ΔHbA1c in the metformin group in this study. However, there was a significant increase in FD after starting metformin. As shown in Figure 2, metformin may suppress constipation in the population with a naturally high FD and may increase FD even more in the population with a naturally low FD. As a result, metformin seems to increase FD overall. It is unclear whether the increase in FD induced by metformin in this study was the result of changes in the composition of and/or the metabolites produced by the intestinal microbiota, such as Akkermansia [15], and concentrations of short-chain fatty acids, which are reported to be associated with gastrointestinal adverse events [16], or a consequence of other effects, such as greater pooling of bile acids or secretion of serotonin. Future research may elucidate whether these changes occur within approximately 1 week after starting metformin, as observed in this study. Metformin-induced excretion of glucose was recently identified in the terminal ileum [9] but could not be assessed quantitatively. SGLT2i agents inhibit reabsorption of glucose in the renal proximal tubules, causing loss of glucose in urine and reducing the blood glucose concentration [17]. Indeed, SGLT2i users excrete many grams of glucose in the urine every day [18]. Thus, an analogous clinically meaningful loss of glucose into the gut occurs in metformin users, which may cause changes in the composition of the intestinal microbiota, such as in the abundance of short-chain fatty acid-producing bacteria, and an increase in fecal water content secondary to glucose excretion into the gut lumen; bowel movements may also be promoted, leading to an increase in FD. Therefore, accurate measurements of the loss of glucose into the intestinal tract, determining the time to onset of action of metformin, and further studies of its effects on the intestinal microbiota and FD are required.
The present study had some limitations that should be considered. First, it had a single-center observational design and the sample size was small. Second, the data were collected from medical records and FD was self-reported, so the possibility of recall bias cannot be excluded. Third, other antidiabetic agents were being used in addition to metformin by many of the patients in the study. The effects of these agents cannot be excluded, especially their blood glucose-lowering effect. Our present findings cannot be generalized because of the small sample size but should be validated in a large-scale study in the future. A multicenter prospective long-term study of metformin as monotherapy in a larger cohort is necessary to clarify the effects of metformin on defecation and how to use metformin more effectively.
In conclusion, metformin improves HbA1c in patients with T2DM in an FD-associated manner but not in an FD change-associated manner. Considering that ΔHbA1c was associated with FD both before and after starting medication, we suggest that the effects of metformin may be influenced by the pretreatment FD as well as conventional dose dependence. However, metformin did increase the FD, but the reason for this phenomenon is presently unknown.
Acknowledgments
None to declare.
Financial Disclosure
None to declare.
Conflict of Interest
KH received lecture honoraria from Kowa Company. HJ has received honoraria from Novo Nordisk, Sanofi, AstraZeneca Pharmaceuticals, Astellas Pharma, Boehringer Ingelheim, Daiichi-Sankyo, Eli Lilly, Takeda, and Novartis Pharmaceuticals. SS has received honoraria from AstraZeneca Pharmaceuticals and Ono Pharmaceutical. There is no other potential conflict of interest relevant to this article.
Informed Consent
Written informed consent was obtained from all patients who were enrolled in the study.
Author Contributions
KH and HJ contributed to the analysis design, acquisition and interpretation of data and reviewed/edited the manuscript. SS, AY, NK, TS, KO, FM, KK, KJ and TJ contributed to the acquisition and interpretation of data and reviewed/edited the manuscript. All authors read and approved the final manuscript.
Data Availability
The authors declare that all the data supporting the findings of this study are available within the article.
Abbreviations
FD: frequency of defecation; GLP-1: glucagon-like peptide-1; HbA1c: glycated hemoglobin; SGLT2i: sodium-glucose cotransporter-2 inhibitor; T2DM: type 2 diabetes mellitus
| References | ▴Top |
- Zhou G, Myers R, Li Y, Chen Y, Shen X, Fenyk-Melody J, Wu M, et al. Role of AMP-activated protein kinase in mechanism of metformin action. J Clin Invest. 2001;108(8):1167-1174.
doi pubmed pmc - Miller RA, Chu Q, Xie J, Foretz M, Viollet B, Birnbaum MJ. Biguanides suppress hepatic glucagon signalling by decreasing production of cyclic AMP. Nature. 2013;494(7436):256-260.
doi pubmed pmc - Duca FA, Cote CD, Rasmussen BA, Zadeh-Tahmasebi M, Rutter GA, Filippi BM, Lam TK. Metformin activates a duodenal Ampk-dependent pathway to lower hepatic glucose production in rats. Nat Med. 2015;21(5):506-511.
doi pubmed pmc - Borg MJ, Bound M, Grivell J, Sun Z, Jones KL, Horowitz M, Rayner CK, et al. Comparative effects of proximal and distal small intestinal administration of metformin on plasma glucose and glucagon-like peptide-1, and gastric emptying after oral glucose, in type 2 diabetes. Diabetes Obes Metab. 2019;21(3):640-647.
doi pubmed - Zhang E, Jin L, Wang Y, Tu J, Zheng R, Ding L, Fang Z, et al. Intestinal AMPK modulation of microbiota mediates crosstalk with brown fat to control thermogenesis. Nat Commun. 2022;13(1):1135.
doi pubmed pmc - Buse JB, DeFronzo RA, Rosenstock J, Kim T, Burns C, Skare S, Baron A, et al. The primary glucose-lowering effect of metformin resides in the gut, not the circulation: results from short-term pharmacokinetic and 12-week dose-ranging studies. Diabetes Care. 2016;39(2):198-205.
doi pubmed - McCreight LJ, Bailey CJ, Pearson ER. Metformin and the gastrointestinal tract. Diabetologia. 2016;59(3):426-435.
doi pubmed pmc - Morita Y, Nogami M, Sakaguchi K, Okada Y, Hirota Y, Sugawara K, Tamori Y, et al. Enhanced release of glucose into the intraluminal space of the intestine associated with metformin treatment as revealed by [(18)F]Fluorodeoxyglucose PET-MRI. Diabetes Care. 2020;43(8):1796-1802.
doi pubmed - Bonnet F, Scheen A. Understanding and overcoming metformin gastrointestinal intolerance. Diabetes Obes Metab. 2017;19(4):473-481.
doi pubmed - Lewis SJ, Heaton KW. Stool form scale as a useful guide to intestinal transit time. Scand J Gastroenterol. 1997;32(9):920-924.
doi pubmed - Hieshima K, Sugiyama S, Yoshida A, Kurinami N, Suzuki T, Ijima H, Miyamoto F, et al. Elevation of the renal threshold for glucose is associated with insulin resistance and higher glycated hemoglobin levels. J Diabetes Investig. 2020;11(3):617-625.
doi pubmed pmc - Haneda M, Noda M, Origasa H, Noto H, Yabe D, Fujita Y, Goto A, et al. Japanese clinical practice guideline for diabetes 2016. Diabetol Int. 2018;9(1):1-45.
doi pubmed pmc - The Japan Diabetes Society. Nihonjin no tounyoubyou no shokuji ryouhou ni kansuru nihon tounyoubyou gakkai no teigen tounyoubyou ni okeru shokuji ryouhou no genjyou to kadai (Proposals by the Japan Diabetes Society on medical nutrition therapy for Japanese patients with diabetes current status and issues of nutrition therapy for diabetes mellitus). 2013 (in Japanese). http://www.jds.or.jp/modules/important/index.php?content_id=40.
- Yasuda H, Sanada M, Kitada K, Terashima T, Kim H, Sakaue Y, Fujitani M, et al. Rationale and usefulness of newly devised abbreviated diagnostic criteria and staging for diabetic polyneuropathy. Diabetes Res Clin Pract. 2007;77(Suppl 1):S178-183.
doi pubmed - de la Cuesta-Zuluaga J, Mueller NT, Corrales-Agudelo V, Velasquez-Mejia EP, Carmona JA, Abad JM, Escobar JS. Metformin is associated with higher relative abundance of mucin-degrading Akkermansia muciniphila and several short-chain fatty acid-producing microbiota in the gut. Diabetes Care. 2017;40(1):54-62.
doi pubmed - Huang Y, Lou X, Jiang C, Ji X, Tao X, Sun J, Bao Z. Gut microbiota is correlated with gastrointestinal adverse events of metformin in patients with type 2 diabetes. Front Endocrinol (Lausanne). 2022;13:1044030.
doi pubmed pmc - DeFronzo RA, Norton L, Abdul-Ghani M. Renal, metabolic and cardiovascular considerations of SGLT2 inhibition. Nat Rev Nephrol. 2017;13(1):11-26.
doi pubmed - Ghezzi C, Yu AS, Hirayama BA, Kepe V, Liu J, Scafoglio C, Powell DR, et al. Dapagliflozin binds specifically to sodium-glucose cotransporter 2 in the proximal renal tubule. J Am Soc Nephrol. 2017;28(3):802-810.
doi pubmed pmc
This article is distributed under the terms of the Creative Commons Attribution Non-Commercial 4.0 International License, which permits unrestricted non-commercial use, distribution, and reproduction in any medium, provided the original work is properly cited.
Journal of Endocrinology and Metabolism is published by Elmer Press Inc.