

| Journal of Endocrinology and Metabolism, ISSN 1923-2861 print, 1923-287X online, Open Access |
| Article copyright, the authors; Journal compilation copyright, J Endocrinol Metab and Elmer Press Inc |
| Journal website https://www.jofem.org |
Original Article
Volume 12, Number 3, June 2022, pages 102-106

Risk of Dyslipidemia in Obese Young Adult Subjects as Measured by Various Obesity Indices
Roghaya Yudina, b, c, e ![]() , Andi Makbul Amana, b, c
, Andi Makbul Amana, b, c ![]() , Haerani Rasyidb, c
, Haerani Rasyidb, c ![]() , Syakib Bakrib, c
, Syakib Bakrib, c ![]() , Himawan Sanusia, b, c
, Himawan Sanusia, b, c ![]() , Nu’man As Daudb, c
, Nu’man As Daudb, c ![]() , Andi Alfian Zainuddind
, Andi Alfian Zainuddind ![]()
aSub-Division of Endocrinology, Metabolism, and Diabetes, Department of Internal Medicine, Faculty of Medicine, Hasanuddin University, Makassar, Indonesia
bDepartment of Internal Medicine, Faculty of Medicine, Hasanuddin University, Makassar, Indonesia
cWahidin Sudirohusodo Hospital, Makassar, Indonesia
dDepartment of Biostatistics, Faculty of Public Health, Hasanuddin University, Makassar, Indonesia
eCorresponding Author: Roghaya Yudin, Department of Internal Medicine, Faculty of Medicine, Hasanuddin University, Makassar, South Sulawesi, Indonesia
Manuscript submitted June 2, 2022, accepted June 17, 2022, published online June 27, 2022
Short title: Risk of Dyslipidemia in Obese Young Adult
doi: https://doi.org/10.14740/jem819
| Abstract | ▴Top |
Background: Obesity is strongly associated with atherogenic dyslipidemia phenotype and is an independent risk factor of cardiovascular disease (CVD). Besides body mass index (BMI), there are various obesity indices, namely waist circumference (WC) to detect central obesity, and percentage of body fat (%BF) using bioimpedance analysis (BIA) to detect peripheral-central obesity. The aim of this study is to determine which obesity index is better in predicting dyslipidemia.
Methods: This cross-sectional study involved 99 professionally active doctors working at tertiary hospital, from January to March 2021. Obesity was measured by obesity indices such as BMI, WC, and %BF using BIA. After that, the serum lipid profile was then measured. Dyslipidemia is a disorder of lipoprotein metabolism, including lipoprotein overproduction or deficiency that may be manifested by high total cholesterol, low-density lipoprotein (LDL) cholesterol, triglycerides, and low high-density lipoprotein cholesterol (HDL) cholesterol.
Results: Of the total 99 subjects, 49.5% were male, while 50.5% were female. The prevalence of obesity based on BMI, WC, and %BF using BIA was 57.6%, 74.8%, and 72.7%, respectively. Obesity based on BMI has 9.8 times the risk of having low HDL cholesterol levels (odds ratio (OR) = 9.814, 95% confidence interval (CI): 1.213 - 79.379) and 4.6 times of having high triglycerides levels (OR = 4.618, 95% CI: 1.240 - 17.204). Meanwhile, central obesity based on WC has 3.1 times the risk of having high LDL cholesterol levels (OR = 3.100, 95% CI: 1.170 - 8.218). On the contrary, the results of the analysis on obesity based on %BF on lipid profile were not significant.
Conclusions: Obesity based on BMI and WC measurements are better than %BF in predicting dyslipidemia.
Keywords: Dyslipidemia; Obesity indices; Young adult
| Introduction | ▴Top |
Obesity is excessive fat accumulation due to an imbalance in energy intake with energy expenditure over an extensive period of time. Several methods have been employed to measure obesity other than by body mass index (BMI), namely by waist circumference (WC), which is used to determine central obesity, and by the estimation of body fat percentage using bioimpedance analysis (BIA). All of these methods produce different results in predicting morbidity and mortality [1-3].
Central obesity is more susceptible to various obesity-related diseases than peripheral obesity and is strongly associated with atherogenic dyslipidemia which is the combination of raised triglycerides (TG) and low concentration of high-density lipoprotein cholesterol (HDL-C) together with elevated apolipoprotein B (ApoB), small dense low-density lipoprotein (sdLDL) and small HDL particles (sHDL), all of which are independently atherogenic. Increased visceral adipose tissue is closely related to higher triglyceride levels and lower HDL cholesterol levels. This occurs due to structural and functional changes in adipocytes, which make them insulin resistant, which in turn contribute to the production of sdLDL and a decrease in HDL-C levels, substantially influencing the development of atherosclerosis [4, 5].
A reliable and more sensitive method of measuring obesity is therefore extremely needed, especially to detect lipid metabolism disorders. This study aims to determine which obesity index is better at predicting dyslipidemia in non-diabetic young adult population.
| Materials and Methods | ▴Top |
Subjects
This cross-sectional study involved 99 professionally active doctors working at a tertiary hospital, from February to March 2021. The inclusion criteria were: 1) patients being in the age range of 25 - 40 years; 2) patients not suffering from diabetes mellitus; 3) patients not taking lipid-lowering drugs. Written informed consent was obtained following a detailed explanation of the procedures that they may undergo.
Objective criteria
Nutritional status as measured by BMI of 25 kg/m2 is categorized as obese, whereas central obesity is defined by WC of > 90 cm for men and > 80 cm for women. The high percentage of body fat (%BF) based on BIA was > 25% for men and > 35% for women. After that, the serum lipid profile was measured. Total cholesterol (TC) of 200 mg/dL is considered high, LDL cholesterol (LDL-C) of 130 mg/dL is considered high, HDL-C of < 40 mg/dL is considered low in men, and < 50 mg/dL in women, and TG of 150 mg/dL is considered high.
Statistical analysis
Data were analyzed using SPSS version 26. The Kolmogorov-Smirnov test was used to analyze for normality. Bivariate analysis aims to determine the relationship of the dependent variables, namely the lipid profile with the independent variables using the Chi-square test, with odds ratio (OR) values adjusted for gender. The results of the statistical test were considered significant if the P value was < 0.05.
Ethical approval
The research procedure has been considered and approved by the Biomedical Research Commission on February 16, 2021, with the number 92/UN4.6.4.5.31/PP36/2021. This study was conducted in compliance with the ethical standards of the responsible institution on human subjects as well as with the Helsinki Declaration.
| Results | ▴Top |
Of the 99 research subjects, 49 of them or 49.5% of the subjects were male, while 50 or 50.5% of the subjects were female, with the mean age being 31 years (25 - 39 years). The mean BMI was 26.56 ± 4.77 kg/m2. The mean %BF was 34.71±7.4%, and the mean WC was 92.26 ± 11.94 cm. Furthermore, the mean TC level was 203.69 ± 38.53 mg/dL, the mean LDL-C level was 136.25 ± 35.26 mg/dL, the mean HDL-C level was 53.05 ± 11.89 mg/dL, and the mean TG level was 100.42 ± 57.46 mg/dL. Characteristics of the research subjects can be seen in Table 1. Meanwhile, Table 2 shows the proportion of weight groups based on BMI as follow: 39% for obesity 1, and 18.18% for obesity 2, with the proportion of the overall obesity group based on BMI being 57.57%. The proportion of the obesity group based on %BF was 72.7%, while the proportion of the central obesity group based on WC was 74.8%.
 Click to view | Table 1. Characteristics of Study Subjects |
Click to view | Table 2. The Proportion of Obesity Status Groups Based on Various Obesity Indices Along With Lipid Fraction Levels |
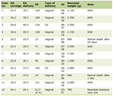
As seen in Table 3, obese subjects based on BMI were associated with HDL-C and TG levels, with significant values of P = 0.032 and P = 0.023, respectively. The OR value for the incidence of low HDL-C level was OR (95% confidence interval (CI) = 9.814 (1.213 - 79.379), whereas the OR value for the incidence of high TG level was OR (95% CI) = 4.618 (1.240 - 17.204). Meanwhile, no significant relationship with lipid fraction levels (P > 0.05) based on %BF was found in the obesity group. Central obesity subjects based on WC were associated with LDL-C levels, with a significant value of P = 0.023. The OR for the incidence of high LDL-C level was OR (95% CI) = 3.100 (1.170 - 8.218).
Click to view | Table 3. Relationship of Lipid Profile With Obese Group Based on Various Obesity Indices |
| Discussion | ▴Top |
This study found a significant relationship with HDL-C and triglyceride levels (P = 0.032; P = 0.023) in the obesity group based on BMI, with the risk of low HDL-C level of 9.8 times and the risk of high TG level of 4.6 times, compared to the non-obese group. This is in line with the results of a prior study by Kaur et al on an obese population based on an apparently healthy BMI, with the most common abnormal lipid parameters being a decrease in HDL-C levels and an increase in TG levels [6]. In addition, Qi et al reported in their study that hypertriglyceridemia and low HDL-C levels are the most common disorders in the obese population based on BMI in China [7]. Another study by Sudargo et al proved that obesity based on BMI is significantly associated with TG levels [8]. Meanwhile, Yang et al discovered in their study on a non-obese population in China that BMI has an independent relationship with HDL-C [9].
Decreased HDL-C levels and elevated triglyceride levels are abnormalities of lipid metabolism commonly found in obese people. The escalation in serum TG results from increased production of hepatic very low-density lipoprotein (VLDL) particle, and decreased clearance of triglyceride-rich lipoproteins. Such increase in production occurs due to impaired insulin signaling which improves lipolysis and conversion of TG into free fatty acids (FFA) in adipocytes, which will then be transported to the liver and muscles through the blood [10]. Furthermore, HDL-C metabolism is also strongly related to obesity due to an increase in the number of chylomicron remnants and VLDL along with impaired lipolysis. Lipolysis of triglyceride-rich HDL appears due to hepatic lipase which results in the production of sHDL with decreased Apo A-I affinity, leading to low HDL-C levels and reduced circulating HDL particles, thereby impairing cholesterol back-transport [11].
This study found that the obesity group based on body fat percentage did not have a significant relationship with lipid fraction levels (P > 0.05). This is in contrast to a previous study conducted by Kobayashi et al, which stated that obesity based on the measurement of %BF using BIA is more strongly correlated with serum lipids except HDL-C in the Japanese population [12]. Likewise, Bohn et al revealed in their study that there is a significant trend of increasing prevalence with low HDL-C levels in subjects with high body fat as measured by BIA [13]. The results of this study are in line with a prior study carried out in Indonesia by Nurbaya et al, which showed that there is no relationship between total body fat as measured by BIA and serum lipid profiles in each category of high and normal body fat [14]. This is suspected to be due to unclear clarification of the clinical significance of its use. Obesity measurement using BIA appears to be less accurate, as the BIA algorithm developed in normal weight subjects is then transferred to obese subjects without further equation validation [13]. In addition, the results of body fat measurement using BIA can be biased; there may be differences in the reference population, skin temperature, skin blood flow, or nutritional status.
In this study, the central obesity group based on WC was proven to have a significant relationship with LDL-C (P = 0.023), with the risk of the incidence of high LDL-C levels of 3.1 times, compared to the non-central obesity group. This is not in line with the result of a prior study by Chehrei et al, which stated that WC has a positive correlation with TG and a significant negative correlation with HDL-C [15]. Similarly, Brenner et al reported in their study that WC is strongly associated with TG and TC/HDL-C ratio, after adjusting for BMI and other covariates [16]. A study conducted by Hou et al also found a strong relation between WC and increased TG as well as decreased HDL-C [17]. Meanwhile, Ishizaka et al proved in a cohort study that changes in WC are positively associated with changes in LDL-C and TG, but not with HDL-C [18].
The results of this study find no relationship between central obesity based on WC and the most vital lipid metabolism disorders in obesity, namely HDL-C and TG. However, central obesity based on WC has a significant correlation with LDL-C, which is still a risk factor for atherosclerosis. The increase in LDL-C levels in the central obesity group is suspected to be associated with the production of sdLDL. The size of LDL particles is largely determined by their cholesterol content, meaning that sdLDL is a particle with low cholesterol level [19]. Nevertheless, an increase in LDL-C levels does not indicate an increase in sdLDL levels and need further investigation.
Conclusions
There is a relationship between obesity as measured by a certain measurement index, and a certain lipid fraction; obesity based on BMI is related to HDL-C and TG, while central obesity based on WC is related with LDL-C. This study proves BMI and WC measurements are better at predicting dyslipidemia than %BF. The combination of these measurements is a practical, convenient, inexpensive, and widely used, which is expected to be performed as an initial and routine screening to identify risk factors for obesity-related lipid fraction disorders.
Limitations
This study has several limitations. As a cross-sectional study, the analysis did not address a causal relationship. In addition, the research subjects involved were relatively limited, and therefore interpretation of the results may require considerable attention. This study also did not take into account other factors that can affect glucose and lipid metabolism such as diet and/or physical activity. Further studies are highly recommended to include the measurement of another characteristic component of atherogenic dyslipidemia, namely Apo B, to calculate small-density LDL.
Acknowledgments
We thank all the study members, staff, and participants related with the study.
Financial Disclosure
During this study, no financial support was received neither from any pharmaceutical company that has a direct connection with the research subject, nor from a company that provides or produces medical instruments and materials which may negatively affect the evaluation process of this study.
Conflict of Interest
No conflicts of interest between the authors and/or family members of the scientific and medical committee members or members of the potential conflicts of interest, counseling, expertise, working conditions, shareholding, and similar situations in any firm.
Informed Consent
Written informed consent was obtained.
Author Contributions
Yudin R, Aman AM, and Rasyid H were the principal investigators of the study and drafted the manuscript. Yudin R and Zainuddin AA collected and analyzed the data. Sanusi H and Daud NA contributed to the concept and design of the study. Aman AM, Rasyid H and Bakri S revisited the manuscript and critically evaluated the intellectual contents. All authors participated in the final draft preparation, manuscript revision, and critical evaluation of the intellectual contents. All authors have read and approved the content of the manuscript and confirmed the accuracy or integrity of any part of the work.
Data Availability
Any inquiries regarding supporting data availability of this study should be directed to the corresponding author.
| References | ▴Top |
- Jensen MD. Role of body fat distribution and the metabolic complications of obesity. J Clin Endocrinol Metab. 2008;93(11 Suppl 1):S57-63.
doi pubmed - Frank AP, de Souza Santos R, Palmer BF, Clegg DJ. Determinants of body fat distribution in humans may provide insight about obesity-related health risks. J Lipid Res. 2019;60(10):1710-1719.
doi pubmed - Goossens GH. The metabolic phenotype in obesity: fat mass, body fat distribution, and adipose tissue function. Obes Facts. 2017;10(3):207-215.
doi pubmed - Vekic J, Zeljkovic A, Stefanovic A, Jelic-Ivanovic Z, Spasojevic-Kalimanovska V. Obesity and dyslipidemia. Metabolism. 2019;92:71-81.
doi pubmed - Ye J. Mechanisms of insulin resistance in obesity. Front Med. 2013;7(1):14-24.
doi pubmed - Kaur H, Aeri BT. Assessing the prevalence of dyslipidemia in apparently healthy urban obese adults residing in South Delhi, India. Jurnal Gizi dan Pangan. 2020;15(2):63-70.
doi - Qi L, Ding X, Tang W, Li Q, Mao D, Wang Y. Prevalence and risk factors associated with dyslipidemia in Chongqing, China. Int J Environ Res Public Health. 2015;12(10):13455-13465.
doi pubmed - Steinberger J, Moorehead C, Katch V, Rocchini AP. Relationship between insulin resistance and abnormal lipid profile in obese adolescents. J Pediatr. 1995;126(5 Pt 1):690-695.
doi - Yang Z, Ding X, Liu J, Duan P, Si L, Wan B, Tu P. Associations between anthropometric parameters and lipid profiles in Chinese individuals with age >/=40 years and BMI <28kg/m2. PLoS One. 2017;12(6):e0178343.
doi pubmed - Feingold KR. Obesity and dyslipidemia. Endotext. Published online November 2, 2020. Accessed February 13, 2022. https://www.ncbi.nlm.nih.gov/books/NBK305895/.
- Klop B, Elte JW, Cabezas MC. Dyslipidemia in obesity: mechanisms and potential targets. Nutrients. 2013;5(4):1218-1240.
doi pubmed - Kobayashi J, Murano S, Kawamura I, Nakamura F, Murase Y, Kawashiri MA, Nohara A, et al. The relationship of percent body fat by bioelectrical impedance analysis with blood pressure, and glucose and lipid parameters. J Atheroscler Thromb. 2006;13(5):221-226.
doi pubmed - Bohn B, Muller MJ, Simic-Schleicher G, Kiess W, Siegfried W, Oelert M, Tuschy S, et al. BMI or BIA: is body mass index or body fat mass a better predictor of cardiovascular risk in overweight or obese children and adolescents? A German/Austrian/Swiss Multicenter APV analysis of 3,327 children and adolescents. Obes Facts. 2015;8(2):156-165.
doi pubmed - Nurbaya S, Azzahra F. Correlation of body mass index and bioelectrical impedance analysis of total body fat with serum lipid profile. eJKI. 2019;7(3):205-210.
doi - Chehrei A, Sadrnia S, Keshteli AH, Daneshmand MA, Rezaei J. Correlation of dyslipidemia with waist to height ratio, waist circumference, and body mass index in Iranian adults. Asia Pac J Clin Nutr. 2007;16(2):248-253.
- Brenner DR, Tepylo K, Eny KM, et al. A. Comparison of body mass index and waist circumference as predictors of cardiometabolic health in a population of young Canadian adults. Diabetology & Metabolic Syndrome. 2010;2(28):45-62.
doi pubmed - Hou X, Lu J, Weng J, Ji L, Shan Z, Liu J, Tian H, et al. Impact of waist circumference and body mass index on risk of cardiometabolic disorder and cardiovascular disease in Chinese adults: a national diabetes and metabolic disorders survey. PLoS One. 2013;8(3):e57319.
doi pubmed - Ishizaka N, Ishizaka Y, Toda E, Koike K, Nagai R, Yamakado M. Impact of changes in waist circumference and BMI over one-year period on serum lipid data in Japanese individuals. J Atheroscler Thromb. 2009;16(6):764-771.
doi pubmed - Hendarto A. Small dense LDL sebagai prediktor risiko penyakit jantung koroner pada anak lelaki obese pra-pubertal. Sari Pediatri. 2010;12(3):197-203.
doi
This article is distributed under the terms of the Creative Commons Attribution Non-Commercial 4.0 International License, which permits unrestricted non-commercial use, distribution, and reproduction in any medium, provided the original work is properly cited.
Journal of Endocrinology and Metabolism is published by Elmer Press Inc.