

| Journal of Endocrinology and Metabolism, ISSN 1923-2861 print, 1923-287X online, Open Access |
| Article copyright, the authors; Journal compilation copyright, J Endocrinol Metab and Elmer Press Inc |
| Journal website http://www.jofem.org |
Original Article
Volume 1, Number 2, June 2011, pages 64-72
Reduced Glucose Variability Is Associated With Improved Quality of Glycemic Control in Patients With Type 2 Diabetes: A 12-Month Observational Study
Klaus-Dieter Kohnerta, d, Peter Heinkea, Lutz Vogtb, Eckhard Zanderc, Gert Fritzscheb, Petra Augsteina, Eckhard Salzsiedera, b
aInstitute of Diabetes “Gerhardt Katsch” Karlsburg, Karlsburg, Germany
bDiabetes Service Center Karlsburg, Karlsburg, Germany
cClinics for Diabetes and Metabolic Diseases, Karlsburg, Germany
dCorresponding author: Klaus-Dieter Kohnert
Manuscript accepted for publication May 26, 2011
Short title: Glucose Variability and Glycemic Control in Type 2 Diabetes
doi: https://doi.org/10.4021/jem21w
| Abstract | ▴Top |
Background: Current diabetes management relies mainly on hemoglobin A1C measurement to assess quality of treatment and to adjust therapy. We assessed the long-term effectivity of therapeutic adjustments in type 2 diabetes with specific focus on indices of glucose variability and multiple criteria for quality of glycemic control.
Methods: Continuous glucose monitoring data collected during an observational study involving 405 outpatients with type 2 diabetes were analyzed at baseline and after 12 months. We evaluated the following criteria for glucose variability and quality of glycemic control: mean amplitude of glycemic excursions (MAGE), SD around the mean sensor glucose, mean of daily differences (MODD), fasting and mean sensor glucose, time outside specified glucose ranges, the Glycemic Risk Assessment Diabetes Equation (GRADE) score, High Blood Glucose Index (HBGI), and Low Blood Glucose Index (LBGI). Patients were classified according to quartiles of MAGE.
Results: Indices of glucose variability were reduced by 15 to 23% (P < 0.001 for all) during 12 months in the upper MAGE quartile (≥ 5.7 mmol/l). These reductions were associated with improvements in measures of glycemic control (P < 0.05), except for fasting sensor glucose (P = 0.23). Both time spent at < 3.9 mmol/l and at > 8.9 mmol/l decreased by 57% and 36% (P < 0.001 for both), respectively. MAGE and MODD correlated strongly with indices of glycemic control but weakly with A1C. The stepwise multiple regression analysis demonstrated that the mean amplitude of glycemic excursions and mean sensor glucose were the main determinants of time spent at < 3.9 mmol/l and at > 8.9 mmol/l (R2 = 0.374 and 0.877, P < 0.001 for both).
Conclusions: Reduction of elevated glucose variability in type 2 diabetic outpatients is associated with lower risk of hypo- and hyperglycemia, and lower A1C values.
Keywords: Type 2 diabetes mellitus; Indices of glucose variability; Quality measures of glycemic control; Continuous glucose monitoring; Observational study
| Introduction | ▴Top |
Since evidence from large clinical trials has linked A1C to vascular complications of diabetes [1, 2] current glycemic management relies mainly on A1C measurements.Main determinants of A1C in patients with type 2 diabetes are both fasting hyperglycemia and postprandial glucose excursions but their relative contribution to the overall diurnal hyperglycemia varies with the quality of diabetes control [3]. Increased cardiovascular risk in type 2 diabetes is only partly explained by traditional cardiovascular risk factors. Chronic sustained hyperglycemia increases the risk, and postprandial hyperglycemia has been associated with cardiovascular risk independent of A1C or fasting glycemia [4, 5], even if a recent study has failed to show any difference in postprandial vs. basal glycemia strategy for future cardiovascular events [6]. However, neither of these studies addressed the role of glucose variability, but instead considered the importance of chronic sustained hyperglycemia.
In the majority of studies so far performed in patients with type 1 diabetes, short-term glucose fluctuations have been found to have little impact on the development of diabetic vascular disease [7]. However, there are some indications from type 2 diabetes studies that increased glucose variability could be an A1C-independent predictor for diabetes complications and mortality [8]. For example, increased glucose variability obviously accelerates atherogenesis [9, 10] and appears to be one of the risk factors for microalbuminuria [11] and impaired cognitive performance [12]. Even though the pathophysiological role is still unclear [13], there is evidence that acute glucose fluctuations are a powerful predictor of future hypoglycemia [14]. Minimizing the frequency and magnitude of glycemic excursions helps diminish both hypo- and hyperglycemia and is pivotal in improving diabetes treatment. Continuous glucose monitoring (CGM) patterns have proven useful in evaluating acute glycemic control by detecting episodes of hypo- and hyperglycemia [15], but their interpretation might be difficult in routine clinical practice. Several measures have thus been proposed by Rodbard et al. [16] to quantify glucose variability and quality of glycemic control. Although a short-term study on a heterogeneous cohort of patients with insulin-requiring diabetes has previously shown that improvement in several indices of glycemic control was related to improved glycemic variability [17], evaluation of such indices, especially over longer time periods for type 2 diabetic patients treated with insulin and/or oral hypoglycemic agents, is lacking.
The present study was therefore undertaken firstly to evaluate the relationships between several indices of glucose variability and measures of glycemic control, and secondly to examine the still unsolved question whether in the day-to-day management of type 2 diabetes, reduction of glucose variability is associated with improvements in quality measures of treatment and in the overall glycemic status. For these purposes, we retrospectively analyzed data obtained from an observational study on a representative cohort of patients with type 2 diabetes who had been cared for by primary-care physicians and/or diabetes specialists.
| Materials and Methods | ▴Top |
This retrospective observational study evaluated outpatients with type 2 diabetes drawn from the Diabetiva Program, an integrated diabetes care network of general practitioners, diabetes specialists, health care providers, and the health insurer BKK Gesundheit [18]. The patients had been referred from 228 primary care practices distributed throughout Germany from July 2006 to August 2010 and were entered without any selection based on A1C levels. Eligibility was based on known duration of type 2 diabetes for ≥ 6 months, the willingness and ability to measure blood glucose frequently and to undergo CGM measurements. Exclusion criteria were type 1 or secondary diabetes mellitus, untreated retinopathy, end-stage renal disease, blindness, amputation, insulin allergy, hepatic disease, drug abuse, infectious or life threatening diseases, pregnancy or lactation and intention to become pregnant. At the beginning of the study, the attending physicians assessed the status of glycemic control by reviewing the baseline CGM profiles, including dosing of oral hypoglycemic agents (OHAs), insulin, and carbohydrate consumption. Physicians could use the Karlsburg Diabetes Management System (KADIS®) decision support [19] for assistance in the adjustment of antihyperglycemic therapy according to the guidelines of the German Diabetes Association [20] and the consensus algorithm for the medical management of type 2 diabetes [21]. The patients had been seen by their physicians at least quarterly for glycemic control and measurements of A1C. All study participants had provided witnessed, written informed consent before participation.
Patient characteristics
Of the 448 patients with type 2 diabetes, fulfilling the enrollment criteria, 405 patients had complete data on glycemic control, including data from two 3-day CGM measurement periods 12 months apart, and were retrospectively evaluated in the present observational study. The 405 enrolled patients were Caucasians, and 278 (68.6%) were men. Patients were 65.9 + 8.7 (mean + SD) years old, with a known disease duration of 12.0 + 8.9 years, and their carbohydrate intake was 11.9 + 3.2 BU (bread exchange units)/day; BMI was 30.9 + 5.3. Antihyperglycemic treatment consisted of diet alone in 42 (10.3%) and OHAs in 131 (32.3%), either sulfonylurea, metformin or pioglitazone alone or combinations thereof; 105 (25.9%) received insulin in combination with OHAs and 147 (36.3%) insulin alone.
Study procedures
At baseline and after 12 months, a CGM sensor (Medtronic MiniMed, Northridge, CA) was inserted under ambulatory conditions, calibrated according to the standard Medtronic MiniMed operating guidelines, and CGM was performed for 68.4 ± 6.1 h (mean ± SD) and 68.9 ± 5.5 h, respectively. Patients used their home blood glucose monitors, entered at least 4 blood glucose meter readings per day into the CGM monitor for calibration, recorded logbook entries of particular event (intake of hypoglycemics, insulin doses injected, food intake, physical exercise, hypoglycemia symptoms, and other matters potentially affecting glucose control). Patients and the health care team were blinded to the glucose results until download after the testing period.
CGM data were downloaded using MiniMed Solution Software (Medtronic MiniMed). CGM profiles with less than 4 blood glucose meter entries or incomplete monitoring periods were discarded.
Measures of glucose variability
Using the CGM datasets, the following measures of within-day glucose variability were calculated: the mean amplitude of glycemic excursions (MAGE) [22] and the overall SD around the sensor glucose [16]; the latter was calculated for each day and then averaged over the 3-day CGM period. The mean of daily differences (MODD) was used as a measure of between-day glycemic variability and calculated as the mean of the absolute difference of glucose values from two consecutive days [23].
Measures of quality of glycemic control
These measures included fasting sensor glucose (FSG) and mean sensor glucose (Mean SG), time spent at > 8.9 mmol/l, time spent at < 3.9 mmol/l, the Low Blood Glucose Index (LBGI) and High Blood Glucose Index (HBGI) [24], and the Glycemic Risk Assessment Diabetes Equation (GRADE) score [25]. All parameters were calculated for each day and then averaged over the 3-day CGM period. A1C was analyzed in certified clinical laboratories using ion-exchange high-performance liquid chromatography (normal range 4.6 - 6.0%).
Statistical analysis
Data are presented as means + SD or medians (25th - 75th percentile) unless otherwise specified. Between-quartile comparisons among baseline characteristics were performed using ANOVA and Kruskal-Wallis test or the χ2 test for differences in percentages. The paired t test or Wilcoxon signed-rank test, where appropriate, were used for testing the changes from baseline in measures of glycemic variability and glycemic control. The relationships between the mean amplitude of glycemic excursions and the Glycemic Risk Assessment Diabetes Equation score, A1C, and other quality measures of glycemic control were evaluated using Pearson’s correlation analysis. We used stepwise multiple regression analysis to explore the influence of the mean amplitude of glycemic excursions, mean sensor glucose, and other factors on times spent in hyper- and hypoglycemia. To exclude strong relationships between independent variables in the regression models, collinearity statistics were performed. All statistical analyses were performed using the Statistical Package for the Social Sciences, version 17.0 (SPSS, Chicago, IL). Fasting and mean sensor glucose were measured with CGM software. P < 0.05 was considered significant.
| Results | ▴Top |
Analyses by baseline mean amplitude of glycemic excursions
Patients were classified by quartiles of baseline values of the mean amplitude of glycemic excursions as follows: < 3.0, 3.0 - < 4.3, 4.3 - < 5.7, and ≥ 5.7 mmol/l. The gender distribution between the quartiles was not different (P = 0.13), known diabetes duration was longer (P < 0.001), and A1C values were significantly higher in the top quartile compared with the lower quartiles (P < 0.001). Carbohydrate intake and characteristics, such as age and BMI, did not significantly vary between the quartiles. Antihyperglycemic therapy was different (P < 0.001) as well as the proportion of patients receiving antihypertensive treatment (P = 0.004). Figure 1illustrates the proportions of the various classes of antihyperglycemic medication at baseline (Fig. 1A) and at 12 months (Fig. 1B). It can be seen, that the proportion of patients receiving insulin either alone or as add-on to OHA therapy was highest in the 4th quartile and had increased from 75% up to 83%. The proportion of patients treated with OHAs decreased from quartile 1 to 4 but did not markedly change during the study.
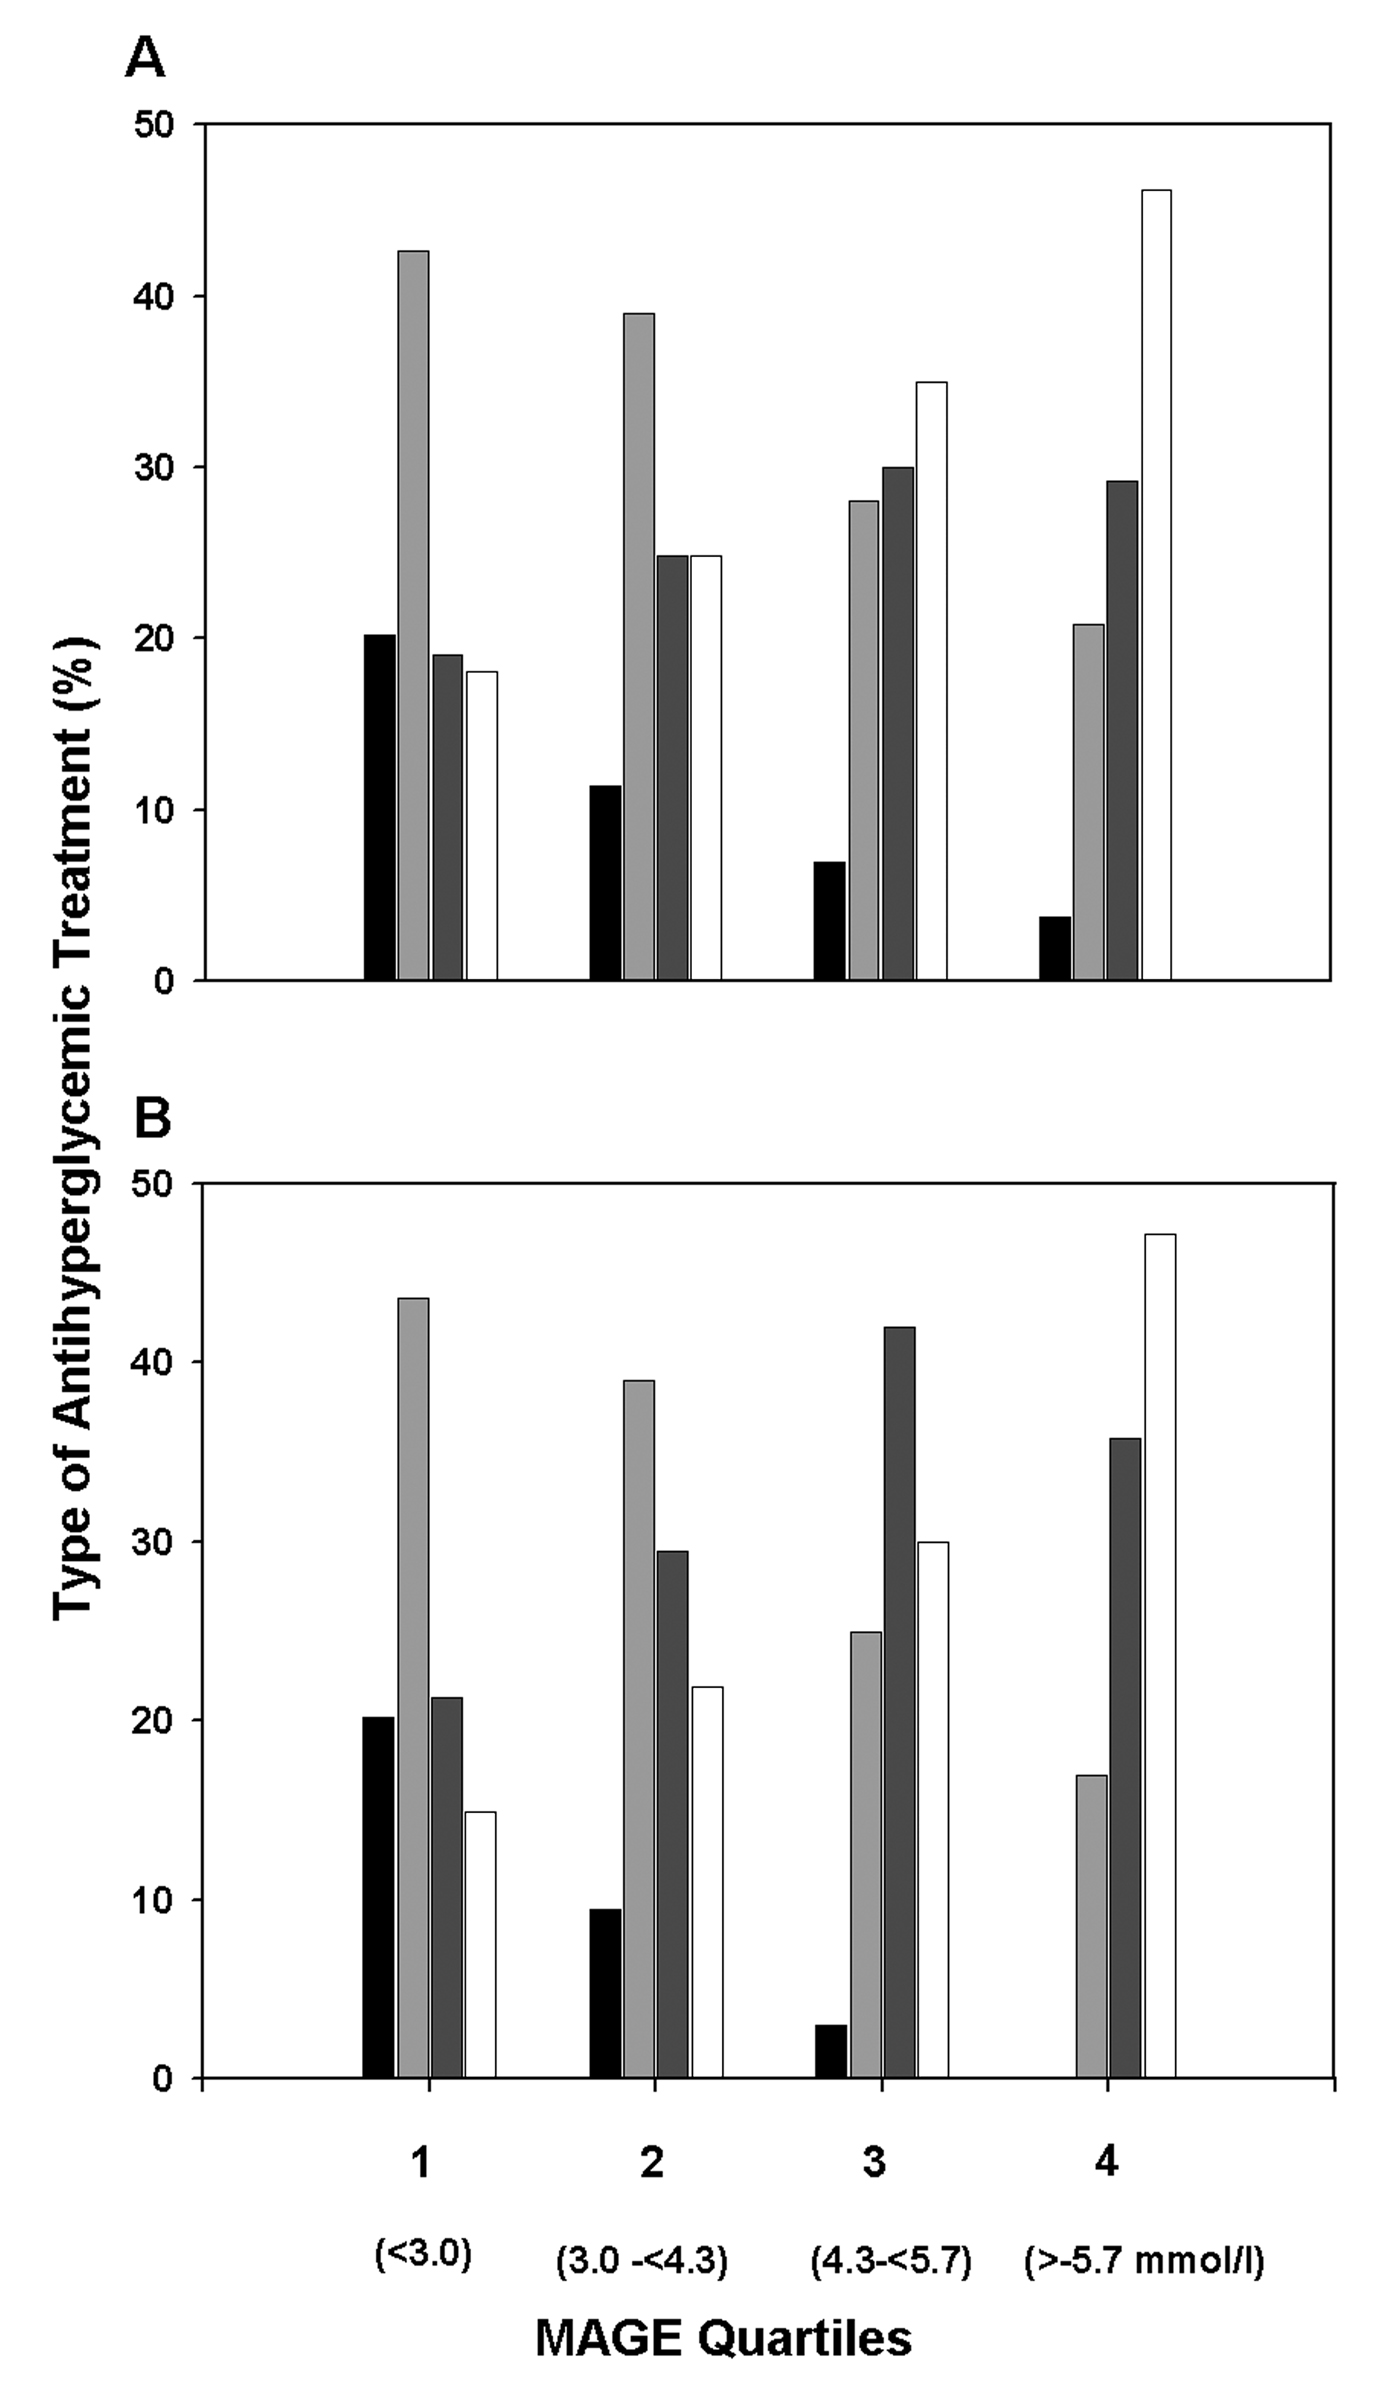 Click for large image | Figure 1. Proportions of various classes of antihyperglycemic medication used for glycemic control in outpatients with type 2 diabetes by quartiles of the baseline mean amplitude of glycemic excursions (MAGE). (A) Treatment at baseline. (B) Treatment at 12 month. Indication of treatments: diet (black solid columns), OHA (light grey columns), OHA + insulin (dark grey columns), and insulin alone (white columns). Number of patients in quartiles 1 to 4: n = 94, 105, 100, and 106, respectively. |
Glucose variability and quality of glycemic control
To evaluate changes in glycemic control, we computed 3 relevant measures of glucose variability and 9 measures of quality of glycemic control from the CGM datasets. Table 1 shows the corresponding baseline values for the quartiles of the mean amplitude of glycemic excursions.
 Click to view | Table 1. Baseline Measures of Glucose Variability and Glycemic Control Categorized by Quartiles of the Mean Amplitude of Glycemic Excursions (MAGE) |
The changes that occurred from baseline during the 12-month observation period are summarized in Table 2. Significant reductions in glucose variability were observed in the 4th quartile.
Click to view | Table 2. Changes From Baseline in Measures of Glucose Variability and Glycemic Control by Quartiles of the Mean Amplitude of Glycemic Excursions (MAGE) |
The percentage reductions achieved in the mean amplitude of glycemic excursions, SD around the mean sensor glucose, and the mean of daily differences were -23%,-22%, and -15%, respectively. In contrast, the two lower quartiles showed even moderate increases, which were statistically significant in the 1st quartile for all indices of glucose variability, but in the 2nd quartile only for the mean amplitude of glycemic excursions. The small reductions observed in the 3rd quartile were not statistically significant. Table 2 also shows that 8 of the 9 criteria of quality of glycemic control, including A1C, were significantly improved in the top quartile of the mean amplitude of glycemic excursions. Compared with the baseline values, the time spent at glucose levels < 3.9 mmol/l was reduced by a median value of 5.1 min/day (-57%) and time spent at > 8.9 mmol/l by 1.4 h/day (-36%). Correspondingly, the time spent within the glucose target range 3.9 - 8.9 mmol/l was increased by 2.2 h/day (14%) during the 12-month observation period. The achieved reductions in the Glycemic Risk Assessment Diabetes Equation score, Low Blood Glucose Index (LBGI) and High Blood Glucose Index (HBGL) were 15%, 25%, and 24%, respectively. Except for A1C, which was significantly reduced in the 1st quartile, all quality measures worsened or remained largely unchanged in the quartiles 1 to 3. With regard to the entire study cohort, A1C levels at baseline, 6 month, and 12 month were 7.04 ± 0.98%, 6.87 ± 0.78%, and 6.89 ± 0.83%, respectively, indicating a trend for improvement (P = 0.049) of the overall glycemic status.
Relationships among the mean amplitude of glycemic excursions, measures of quality of glycemic control, and changes from baseline
Using linear regression analysis, we identified a number of significant relationships between baseline measures of glucose variability and baseline measures of short- and long-term quality of glycemic control. The relationships among the mean amplitude of glycemic excursions (MAGE), the Glycemic Risk Assessment Diabetes Equation (GRADE) score, A1C, and their changes from baseline (Δ) are demonstrated in Table 3.
Click to view | Table 3. Correlation Matrix for the Mean Amplitude of Glycemic Excursions (MAGE) and Measures of Glycemic Control: GRADE Score and A1C |
The mean amplitude of glycemic excursions correlated well with the Glycemic Risk Assessment Diabetes Equation score (r = 0.530) and weakly with A1C (r = 0.328). Changes in the mean amplitude of glycemic excursions between baseline and at 12 months (ΔMAGEBL-EP) did not correlate with A1C (r = -0.076), were negatively correlated with the Glycemic Risk Assessment Diabetes Equation score (r = -0.167), and weakly positive with ΔGRADEBL-EP and ΔA1CBL-EP (r = 0.371 and r = 0.103, respectively). Hyperglycemia, measured as time spent at > 8.9 mmol/l and the High Blood Glucose Index (HBGI), correlated moderately with the mean amplitude of glycemic excursions (r = 0.483 and 0.465, P < 0.001 for both) and strongly with the Glycemic Risk Assessment Diabetes Equation score (r = 0.929 and 0.964, P < 0.001 for both). Measures of hypoglycemia, such as time spent at < 3.3 mmol/l and the Low Blood Glucose Index (LBGI) correlated weakly with the mean amplitude of glycemic excursions and the mean of daily differences (P < 0.001) but not with the Glycemic Risk Assessment Diabetes Equation score (P > 0.05) (data not shown). When the relationship between the mean amplitude of glycemic excursions and mean sensor glucose levels achieved at 12 month was analyzed, the correlation coefficient was as low as 0.452, and a rather wide range of glucose variability values at the same mean sensor glucose levels could be observed (Fig. 2).
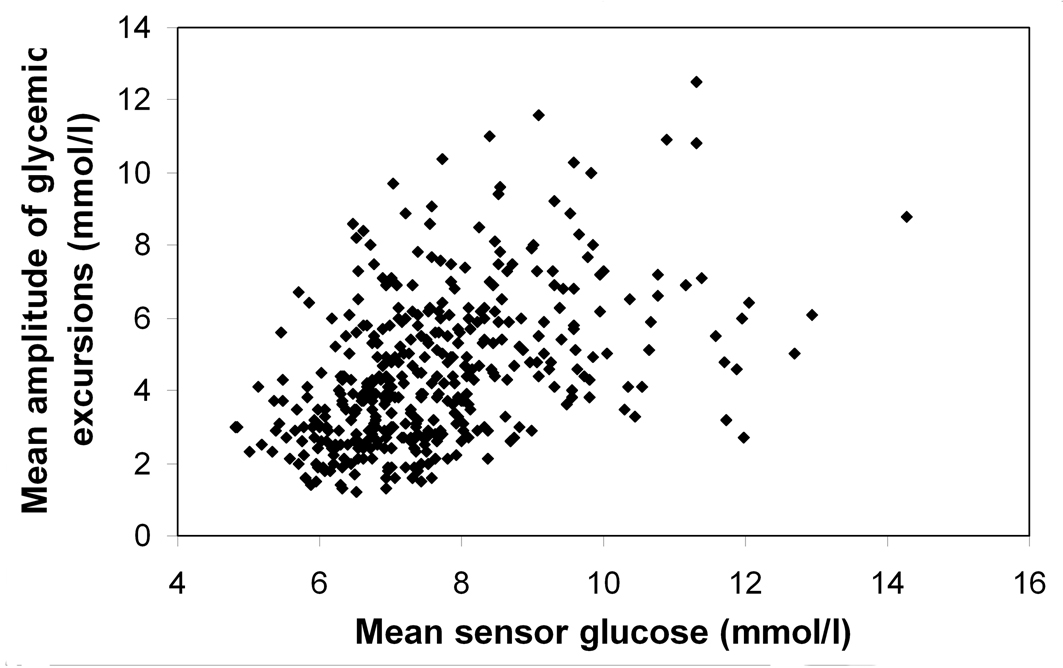 Click for large image | Figure 2. Relationship between the mean amplitude of glycemic excursions and mean sensor glucose levels at the endpoint of the 12-month observation period (r = 0.452, P < 0.001), showing different values for glucose variability at the same mean sensor glucose concentration. |
Multivariate regression analysis with hypo- and hyperglycemia as the dependent variables
The results of the stepwise forward regression analyses provided in Table 4 show that mean sensor glucose and the mean amplitude of glycemic excursions were the main predictors of the dependent variables time spent at < 3.9 mmol/l and time spent at > 8.9 mmol/l, explaining 37.4% and 87.7%, respectively, of the variance in these measures of glycemia.
Click to view | Table 4. Results of Stepwise Forward Multiple Regression Analysis |
The independent variables such as A1C, BMI, diabetes duration, antidiabetic or antihypertensive therapy, carbohydrate consumption (bread exchange units), age, gender, and the physicians’ speciality (diabetes specialist/general practitioner) failed to enter these regression models.
| Discussion | ▴Top |
In this study, we used several criteria recently proposed [16] to evaluate glucose variability and quality of glycemic control in a cohort of outpatients with type 2 diabetes, receiving various antihyperglycemic treatments. The important finding of our study is that a distinct reduction of glucose variability was closely associated with consistent improvements of characteristic measures of glycemic control in a segment of patients with increased glycemic excursions. This observation is in keeping with findings of a short-term study, which included a heterogeneous group of patients (80.2% had type 1 diabetes and 19.8% type 2 diabetes) on intensified insulin therapy, using real-time CGM [17, 26]. As the results of our retrospective analysis clearly demonstrate, improvements in indices of glucose variability and quality of glycemic control achieved in those patients with elevated glucose excursions and less-well controlled glycemia (mean baseline A1C 7.5%) were accompanied by a respectively small 4.3% and 6.7% relative decrease in A1C and mean glucose levels, while fasting glucose was not significantly changed. By contrast, the percentage reduction found for the glucose variability was roughly 3 - 4 fold greater. In agreement with results from the ADAG Study [27], the mean amplitude of glycemic excursions was moderately or weakly correlated with measures of general glycemia such as mean sensor glucose and A1C, indicating that patients at the same mean glucose or A1C level, even if in the target range, can have greatly different values of glucose variability.
Reduced glucose variability was further associated with decreased time spent at < 3.9 mmol/l and at > 8.9 mmol/l. Indeed, patients in the top quartile of the mean amplitude of glycemic excursions experienced as much as 2.2 h/day net increase in time spent within the 3.9 - 8.9 mmol/l glycemic target range. This suggests that minimizing glucose variability allows tighter long-term glycemic control, i.e., lowering of A1C, without increasing the risk of hypo- and hyperglycemia. We found that the mean amplitude of glycemic excursions (MAGE) was a significant predictor of both hypo- and hyperglycemia, whereas A1C and other factors such as diabetes duration, carbohydrate intake, and antihyperglycemic therapy failed to enter the multivariate regression models. As we have previously shown, the failing postprandial ß-cell dysfunction is one of the most important factors responsible for increased glucose variability [28]. It was the purpose of this study to evaluate associations of glucose variability with various quality indices of glycemic control rather than to assess the influence of factors such as the glycemic index of consumed food, specific dose escalation or medication compliance.
Weaknesses of the current study are its observational nature and the absence of repeated CGMs in-between. However, it was our purpose to assess the outcomes 12 months after therapeutic adjustments, as in daily clinical practice, outpatients with type 2 diabetes can hardly be encouraged to run CGM in shorter intervals as long as they see their A1C values staying around the target range or even improve. Since A1C levels were decreasing over the entire study cohort during the observation period, there was a clear trend for overall glycemic improvement. This substantiates our conclusions that glucose variability is associated with short- and long-term measures of glycemic control. The strengths of the study include evaluation of glycemic control in a representative cohort of patients with type 2 diabetes from a great number of centers and cared for by primary care physicians in day-to-day management of diabetes. Furthermore, CGM measurements were performed blinded which inspired patients to evaluate their glucose profiles after download together with the attending physicians and to help gain more insight into diabetes control.
In summary, we evaluated retrospectively an observational study that used CGM to adjust antihyperglycemic therapy and assess the effectiveness of long-term diabetes control. Our data suggest that indices of glucose variability and of quality of glycemic control, provided through the use of CGM, enable the attending physician to achieve individual glycemic targets without increasing the risk of hypo- and hyperglycemia. Treatment decisions made using the indices evaluated in the present study could be more successful in improving glycemia than those based only on quarterly A1C testing. Especially in those patients with increased glucose excursions, minimizing glucose variability may help achieve better glycemic control and prevent long-term diabetes complications.
Conflict of Interest
No potential conflicts of interest relevant to this article were reported.
| References | ▴Top |
- The effect of intensive treatment of diabetes on the development and progression of long-term complications in insulin-dependent diabetes mellitus. The Diabetes Control and Complications Trial Research Group. N Engl J Med 1993;329(14):977-986.
pubmed doi - Intensive blood-glucose control with sulphonylureas or insulin compared with conventional treatment and risk of complications in patients with type 2 diabetes (UKPDS 33). UK Prospective Diabetes Study (UKPDS) Group. Lancet 1998;352(9131):837-853.
pubmed doi - Monnier L, Lapinski H, Colette C. Contributions of fasting and postprandial plasma glucose increments to the overall diurnal hyperglycemia of type 2 diabetic patients: variations with increasing levels of HbA1c. Diabetes Care 2003;26(3):881-885.
pubmed doi - Glucose tolerance and cardiovascular mortality: comparison of fasting and 2-hour diagnostic criteria. Arch Intern Med 2001;161(3):397-405.
pubmed doi - Meigs JB, Nathan DM, D'Agostino RB, Sr., Wilson PW. Fasting and postchallenge glycemia and cardiovascular disease risk: the Framingham Offspring Study. Diabetes Care 2002;25(10):1845-1850.
pubmed doi - Raz I, Wilson PW, Strojek K, Kowalska I, Bozikov V, Gitt AK, Jermendy G, et al. Effects of prandial versus fasting glycemia on cardiovascular outcomes in type 2 diabetes: the HEART2D trial. Diabetes Care 2009;32(3):381-386.
pubmed doi - Kilpatrick ES, Rigby AS, Atkin SL. A1C variability and the risk of microvascular complications in type 1 diabetes: data from the Diabetes Control and Complications Trial. Diabetes Care 2008;31(11):2198-2202.
pubmed doi - Nalysnyk L, Hernandez-Medina M, Krishnarajah G. Glycaemic variability and complications in patients with diabetes mellitus: evidence from a systematic review of the literature. Diabetes Obes Metab 2010;12(4):288-298.
pubmed doi - Temelkova-Kurktschiev TS, Koehler C, Henkel E, Leonhardt W, Fuecker K, Hanefeld M. Postchallenge plasma glucose and glycemic spikes are more strongly associated with atherosclerosis than fasting glucose or HbA1c level. Diabetes Care 2000;23(12):1830-1834.
pubmed doi - Chen XM, Zhang Y, Shen XP, Huang Q, Ma H, Huang YL, Zhang WQ, et al. Correlation between glucose fluctuations and carotid intima-media thickness in type 2 diabetes. Diabetes Res Clin Pract 2010;90(1):95-99.
pubmed doi - Zhou J, Jia WP, Ma XJ, Bao YQ, Lu W, Li M, Li Q, et al. [Relationship between blood glucose variability and microalbuminuria in type 2 diabetic patients with well-controlled glycosylated hemoglobin]. Zhonghua Yi Xue Za Zhi 2008;88(42):2977-2981.
pubmed - Rizzo MR, Marfella R, Barbieri M, Boccardi V, Vestini F, Lettieri B, Canonico S, et al. Relationships between daily acute glucose fluctuations and cognitive performance among aged type 2 diabetic patients. Diabetes Care 2010;33(10):2169-2174.
pubmed doi - Kilpatrick ES. Arguments for and against the role of glucose variability in the development of diabetes complications. J Diabetes Sci Technol 2009;3(4):649-655.
pubmed - Cox DJ, Gonder-Frederick L, Ritterband L, Clarke W, Kovatchev BP. Prediction of severe hypoglycemia. Diabetes Care 2007;30(6):1370-1373.
pubmed doi - Buckingham B. Clinical overview of continuous glucose monitoring. J Diabetes Sci Technol 2008;2(2):300-306.
pubmed - Rodbard D. New and improved methods to characterize glycemic variability using continuous glucose monitoring. Diabetes Technol Ther 2009;11(9):551-565.
pubmed doi - Rodbard D, Bailey T, Jovanovic L, Zisser H, Kaplan R, Garg SK. Improved quality of glycemic control and reduced glycemic variability with use of continuous glucose monitoring. Diabetes Technol Ther 2009;11(11):717-723.
pubmed doi - Augstein P, Vogt L, Kohnert KD, Heinke P, Salzsieder E. Translation of personalized decision support into routine diabetes care. J Diabetes Sci Technol 2010;4(6):1532-1539.
pubmed - Salzsieder E, Augstein P. The Karlsburg Diabetes Management System: translation from research to eHealth application. J Diabetes Sci Technol 2011;5(1):13-22.
pubmed - Matthaei S, Bierwirth R, Fritsche A, Gallwitz B, Haring HU, Joost HG, Kellerer M, et al. Medical antihyperglycaemic treatment of type 2 diabetes mellitus: update of the evidence-based guideline of the German Diabetes Association. Exp Clin Endocrinol Diabetes 2009;117(9):522-557.
pubmed doi - Nathan DM, Buse JB, Davidson MB, Ferrannini E, Holman RR, Sherwin R, Zinman B. Medical management of hyperglycemia in type 2 diabetes: a consensus algorithm for the initiation and adjustment of therapy: a consensus statement of the American Diabetes Association and the European Association for the Study of Diabetes. Diabetes Care 2009;32(1):193-203.
pubmed doi - Service FJ, Molnar GD, Rosevear JW, Ackerman E, Gatewood LC, Taylor WF. Mean amplitude of glycemic excursions, a measure of diabetic instability. Diabetes 1970;19(9):644-655.
pubmed - Service FJ, Nelson RL. Characteristics of glycemic stability. Diabetes Care 1980;3(1):58-62.
pubmed doi - Kovatchev BP, Otto E, Cox D, Gonder-Frederick L, Clarke W. Evaluation of a new measure of blood glucose variability in diabetes. Diabetes Care 2006;29(11):2433-2438.
pubmed doi - Hill NR, Hindmarsh PC, Stevens RJ, Stratton IM, Levy JC, Matthews DR. A method for assessing quality of control from glucose profiles. Diabet Med 2007;24(7):753-758.
pubmed doi - Garg S, Jovanovic L. Relationship of fasting and hourly blood glucose levels to HbA1c values: safety, accuracy, and improvements in glucose profiles obtained using a 7-day continuous glucose sensor. Diabetes Care 2006;29(12):2644-2649.
pubmed doi - Borg R, Kuenen JC, Carstensen B, Zheng H, Nathan DM, Heine RJ, Nerup J, et al. Associations between features of glucose exposure and A1C: the A1C-Derived Average Glucose (ADAG) study. Diabetes 2010;59(7):1585-1590.
pubmed doi - Kohnert KD, Augstein P, Zander E, Heinke P, Peterson K, Freyse EJ, Hovorka R, et al. Glycemic variability correlates strongly with postprandial beta-cell dysfunction in a segment of type 2 diabetic patients using oral hypoglycemic agents. Diabetes Care 2009;32(6):1058-1062.
pubmed doi
This is an open-access article distributed under the terms of the Creative Commons Attribution License, which permits unrestricted use, distribution, and reproduction in any medium, provided the original work is properly cited.
Journal of Endocrinology and Metabolism is published by Elmer Press Inc.