

| Journal of Endocrinology and Metabolism, ISSN 1923-2861 print, 1923-287X online, Open Access |
| Article copyright, the authors; Journal compilation copyright, J Endocrinol Metab and Elmer Press Inc |
| Journal website http://www.jofem.org |
Original Article
Volume 5, Number 3, June 2015, pages 199-210
Global Gene Expression Profiling in Omental Adipose Tissue of Morbidly Obese Diabetic African Americans
Ayo P. Doumateya, e, Huichun Xua, d, Hanxia Huanga, Niraj S. Trivedib, Lin Leia, Abdel Elkahlounc, Adebowale Adeyemoa, Charles N. Rotimia, e
aCenter for Research on Genomics and Global Health, National Human Genome Research Institute, National Institutes of Health, Bethesda, MD, USA
bComputational and Statistical Genomics Branch, National Human Genome Research Institute, National Institutes of Health, Bethesda, MD, USA
cCore Laboratory-Cancer Genetics, National Human Genome Research Institute, National Institutes of Health, Bethesda, MD, USA
dUniversity of Maryland, School of Medicine, Baltimore, MD, USA
eCorresponding Author: Ayo P. Doumatey, Center for Research on Genomics and Global Health, NHGRI/NIH, 12 South Dr. Bldg12A-4047 Bethesda, MD 20852, USA; Charles Rotimi, Center for Research on Genomics and Global Health, NHGRI/NIH, 12 South Dr. Bldg12A-4047 Bethesda, MD 20852, USA
Manuscript accepted for publication June 24, 2015
Short title: Transcriptome of Omental Adipose Tissue
doi: http://dx.doi.org/10.14740/jem286w
| Abstract | ▴Top |
Background: Adipose tissues play an important role in the pathophysiology of obesity-related diseases including type 2 diabetes (T2D). To describe gene expression patterns and functional pathways in obesity-related T2D, we performed global transcript profiling of omental adipose tissue (OAT) in morbidly obese individuals with or without T2D.
Methods: Twenty morbidly obese (mean BMI: about 54 kg/m2) subjects were studied, including 14 morbidly obese individuals with T2D (cases) and six morbidly obese individuals without T2D (reference group). Gene expression profiling was performed using the Affymetrix U133 Plus 2.0 human genome expression array. Analysis of covariance was performed to identify differentially expressed genes (DEGs). Bioinformatics tools including PANTHER and Ingenuity Pathway Analysis (IPA) were applied to the DEGs to determine biological functions, networks and canonical pathways that were overrepresented in these individuals.
Results: At an absolute fold change threshold of 2 and false discovery rate (FDR) of < 0.05, 68 DEGs were identified in cases compared to the reference group. Myosin X (MYO10) and transforming growth factor beta regulator 1 (TBRG1) were upregulated. MYO10 encodes for an actin-based motor protein that has been associated with T2D. Telomere extension by telomerase (HNRNPA1, TNKS2), D-myo-inositol (1,4,5)-trisphosphate biosynthesis (PIP5K1A, PIP4K2A), and regulation of actin-based motility by Rho (ARPC3) were the most significant canonical pathways and overlay with T2D signaling pathway. Upstream regulator analysis predicted five miRNAs (miR-320b, miR-381-3p, miR-3679-3p, miR-494-3p, and miR-141-3p), as regulators of the expression changes identified.
Conclusion: This study identified a number of transcripts and miRNAs in OAT as candidate novel players in the pathophysiology of T2D in African Americans.
Keywords: Obesity; Global gene expression; Type 2 diabetes; African Americans
| Introduction | ▴Top |
The prevalence of type 2 diabetes (T2D) has risen concomitantly with that of obesity in virtually every country in the world [1, 2]. The International Obesity Task Force estimates that up to 1.7 billion people of the world’s population are at a heightened risk of weight-related, non-communicable diseases such as T2D. The International Diabetes Federation predicts that the number of people with diabetes will rise from 194 million today to more than 333 million by 2025. In the US, about 35.7% of adults are obese and more than 11% of adults aged 20 years and older have diabetes, a prevalence expected to increase to approximately 21% by 2050 [3-5]. Ethnic minority groups, including African Americans, have a higher prevalence of obesity and are therefore at higher risk of developing obesity-related co-morbidities than other ethnic groups [6-8]. The molecular mechanisms that underline the development of T2D in obesity are still not well understood [9]. A number of studies have investigated these mechanisms in animal models or in tissues and organs that are directly involved in insulin metabolism such as pancreas, liver, and smooth muscle [9-16].
White adipose tissue (WAT) [17] is now well recognized as an important endocrine organ that produces large number of bio-molecules involved in glucose and lipids metabolism and inflammation [18]. These observations have led to intense investigation of the role of WAT in the pathophysiology of T2D. Gene expression arrays have been used to investigate the expression patterns of visceral adipose tissue (VAT) from morbidly obese and lean individuals [19, 20]. Also, the expression profiles of VAT and subcutaneous adipose tissue (SAT) in non-diabetic obese men have been investigated [21]. Other studies have conducted gene expression profiling in obese individuals with insulin resistance, a physiological state often occurring before the development of T2D [22]. A number of pathways and candidate genes have been reported to be associated with obesity including those related to glucose and lipids metabolism, membrane transport, cell cycle promotion and immunity-complements C2, C3, C4 [9]. While these studies have contributed to our knowledge of the pathophysiology of obesity or obesity-related insulin resistance, identifying putative pathways that are more directly involved in obesity-related T2D remains crucially important. For example, it is well documented that insulin secretion and action are impaired in T2D but the exact mechanisms underlying this observation are not well understood especially in insulin-targeted tissue such as adipose tissues (ATs) [23-25]. In vitro experiments show that insulin receptor substract-1 (IRS1), phosphatidylinositol 3-kinase (PI3-kinase) and small Rho family such as TC10 and cell division cycle 42 (cdc42) pathways are involved in insulin-induced glucose transport. However, these findings were observed in non-diseased state. In the present study, we utilize a global expression profiling approach to provide insight into gene expression patterns and pathways that may be affected in persons with T2D in the context of obesity.
| Materials and Methods | ▴Top |
Subjects
A total of 20 morbidly obese African Americans (BMI ≥ 40 kg/m2) were included in this study. Clinical and demographic data as well as OAT samples were obtained from Zen-Bio, Inc. (Research Triangle, NC). The participants in this study were undergoing elective surgical procedures and agreed to donate their de-identified discarded tissues for research. All participants underwent pre-operative clinical assessments by their physicians and diabetes status was determined at the time by the treating physicians using standard procedures. The characteristics of the 20 obese subjects (14 morbidly obese diabetics - “cases” and six morbidly obese non-diabetics - “reference”) are summarized in Table 1. One sample was determined as a microarray hybridization outlier after quality control (QC) and was excluded from subsequent analyses.
 Click to view | Table 1. Characteristics of the Study Participants |
RNA extraction and quantification
Total RNA was extracted from OAT using EZ1 RNA universal kit and the EZ1 workstation (Qiagen Inc., Valencia, CA). Briefly 100 mg of frozen OAT was disrupted and homogenized in 750 µL of QIAzol lysis reagent using a tissuelyser (Qiagen Inc., Valencia, CA). Then 150 µL of chloroform was added to the homogenate and centrifuged. After centrifugation, the sample separates into three phases. The upper aqueous phase containing the RNA was transferred to a new tube and processed with EZ1 RNA universal tissue kit on the EZ1 workstation following the manufacturer’s instructions. RNA quantity and quality were assessed using the Agilent 2100 Bioanalyzer (Agilent Technologies, Santa Clara, CA) and Nanodrop (Thermo Fisher, Wilmington, DE).
RNA amplification, labeling, and microarray hybridization
Per RNA labeling, 500 μg of total RNA was used in conjunction with the Illumina® TotalPrep RNA Amplification Protocol (Ambion/Applied Biosystems, Cat#AMIL1791). The hybridization cocktail containing the fragmented and labeled cRNAs was hybridized to the Affymetrix Human Genome U133 2.0 Gene Chip. The chips were washed and stained by the Affymetrix Fluidics Station using the standard format and protocols as described by Affymetrix. The probe arrays were stained with streptavidin phycoerythrin solution (Molecular Probes, Carlsbad, CA) and enhanced by using an antibody solution containing 0.5 mg/mL of biotinylated anti-streptavidin (Vector Laboratories, Burlingame, CA). An Affymetrix Gene Chip Scanner 3000 was used to scan the probe arrays. Probe cell intensity data (Affymetrix CEL files) were generated using Affymetrix GeneChip Command Console (AGCC) software. The microarray platform and data have been submitted to the Gene Expression Omnibus public database at NCBI following MIAME guidelines [26].
Validation of gene expression results from microarray by quantitative RT-PCR (qRT-PCR)
To validate the microarray results, genes were selected using the following criteria: 1) upregulated gene (TBRG1); 2) downregulated genes (MAGOH, PDIA3, ARPC3); 3) genes previously associated with diabetes in humans and animal models or associated with T2D or insulin secretion in genome wide scan studies (TBRG1, COL4A2, PDIA3); 4) genes associated with significant canonical pathways among DEGs (HNRNPA1, BAX, PIP5K1A, P1P4K2A); and 5) transcripts with expression fold change (FC) lower than 2 were also included in this step (BLCAP, COL4A2).
RNA samples were reverse transcribed using iScriptTM cDNA synthesis kit with random primers for the qRT-PCR following the manufacturer’s instructions (BIO-RAD, Hercules, CA). The qRT-PCR assay was then carried out on MyIQ system (BIO-RAD, Hercules, CA) using previously synthesized cDNA and TaqMan gene expression assays which include two unlabeled PCR primers and one FAM® dye-labeled TaqMan® MGB probe (Applied Biosystems, Life Technologies Corporation, Carlsbad, CA). A sample volume of 25 µL was used for all assays and contained 12.5 µL of 2× TaqMan universal PCR mix, 1.25 µL of 20× Taqman gene expression assay mix and 11.25 µL of cDNA diluted in RNase-free water. All runs included duplicates of the samples and triplicates of negative control without the target DNA. The thermal cycling conditions were: 25 °C for 5 min, 42 °C for 30 min and 85 °C for 5 min and 4 °C forever.
Data analysis
To identify genes or biological pathways that may be associated with T2D in obesity, we determined the gene expression profiles of OAT from morbidly obese diabetics (cases) and morbidly obese non-diabetics (reference). The generated global gene expression data were assessed by two different methods: differential expression analysis and functional classification of differentially expressed genes (DEGs).
Affymetrix microarray CEL files with probe cell information were further processed in Partek Genomics Suite 6.0 (St Louis, MO) and were summarized into probe-set level data with robust multi-array average (RMA) algorithm [27]. QC of the data and analysis of covariance to identify DEGs among cases and reference were performed subsequently. The threshold for significance in expression change was set at FC of ≤ -2 for downregulated genes, FC of ≥ 2 for upregulated and false discovery rate (FDR) using Benjamini-Hochberg procedure of < 0.05. Classification of DEG into biological processes was done using Protein ANalysis Through Evolutionary Relationship (PANTHER, www.pantherdb.org) [28]. Pathways and interaction networks analyses were performed using Ingenuity Pathway Analysis (IPA®) by uploading the 68 DEG’s Affymetrix probe identification. The significance of canonical pathways and interaction networks was tested using Fisher’s exact test.
To understand the gene expression changes observed in this dataset, we used IPA® upstream regulator analytic tool which is based upon prior knowledge of expected effects between transcriptional regulators and their targeted genes stored in the Ingenuity® Knowledge Base. This tool not only allows identifying potential regulators, which may or may not be differentially expressed, that are involved in the expression change seen but predicts their activation/inhibition. Two statistical measures determined the significance of the upstream regulators identified, the overlap P-value calculated using Fisher’s exact test (significance cutoff is P < 0.01) and activation Z-score which is used to infer the activation state of the regulators [29].
The qRT-PCR data were analyzed using Relative Expression Software Tool (REST 2009), a stand-alone software developed by Pfaffl and Qiagen (http://www.REST.de.com) and uses the ΔΔCt method. The expression values were normalized to a reference gene, GAPDH (Applied Biosystems, Life Technologies Corporation, Carlsbad, CA). Two criteria were used to confirm the microarray results: a quantitative measure namely Spearman’s coefficient correlation (Rho) between qRT-PCR and microarray results and a qualitative measure which is the consistency in the direction of the change in expression between RT-PCR and microarray. The coefficient of correlation and statistical significance were determined using IBM SPSS Statistics v.19; the input data for this analysis were the calculated FCs from the array and the average relative FC from the RT-PCR experiment.
| Results | ▴Top |
Characteristics of study participants
The characteristics of the 20 AA individuals that provided omental adipose tissue (OAT) samples are summarized in Table 1. Six of the 20 individuals were in the reference group (i.e. BMI ≥ 40 kg/m2 and no diabetes); the remaining 14 individuals were cases (i.e. BMI ≥ 40 kg/m2 and diabetes). Fifteen of the 20 subjects were women, and mean BMI and age for the entire sample were 54.6 kg/m2 and 41.1 years, respectively. Cases and individuals in the reference group were not statistically different with respect to BMI and age. The mean plasma fasting glucose for cases was 128.1 mg/dL.
Global gene expression profiling in OAT
Using an absolute expression FC of 2 (FC ≤ - 2, FC ≥ 2) and FDR of < 0.05, we identified 68 differentially expressed transcripts in cases relative to the reference group (Supplementary Table 1, www.jofem.org). The most highly DEGs between the two groups are presented in Table 2. About 3% of the DEGs including myosin X (MYO10, FC = 2.3) and transforming growth factor beta regulator 1 (TBRG1, FC = 2.0) were upregulated in the cases while the remaining including metastasis-associated lung adenocarcinoma transcript 1 (MALAT1, FC = -9.8), Mago-Nashi homolog, proliferation-associated (MAGOH, FC = -6.8), actin-related protein 2/3 complex, subunit 3 (ARPC3, FC = -5.0) and PDIA3 (FC = -5.8) were downregulated.
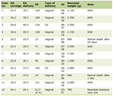
Click to view | Table 2. List of the most highly differentiated genes in omental adipose tissue of morbidly obese and diabetic African Americans |
Functional classification of DEGs in morbidly obese diabetic
To determine the biological functions represented by the DEGs in OAT of these individuals, we evaluated the gene set of 68 DEGs using PANTHER and identified two major biological functions mainly metabolic processes and cellular processes (Fig. 1A). In fact, metabolic and cellular processes represent about 55% of all biological processes (Supplementary Table 2, www.jofem.org). A detailed breakdown of these two major biological functions is depicted in Figure 1B and C. Interestingly, 27 of the 34 DEGs classified in the metabolic process were associated with lipids, carbohydrates, proteins, and nucleobase-containing compound metabolisms. Notably, nucleotide metabolism is the most represented function among the primary metabolic processes (19/27 DEGs, i.e. about 70%, Supplementary Table 3, www.jofem.org). Few of the DEGs were associated with more than one biological functions, e.g. ING3 which plays a role both in carbohydrate and nucleotide metabolism. Other specialized biological functions were also present including immune system, localization (transport and RNA localization), and response to stimulus (Fig. 1A, Supplementary Table 2, www.jofem.org).
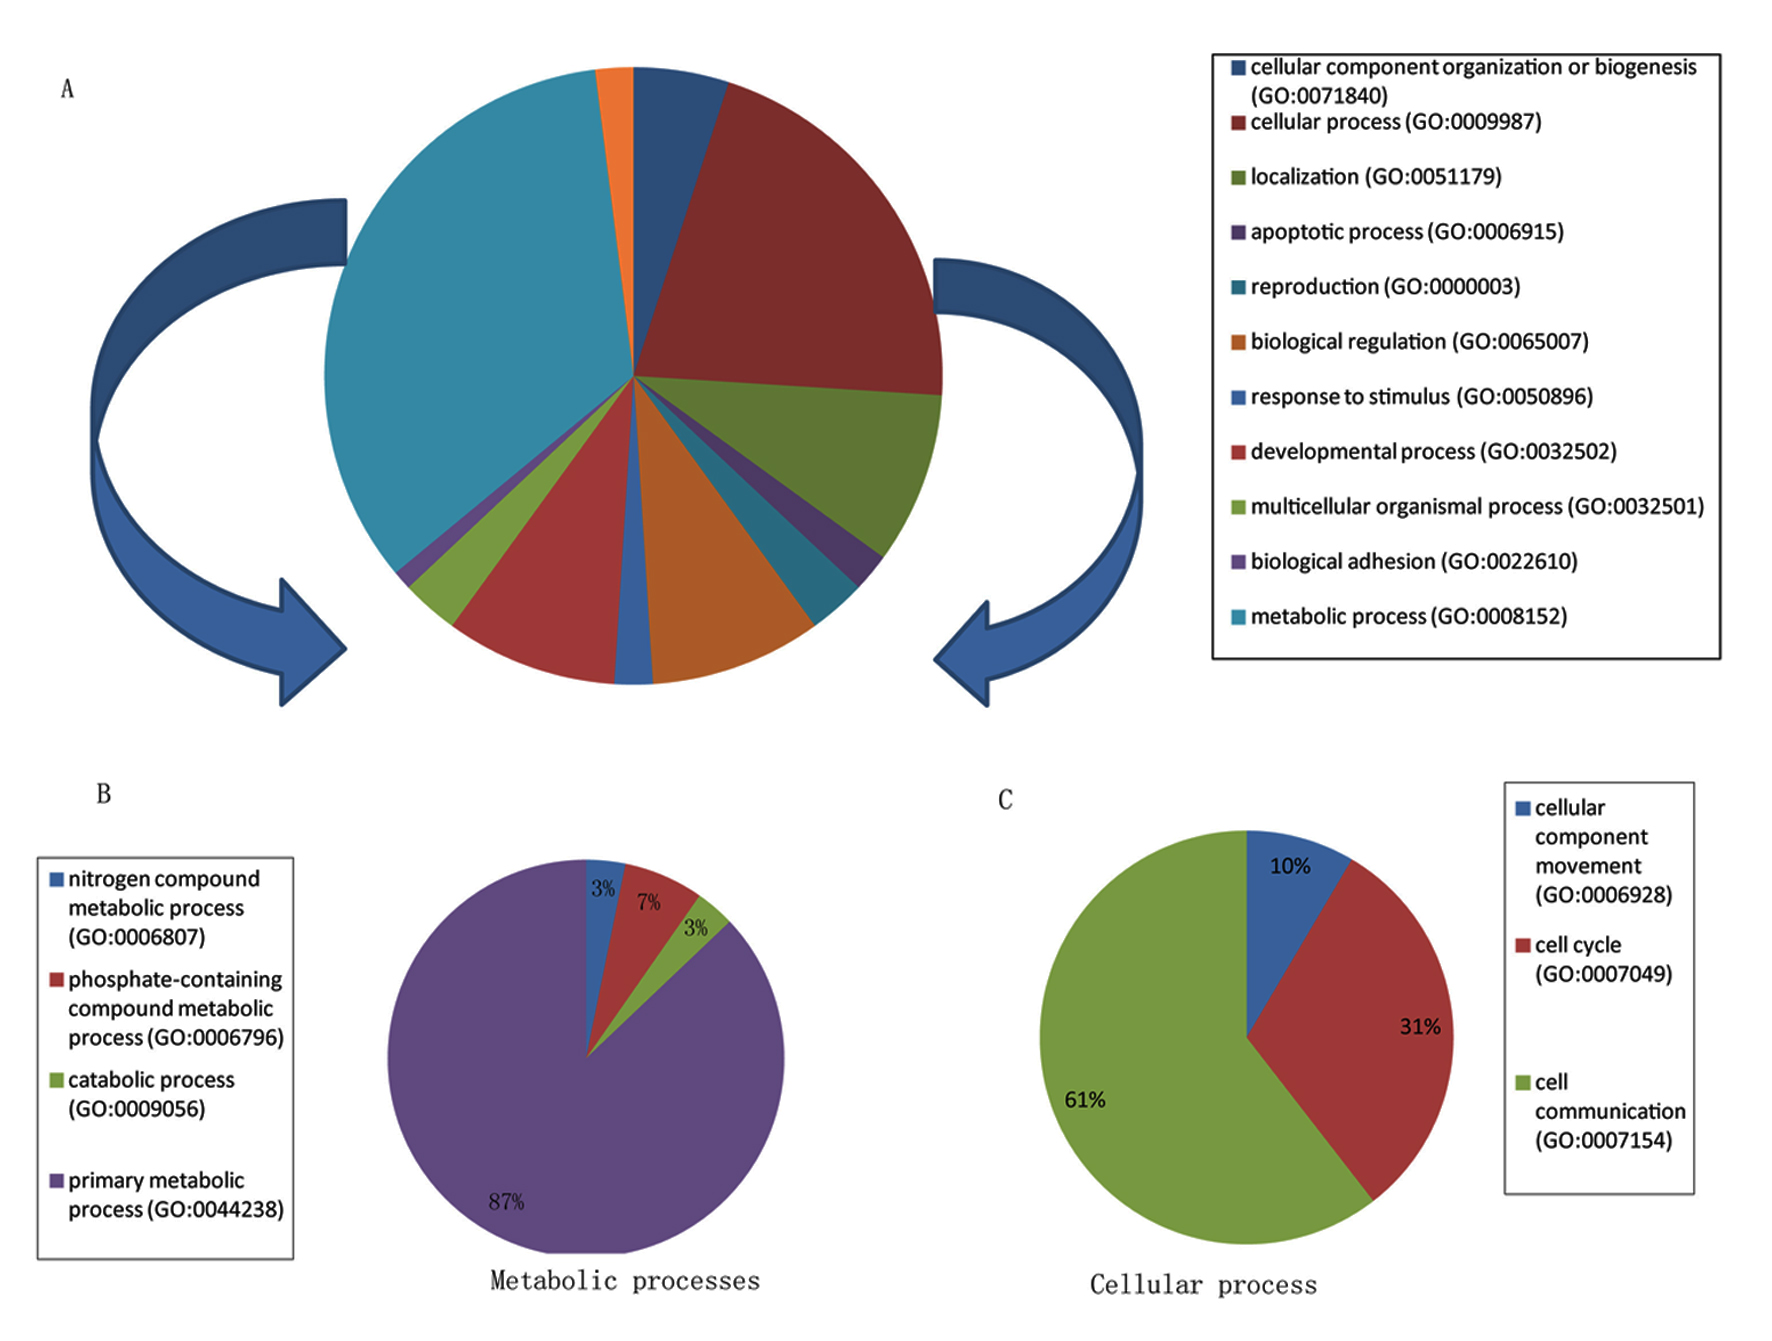 Click for large image | Figure 1. Classification of DEGs among morbidly obese diabetes into biological functions. (A) Pie chart represents all biological functions represented by the 68 DEGs; metabolic and cellular processes denote the two biological classes the most represented. (B) Pie chart represents a breakdown of the metabolic processes shown in A. (C) Pie chart represents a breakdown of the cellular processes shown in A. |
Click to view | Table 3. List of the Most Significant Canonical Pathways Among the 68 DEGs (Based on Core Analysis in Ingenuity Pathway Analysis (IPA) |
IPA canonical pathways and interaction networks associated with DEGs in OAT of morbidly obese diabetic
In addition to the biological functions, pathway analysis was carried out using the core analysis feature of IPA to determine the most enriched pathways among the DEGs in obese diabetics. The most enriched canonical pathways were telomere extension by telomerase implicating two DEGs that are involved in nucleotide metabolism specifically in DNA replication and RNA processing (HNRNPA1, TNKS2, P = 1.4 × 10⁻³), D-myo-inositol (1,4,5)-triphosphate biosynthesis (PIP5K1A, PIP4K2A, P = 3.4 × 10⁻³), and regulation of actin-based motility by Rho (PIP5K1A, PIP4K2A, ARPC3, P = 3.6 × 10⁻³) (Fig. 2, Table 3). All the genes involved in these canonical pathways are downregulated in the obese diabetics compared to the reference group and few play a role in glucose uptake (TNSK2) or in T2D signaling (PIP5K1A) (Fig. 2A, B).
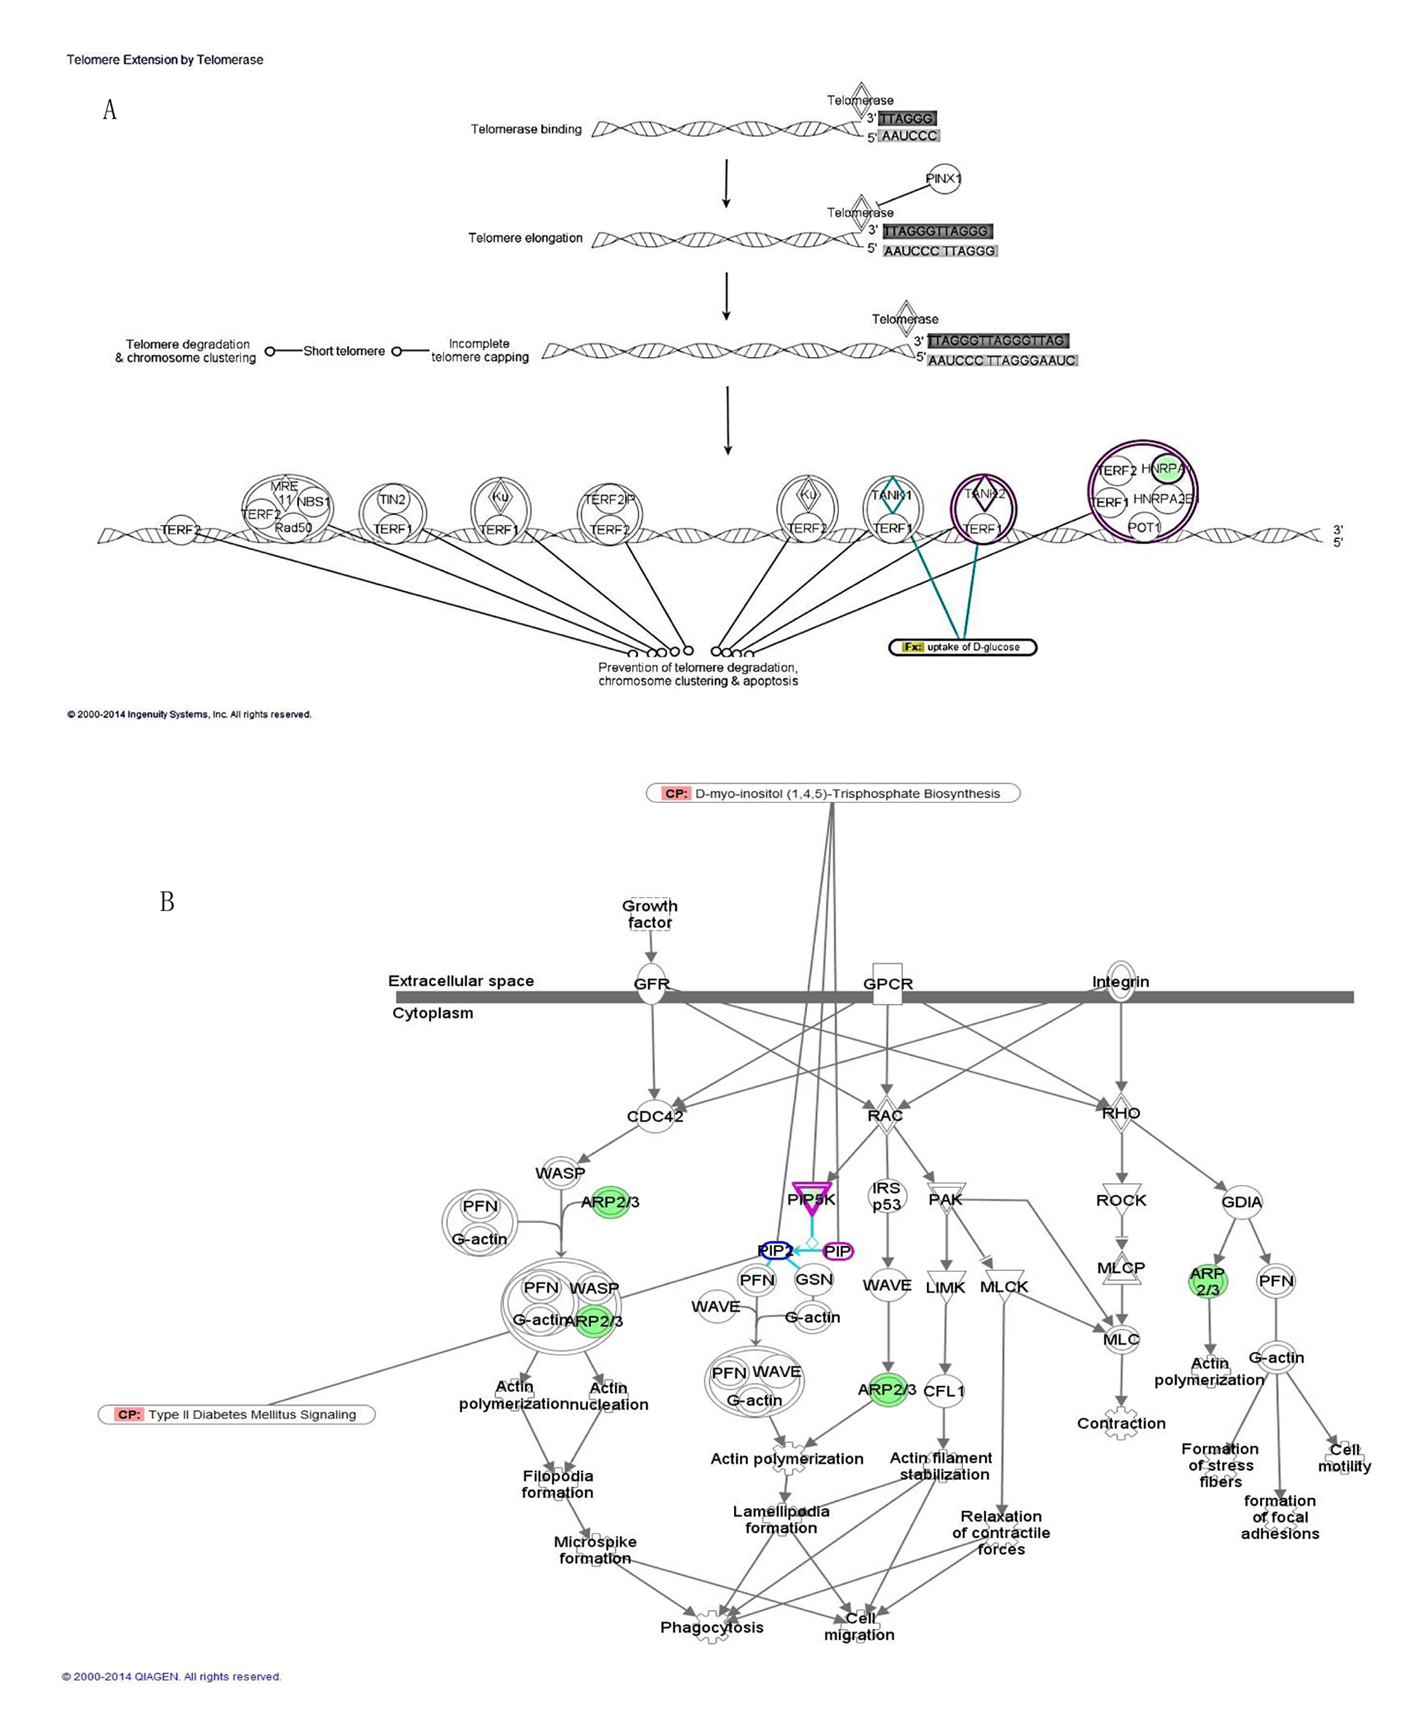 Click for large image | Figure 2. Top canonical pathways enriched among DEGs of morbidly obese diabetics. (A) Telomere extension by telomerase with overlay of glucose uptake function through TNSK2. (B) Regulation of actin-based motility by rho with intersection of D-myo-inositol (1,4,5)-triphosphate biosynthesis through PIP5K and interaction with type 2 diabetes signaling pathway. |
We also investigated interactions among the DEGs in morbidly obese diabetics and identified four eligible gene networks (Table 4). The three gene networks significantly overrepresented are depicted in Figure 3; the top functions of these genes are associated with infectious disease, neurological disease and cancer (network 1, Fig. 3A), dermatological diseases and conditions, developmental disorders, hereditary disorder (network 2, Fig. 3B) and RNA-post-transcriptional modification, metabolic disease, cellular development (network 3, Fig. 3C). These networks identified NFκB, Akt and UBC as hub molecules. Although these hub molecules were not differentially expressed in this dataset, they interact directly or indirectly with number of the identified DEGs. Additionally, NFκB and Akt are critical in insulin-induced glucose homeostasis and may play key roles in the interactions observed among the DEGs in this dataset as revealed by the overlay of T2D canonical pathway on network 1 (Fig. 3A).
Click to view | Table 4. Biological Functions and Diseases Associated With the Top Ranked Networks |
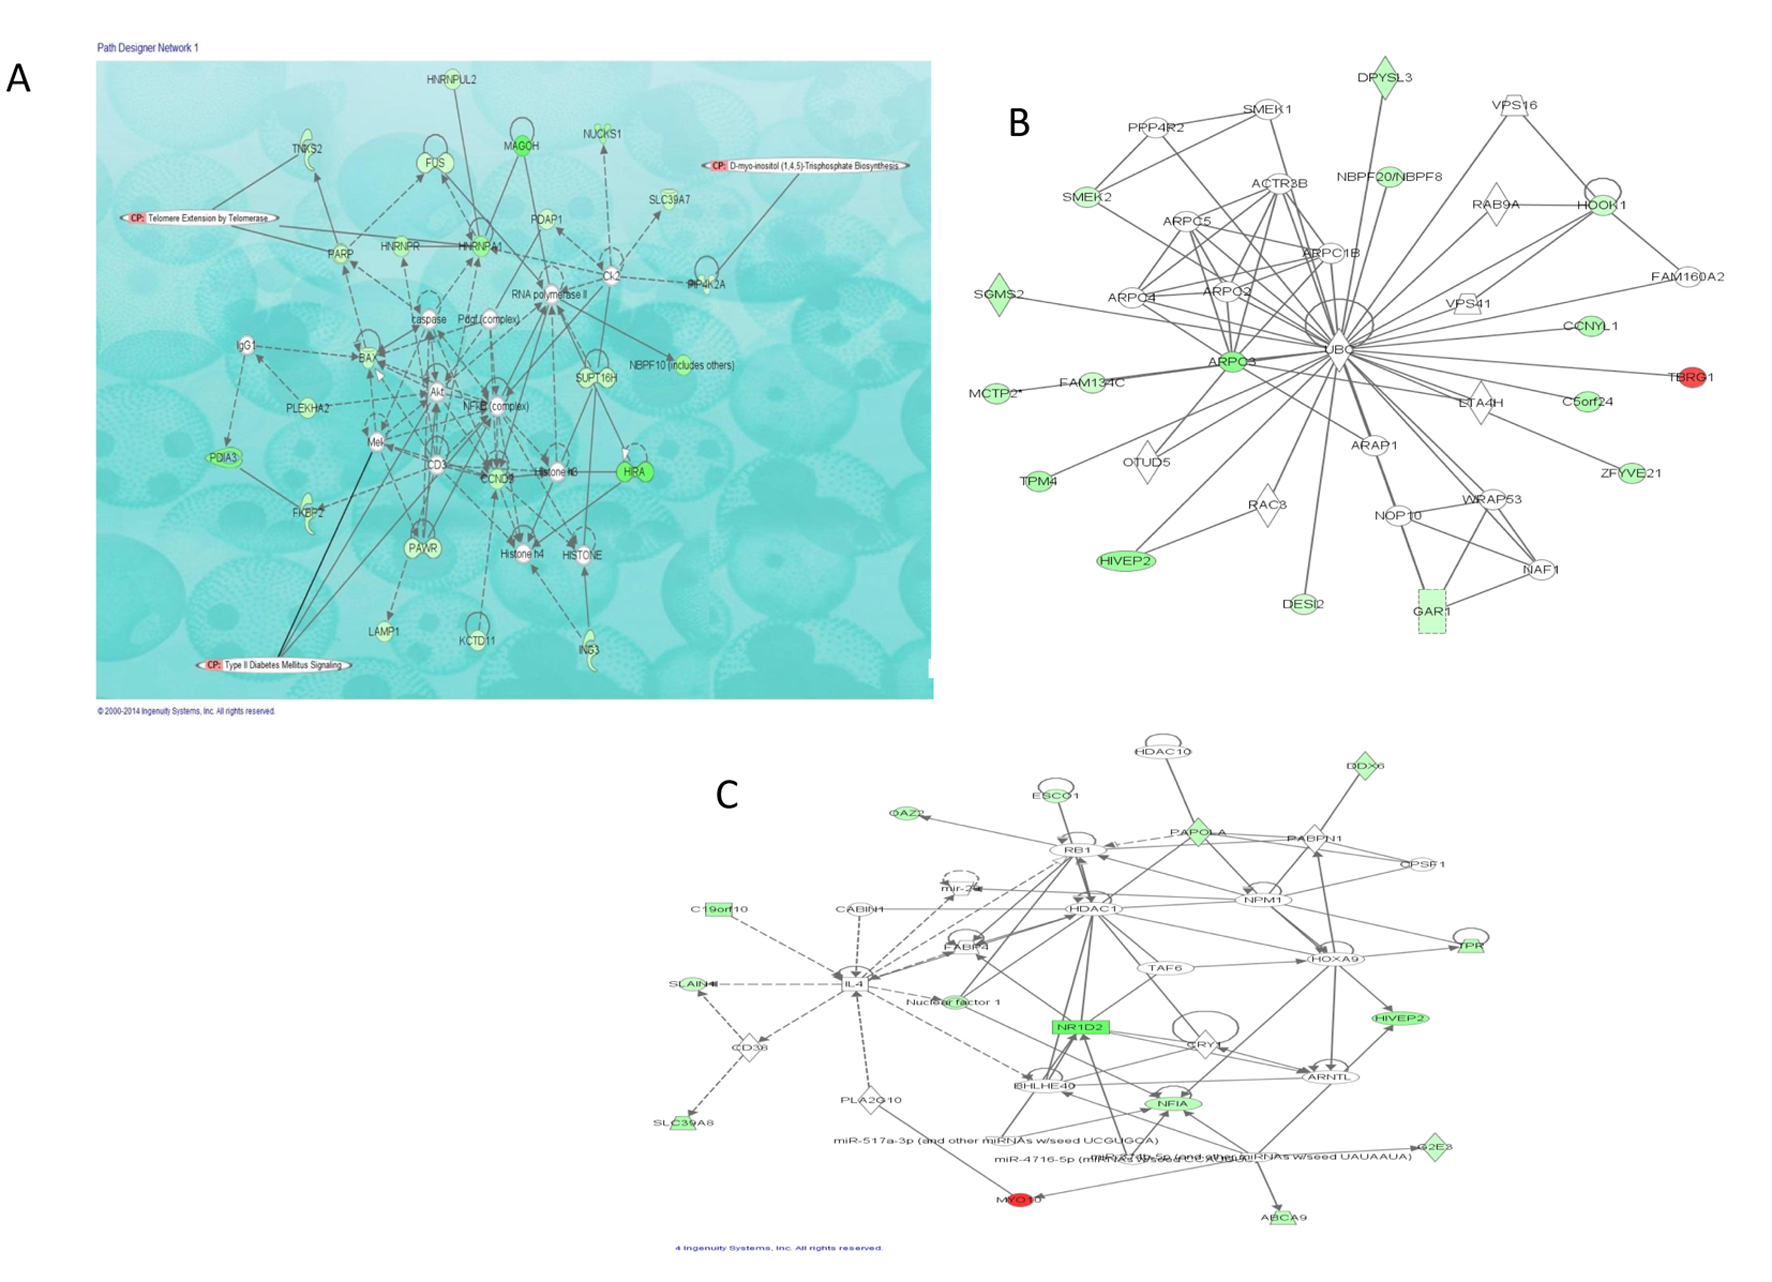 Click for large image | Figure 3. Top three networks showing interactions between selected differentially expressed genes in morbidly obese diabetics. Red: transcripts up-regulated in morbidly obese/diabetic AA; green: transcripts down-regulated in morbidly obese/diabetic AA; white: transcripts not differentially expressed in our study but important in the network. The color gradient in the network indicates the strength of expression denoted by FC. → indicates direct interaction between transcript products; ---> indicates indirect interaction between transcript products; (○) indicates autoregulation. (A) Network 1 with overlay of type 2 diabetic signaling and two of the most significant canonical pathways observed among a number of DEGs. (B) Network 2 representing 16 of the DEGs associated with dermatological diseases and conditions as well as developmental and hereditary diseases. (C) Network 3 representing 14 of the DEGs associated with RNA post-transcriptional modifications, metabolic disease, and cellular development. |
Upstream regulator analysis
To understand the underline regulation of the expression change seen in this dataset, we used IPA upstream regulator analysis. The five most significant upstream regulators identified that would explain the gene expression changes seen were all microRNAs (miR-320b, P = 1.20 × 10⁻⁶; miR-381-3p, P = 2.40 × 10⁻⁵; miR-3679-3p, P = 9.83 × 10⁻⁵; miR-494-3p, P = 9.98 × 10⁻⁵; miR-141-3p, P = 1.76 × 10⁻⁴) and were all predicted to be activated based on the activation Z-score. Network association between the top transcriptional upstream regulators and their target genes showed that activation of the regulators resulted in downregulation of all targeted genes except for MYO10 which is up-regulated (Fig. 4). Interestingly, all but two of the identified miRNAs notably miR-320b, miR-141-3p, miR-494-3p were previously implicated in T2D pathophysiology.
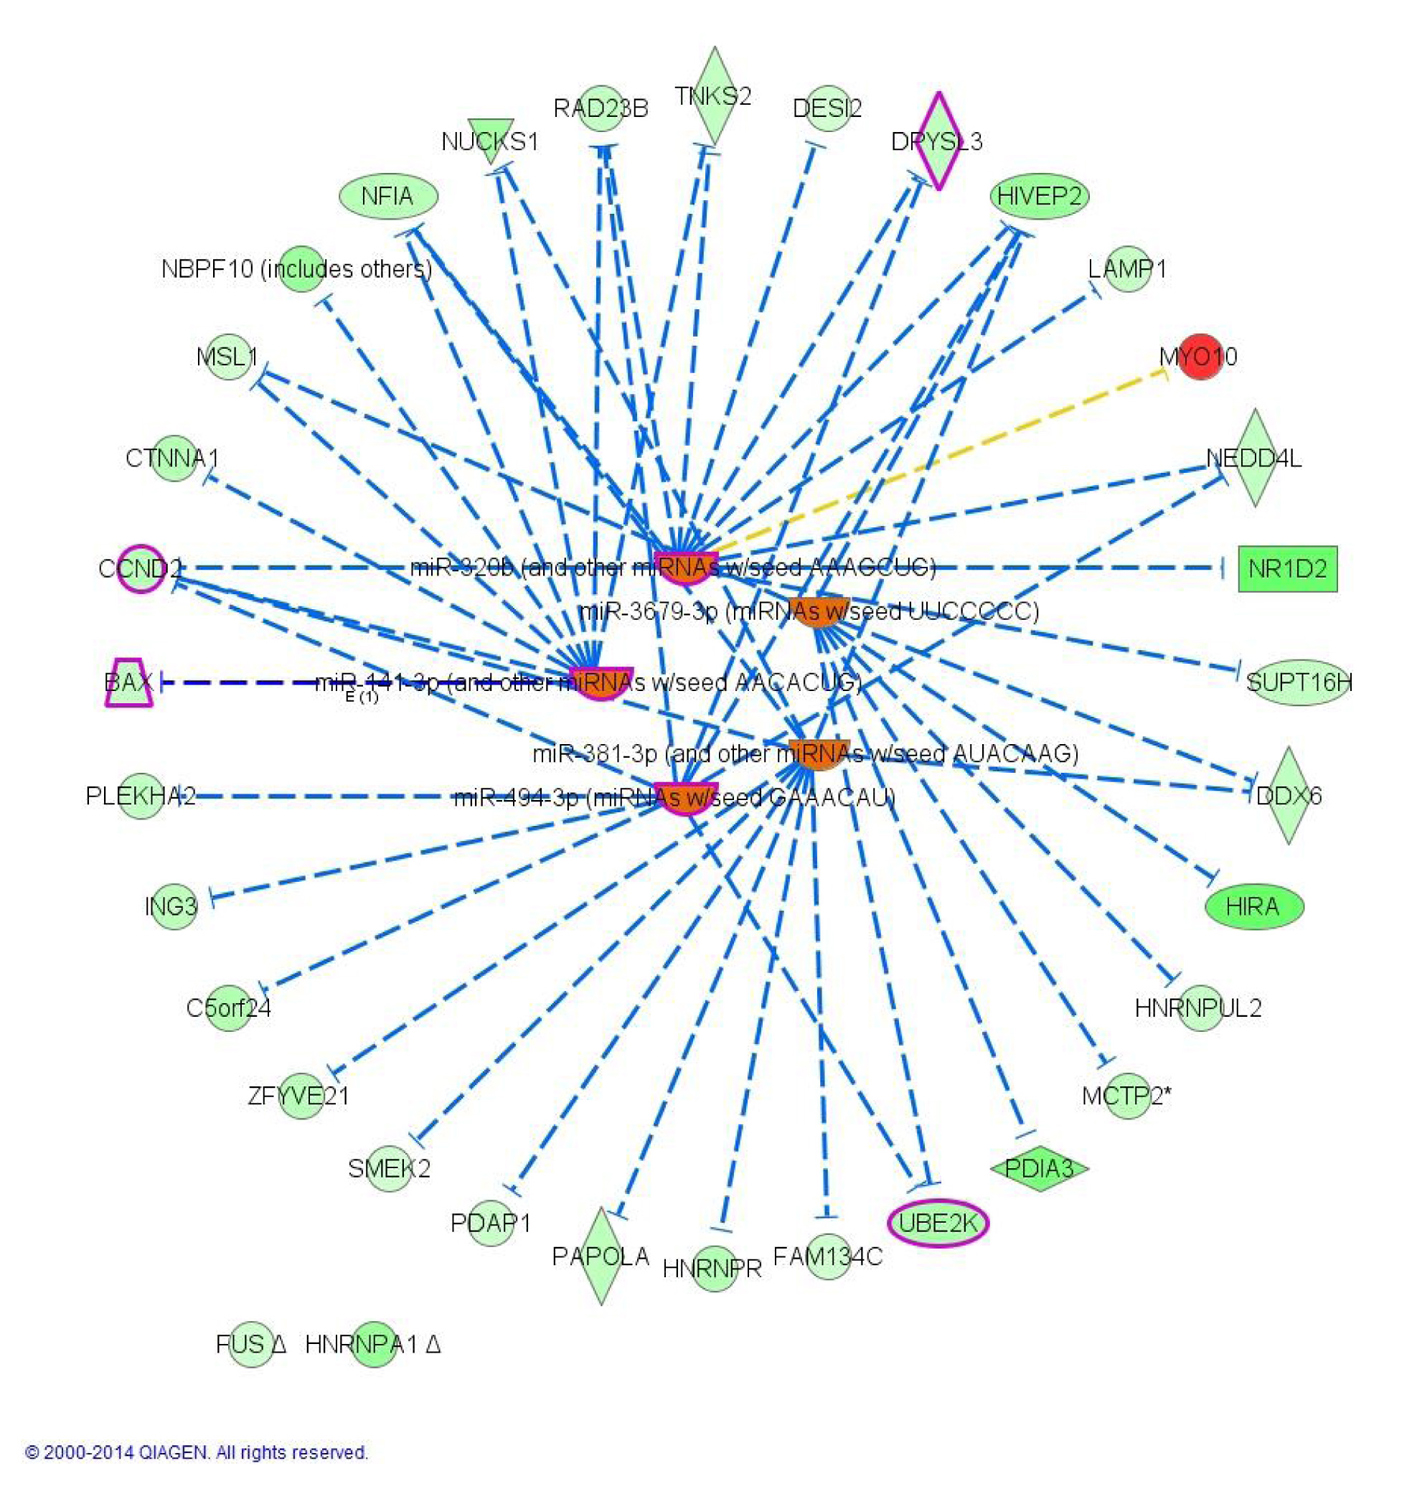 Click for large image | Figure 4. Upstream analysis: network interactions between the five top transcriptional regulators and their target DEGs in morbidly obese diabetics. Orange identifies activated upstream regulators. Green identifies down-regulated target DEGs whereas red identifies up-regulated DEGs. Blunt arrowhead indicates inhibition of the target DEG. Purple indicates genes or regulator that overlay with T2D (4 DEGs + 3 upstream regulators). |
QRT-PCR validation
To validate our microarray data, we evaluated the expression of 11 genes selected from the microarray data using qRT-PCR. The specifics of the gene expression assays are summarized in Supplementary Table 4 (www.jofem.org). Overall, the direction and magnitude of the normalized expression ratios (FC) obtained from qRT-PCR were comparable to those obtained by microarray (Supplementary Figure 1, www.jofem.org). A significant correlation of 0.82 was found among the validation dataset (Spearman’s Rho, P < 0.002, n = 11). Additionally a scatter plot between FC(RT-PCR) and FC(microarray) showed a linear relation between the results from the two methods with all data points falling within the 95% confidence interval (Fig. 5).
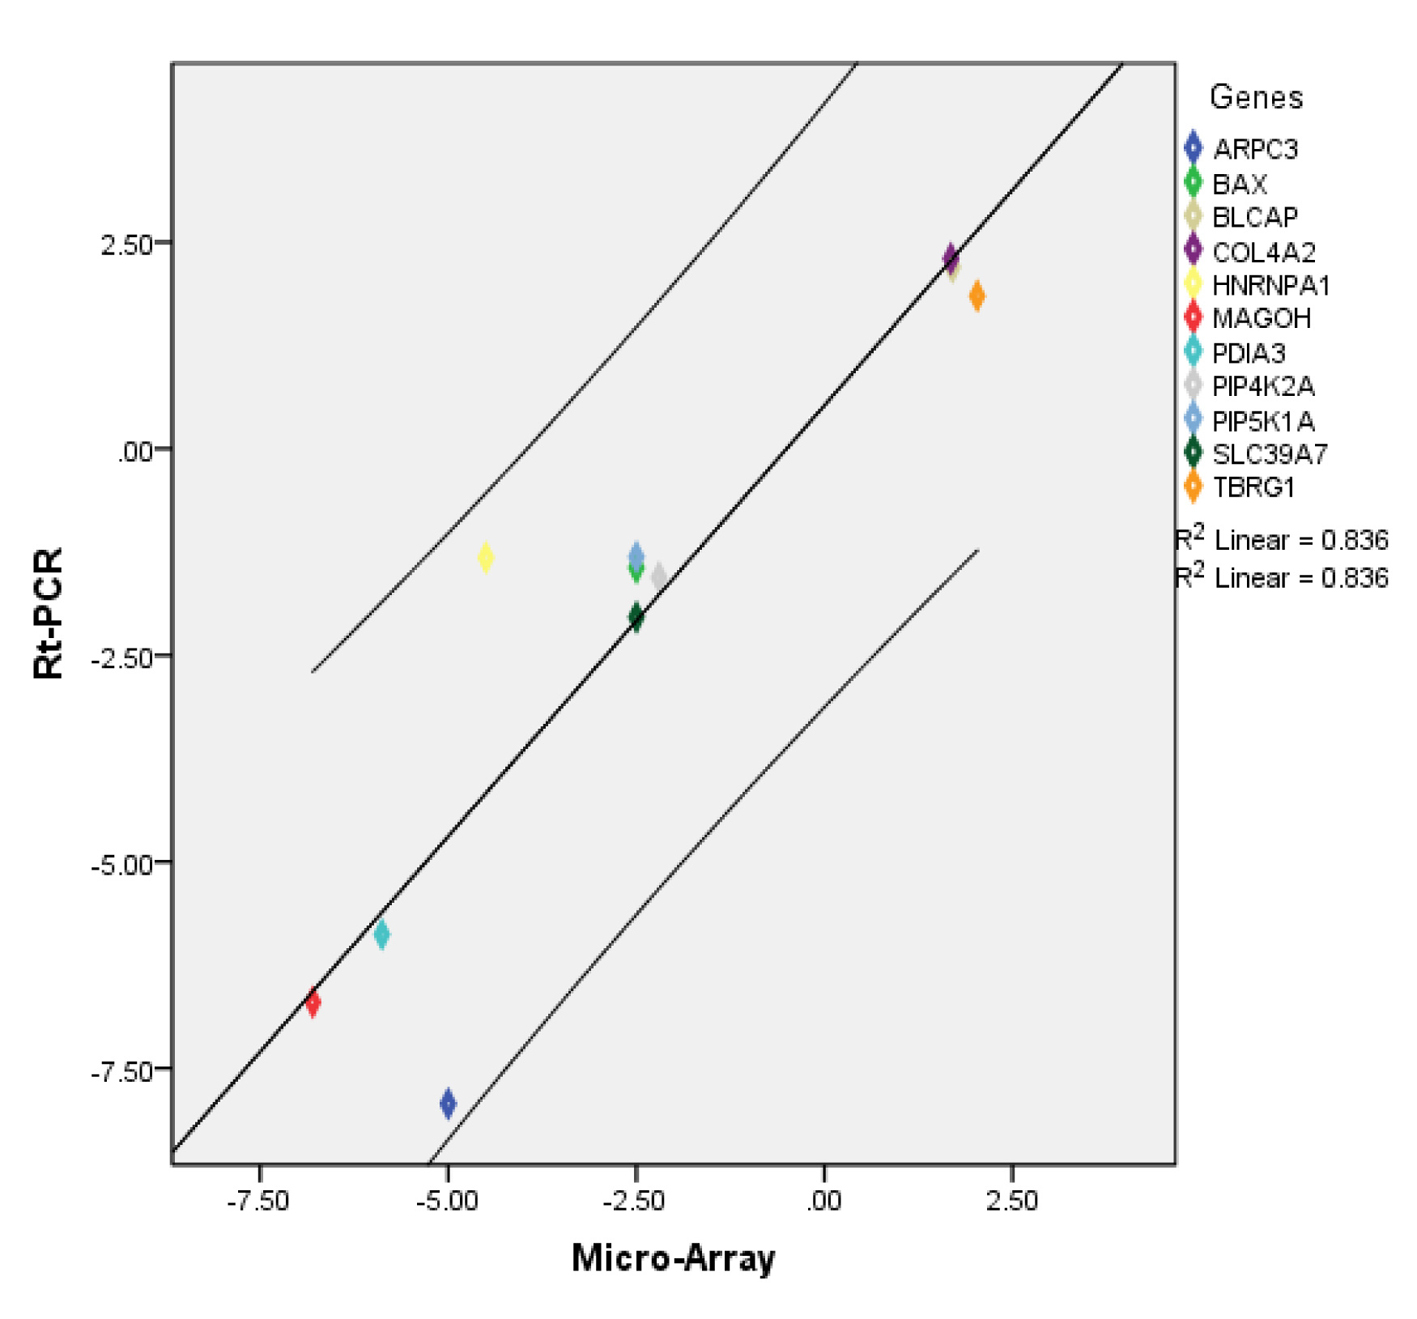 Click for large image | Figure 5. Scatter plot showing relationship between microarray and RT-PCR data for selected transcripts. Diagonal line represents the regression line. |
| Discussion | ▴Top |
We evaluated the global gene expression profile of OAT, a tissue that is recognized to play an important role in the pathophysiology of insulin resistance and T2D. We identified 68 genes, two upregulated and 66 downregulated, that were differentially expressed in morbidly obese African Americans with T2D compared to those that are equally obese but without T2D. MYO10 or myosin X, one of the two most upregulated gene in this study, encodes for an atypical myosin which functions as an actin-based molecular motor and plays a role in integration of F-actin and microtubule cytoskeletons during meiosis. A genome-wide association study in four European populations reported association between MYO10 variants and T2D [30]. More importantly, Zhan et al have not only reported an association between MYO10 variants and metabolic syndrome phenotypes within an adiponectin QTL at 5p14 but also demonstrated that one of the variants had a cis-effect on MYO10 expression in peripheral white blood cells [30]. Even though the mechanisms involved remain unclear, these results suggest a role for MYO10 in the pathophysiology of T2D.
The 68 DEGs were grouped in diverse biological functions and canonical pathways. In contrast to other studies [9], genes involved in primary metabolic processes were overwhelmingly represented among the DEGs especially those involved in RNA processing and DNA replication and repair including FUS, HNRNPA1, HNRNPR, TNKS2, and PAPOLA. RNA processing is a complicated cascade of functions that includes alternative splicing, polyadenylation, and nuclear export of mature RNA. Decreased expression of RNA processing genes in liver and skeletal muscle has been reported to contribute to metabolic phenotypes associated with obesity [31]. While downregulation of RNA processing genes (e.g. heterogeneous nuclear ribonucleoproteins (HNRNPs) which encode for RNA binding proteins) has been reported to be involved in the pathobiology of obesity, to our knowledge, this study is the first to find a link between downregulation of genes involved in RNA processing and T2D in OAT. Importantly, HNRNPs are key player in the formation of spliceosomes that control alternative splicing of a number of human genes. In fact, disruption of alternative splicing has been shown in a number of disease states [31]. Several genes associated with obesity and insulin resistance, a key feature of T2D, are regulated by alternative splicing [31, 32]. Moreover, spliceosomes appear also to regulate telomeres length by modulating telomerase activity [33].
HNRPNPA1 and TNKS2, both downregulated in this study, affect telomere maintenance [34] and also belong to the telomere extension by telomerase pathway, the most significantly enriched pathway in this study. In fact, evidence implicating telomere shortening in metabolic diseases including T2D is growing [35]. Though, telomerase activity and shortening of telomeres were the most demonstrated in beta-cells and leukocytes of diabetics [36], this study reveals that such phenomenon may not just be limited to these cells types. Furthermore, TNKS are not only involved in telomere regulation but also in glucose uptake by GLUT4. TNSKs knockdown in adipocytes impairs glucose uptake [37]. It has also been postulated that the association between T2D and impaired telomerase activity and regulation could also explain the occurrence of certain cancers in diabetics [38]. We observed an overlap between T2D signaling and a number of DEGs that are involved in cancer, infections and neurological diseases (Fig. 3A). These interactions are mediated through factors such as NFκB, Akt, and caspase known for their involvement in multiple diseases.
We also found that the biosynthesis of D-myo-inositol (1,4,5)-triphosphate or IP3, an important cellular second messenger, may be impaired in T2D. Two of the enzymes (PIP5K1A, PIP4K2A) responsible for IP3 synthesis are downregulated in our dataset. IP3 is involved in the release of intracellular calcium, a mechanism important for number of signaling pathways; therefore any disruption to its synthesis can potentially affect the downstream biological events such as GLUT4 vesicles trafficking that depend on intracellular calcium to maintain glucose homeostasis. Sears et al demonstrated that in the absence of intracellular calcium both glucose transporter translocation and glucose uptake are inhibited in vitro [39]. Interestingly, D-myo-inositol (1,4,5)-triphosphate biosynthesis interacts with another significant canonical pathway found in this study, namely the regulation of actin-based motility by Rho through PIP2, a precursor of IP3. Both PIP2 and Arp2/3, an actin-related protein that interacts with neural Wiskott-Alrich syndrome protein (N-WASP) in the regulation of actin-based motility by Rho, control actin polymerization [40]. Arp2/3, which is downregulated in this study, participates in cortical actin regulation and translocation of GLUT4 [41, 42]. Actin remodeling has been shown to be important in the dynamics of insulin-dependent uptake of glucose into target cells by translocation of glucose transporter-4 (GLUT4) and failure in this process may result in an impaired glucose metabolism [43, 44].
Similar to previous reports [9, 19], we observed differential expression in PIP5K1A, ING3, PDIA3, transcripts involved in carbohydrates, lipids and small molecules metabolisms. Though there is a knowledge-based evidence of the potential mechanisms by which the DEGs may be involved in the pathophysiology of T2D, it is equally important to understand the underline mechanisms of regulation contributing to the gene expression change seen in this study. Hence using bioinformatics prediction, we found that most of the DEGs identified are regulated by microRNAs which are all predicted to be in activated state and to inhibit the expression of their respective targeted transcripts. MiR-320b, miR-141-3p, and miR-494-3p have been previously linked to insulin resistance and T2D [45]. However, miR-320b’s regulation of glucose homeostasis varies with tissue type. In adipocytes, its expression is increased in insulin resistance state whereas its expression is decreased in plasma of T2D patients [46, 47]. MiR-320 was shown to regulate insulin resistance in adipocytes by targeting Akt/PI3K pathways via phosphorylation of Akt and by increasing insulin-stimulated glucose uptake through increased protein expression of the glucose transporter GLUT4 [46]. To the best of our knowledge, miR-381-3p and miR-3679-3p were not previously linked to insulin resistance or T2D and would constitute novel miRNAs detected in OAT of morbidly obese diabetics and implicated in T2D [45].
The design and methods used in this study are not without limitations. One major limitation is the use of commercially acquired samples with limited phenotype data or unavailability of other biological specimens (e.g., serum and plasma) that would have allowed us assessing the association between transcript levels, protein levels and relevant phenotypes or to carry out functional assays to determine the causality of our findings. Cognizant of these limitations, we validated identified transcripts using RT-PCR. Also, this study is cross-sectional in nature and cannot infer causality. It remains imperative to replicate our findings and to determine the generalizability of these findings to other tissues (e.g., muscles) important in the pathophysiology of T2D.
In summary, this study provided key insights into gene expression patterns and pathways that distinguish between subjects with morbid obesity and diabetes versus those that are only morbidly obese. Thus, the expectation is that most of these differences are attributable to the diabetic state. Importantly the data point to the roles of: 1) RNA binding proteins (HNRNPs and TNSKs) in telomere maintenance, 2) enzymes (PIP5K1A, PIP4K2A) that regulate the biosynthesis of second messenger (IP3) important in glucose homeostasis, and 3) actin remodeling (Arp3) and d) microRNA in T2D. The study also provides a resource for future investigations.
Acknowledgement
Support for this study is provided by NIH grant No. 3T37TW00041-03S2 from the Office of Research on Minority Health, the National Human Genome Research Institute (NHGRI), the National Center for Research resources (NCRR) and NIDDK grant DK-54001. Expression profiling using Affymetrix HU-133 Plus 2.0 Arrays was conducted in the NHGRI microarray core facility. The contents of this publication are solely the responsibility of the authors and do not necessarily represent the official view of the National Institutes of Health. This research was supported in part by the Intramural Research Program of the Center for Research on Genomics and Global Health. The Center for Research on Genomics and Global Health is supported by the National Human Genome Research Institute, the National Institute of Diabetes and Digestive and Kidney Diseases, the Center for Information Technology, and the Office of the Director at the National Institutes of Health (Z01HG200362).
Conflict of Interest
The authors declare that there is no conflict of interest associated with this manuscript.
| References | ▴Top |
- Seidell JC. Obesity, insulin resistance and diabetes--a worldwide epidemic. Br J Nutr. 2000;83 (Suppl 1):S5-8.
doi pubmed - van Dieren S, Beulens JW, van der Schouw YT, Grobbee DE, Neal B. The global burden of diabetes and its complications: an emerging pandemic. Eur J Cardiovasc Prev Rehabil. 2010;17(Suppl 1):S3-8.
doi pubmed - Ogden CL, CM, Kit BK, Flegal KM. Prevalence of obesity in the United States, 2009-2010. National Center for Health Statistics, data brief. 2012;82.
- Shamseddeen H, Getty JZ, Hamdallah IN, Ali MR. Epidemiology and economic impact of obesity and type 2 diabetes. Surg Clin North Am. 2011;91(6):1163-1172, vii.
doi pubmed - Boyle JP, Thompson TJ, Gregg EW, Barker LE, Williamson DF. Projection of the year 2050 burden of diabetes in the US adult population: dynamic modeling of incidence, mortality, and prediabetes prevalence. Popul Health Metr. 2010;8:29.
doi pubmed - Kumanyika SK. Special issues regarding obesity in minority populations. Ann Intern Med. 1993;119(7 Pt 2):650-654.
doi pubmed - Flegal KM, Carroll MD, Kit BK, Ogden CL. Prevalence of obesity and trends in the distribution of body mass index among US adults, 1999-2010. JAMA. 2012;307(5):491-497.
doi pubmed - Boardley D, Pobocik RS. Obesity on the rise. Prim Care. 2009;36(2):243-255.
doi pubmed - Sun G. Application of DNA microarrays in the study of human obesity and type 2 diabetes. OMICS. 2007;11(1):25-40.
doi pubmed - Takamura T, Sakurai M, Ota T, Ando H, Honda M, Kaneko S. Genes for systemic vascular complications are differentially expressed in the livers of type 2 diabetic patients. Diabetologia. 2004;47(4):638-647.
doi pubmed - Castro-Chavez F, Yechoor VK, Saha PK, Martinez-Botas J, Wooten EC, Sharma S, O'Connell P, et al. Coordinated upregulation of oxidative pathways and downregulation of lipid biosynthesis underlie obesity resistance in perilipin knockout mice: a microarray gene expression profile. Diabetes. 2003;52(11):2666-2674.
doi pubmed - Choi K, Kim YB. Molecular mechanism of insulin resistance in obesity and type 2 diabetes. Korean J Intern Med. 2010;25(2):119-129.
doi pubmed - Gesta S, Bluher M, Yamamoto Y, Norris AW, Berndt J, Kralisch S, Boucher J, et al. Evidence for a role of developmental genes in the origin of obesity and body fat distribution. Proc Natl Acad Sci U S A. 2006;103(17):6676-6681.
doi pubmed - Obici S, Wang J, Chowdury R, Feng Z, Siddhanta U, Morgan K, Rossetti L. Identification of a biochemical link between energy intake and energy expenditure. J Clin Invest. 2002;109(12):1599-1605.
doi pubmed - Odom DT, Zizlsperger N, Gordon DB, Bell GW, Rinaldi NJ, Murray HL, Volkert TL, et al. Control of pancreas and liver gene expression by HNF transcription factors. Science. 2004;303(5662):1378-1381.
doi pubmed - Yang X, Pratley RE, Tokraks S, Bogardus C, Permana PA. Microarray profiling of skeletal muscle tissues from equally obese, non-diabetic insulin-sensitive and insulin-resistant Pima Indians. Diabetologia. 2002;45(11):1584-1593.
doi pubmed - Chambers JC, Zhang W, Sehmi J, Li X, Wass MN, Van der Harst P, Holm H, et al. Genome-wide association study identifies loci influencing concentrations of liver enzymes in plasma. Nat Genet. 2011;43(11):1131-1138.
doi pubmed - Gnacinska M, Malgorzewicz S, Stojek M, Lysiak-Szydlowska W, Sworczak K. Role of adipokines in complications related to obesity: a review. Adv Med Sci. 2009;54(2):150-157.
doi pubmed - Baranova A, Collantes R, Gowder SJ, Elariny H, Schlauch K, Younoszai A, King S, et al. Obesity-related differential gene expression in the visceral adipose tissue. Obes Surg. 2005;15(6):758-765.
doi pubmed - Gabrielsson BG, Johansson JM, Lonn M, Jernas M, Olbers T, Peltonen M, Larsson I, et al. High expression of complement components in omental adipose tissue in obese men. Obes Res. 2003;11(6):699-708.
doi pubmed - Vohl MC, Sladek R, Robitaille J, Gurd S, Marceau P, Richard D, Hudson TJ, et al. A survey of genes differentially expressed in subcutaneous and visceral adipose tissue in men. Obes Res. 2004;12(8):1217-1222.
doi pubmed - Yang X, Jansson PA, Nagaev I, Jack MM, Carvalho E, Sunnerhagen KS, Cam MC, et al. Evidence of impaired adipogenesis in insulin resistance. Biochem Biophys Res Commun. 2004;317(4):1045-1051.
doi pubmed - Kanoh Y, Bandyopadhyay G, Sajan MP, Standaert ML, Farese RV. Rosiglitazone, insulin treatment, and fasting correct defective activation of protein kinase C-zeta/lambda by insulin in vastus lateralis muscles and adipocytes of diabetic rats. Endocrinology. 2001;142(4):1595-1605.
pubmed - Sakoda H, Ogihara T, Anai M, Funaki M, Inukai K, Katagiri H, Fukushima Y, et al. Dexamethasone-induced insulin resistance in 3T3-L1 adipocytes is due to inhibition of glucose transport rather than insulin signal transduction. Diabetes. 2000;49(10):1700-1708.
doi pubmed - Sharma PM, Egawa K, Gustafson TA, Martin JL, Olefsky JM. Adenovirus-mediated overexpression of IRS-1 interacting domains abolishes insulin-stimulated mitogenesis without affecting glucose transport in 3T3-L1 adipocytes. Mol Cell Biol. 1997;17(12):7386-7397.
pubmed - Brazma A, Hingamp P, Quackenbush J, Sherlock G, Spellman P, Stoeckert C, Aach J, et al. Minimum information about a microarray experiment (MIAME)-toward standards for microarray data. Nat Genet. 2001;29(4):365-371.
doi pubmed - Irizarry RA, Hobbs B, Collin F, Beazer-Barclay YD, Antonellis KJ, Scherf U, Speed TP. Exploration, normalization, and summaries of high density oligonucleotide array probe level data. Biostatistics. 2003;4(2):249-264.
doi pubmed - Mi H, Muruganujan A, Thomas PD. PANTHER in 2013: modeling the evolution of gene function, and other gene attributes, in the context of phylogenetic trees. Nucleic Acids Res. 2013;41(Database issue):D377-386.
doi pubmed - Systems I. Ingenuity Upstream Regulator Analysis in IPA. 2014;1-11.
- Salonen JT, Uimari P, Aalto JM, Pirskanen M, Kaikkonen J, Todorova B, Hypponen J, et al. Type 2 diabetes whole-genome association study in four populations: the DiaGen consortium. Am J Hum Genet. 2007;81(2):338-345.
doi pubmed - Pihlajamaki J, Lerin C, Itkonen P, Boes T, Floss T, Schroeder J, Dearie F, et al. Expression of the splicing factor gene SFRS10 is reduced in human obesity and contributes to enhanced lipogenesis. Cell Metab. 2011;14(2):208-218.
doi pubmed - Kaminska D, Pihlajamaki J. Regulation of alternative splicing in obesity and weight loss. Adipocyte. 2013;2(3):143-147.
doi pubmed - Bonnal S, Valcarcel J. Molecular biology: spliceosome meets telomerase. Nature. 2008;456(7224):879-880.
doi pubmed - Tsai YL, Tseng SF, Chang SH, Lin CC, Teng SC. Involvement of replicative polymerases, Tel1p, Mec1p, Cdc13p, and the Ku complex in telomere-telomere recombination. Mol Cell Biol. 2002;22(16):5679-5687.
doi pubmed - Kuhlow D, Florian S, von Figura G, Weimer S, Schulz N, Petzke KJ, Zarse K, et al. Telomerase deficiency impairs glucose metabolism and insulin secretion. Aging (Albany NY). 2010;2(10):650-658.
- Liew CW, Holman A, Kulkarni RN. The roles of telomeres and telomerase in beta-cell regeneration. Diabetes Obes Metab. 2009;11(Suppl 4):21-29.
doi pubmed - Yeh TY, Sbodio JI, Tsun ZY, Luo B, Chi NW. Insulin-stimulated exocytosis of GLUT4 is enhanced by IRAP and its partner tankyrase. Biochem J. 2007;402(2):279-290.
doi pubmed - Sampson MJ, Hughes DA. Chromosomal telomere attrition as a mechanism for the increased risk of epithelial cancers and senescent phenotypes in type 2 diabetes. Diabetologia. 2006;49(8):1726-1731.
doi pubmed - Worrall DS, Olefsky JM. The effects of intracellular calcium depletion on insulin signaling in 3T3-L1 adipocytes. Mol Endocrinol. 2002;16(2):378-389.
doi pubmed - Sakisaka T, Itoh T, Miura K, Takenawa T. Phosphatidylinositol 4,5-bisphosphate phosphatase regulates the rearrangement of actin filaments. Mol Cell Biol. 1997;17(7):3841-3849.
pubmed - Jun HS, Hwang K, Kim Y, Park T. High-fat diet alters PP2A, TC10, and CIP4 expression in visceral adipose tissue of rats. Obesity (Silver Spring). 2008;16(6):1226-1231.
doi pubmed - Ramm G, James DE. GLUT4 trafficking in a test tube. Cell Metab. 2005;2(3):150-152.
doi pubmed - Usui I, Imamura T, Huang J, Satoh H, Olefsky JM. Cdc42 is a Rho GTPase family member that can mediate insulin signaling to glucose transport in 3T3-L1 adipocytes. J Biol Chem. 2003;278(16):13765-13774.
doi pubmed - Uphues I, Kolter T, Goud B, Eckel J. Failure of insulin-regulated recruitment of the glucose transporter GLUT4 in cardiac muscle of obese Zucker rats is associated with alterations of small-molecular-mass GTP-binding proteins. Biochem J. 1995;311 (Pt 1):161-166.
pubmed - Li Y, Qiu C, Tu J, Geng B, Yang J, Jiang T, Cui Q. HMDD v2.0: a database for experimentally supported human microRNA and disease associations. Nucleic Acids Res. 2014;42(Database issue):D1070-1074.
doi pubmed - Ling HY, Ou HS, Feng SD, Zhang XY, Tuo QH, Chen LX, Zhu BY, et al. CHANGES IN microRNA (miR) profile and effects of miR-320 in insulin-resistant 3T3-L1 adipocytes. Clin Exp Pharmacol Physiol. 2009;36(9):e32-39.
doi pubmed - Zampetaki A, Kiechl S, Drozdov I, Willeit P, Mayr U, Prokopi M, Mayr A, et al. Plasma microRNA profiling reveals loss of endothelial miR-126 and other microRNAs in type 2 diabetes. Circ Res. 2010;107(6):810-817.
doi pubmed
This is an open-access article distributed under the terms of the Creative Commons Attribution License, which permits unrestricted use, distribution, and reproduction in any medium, provided the original work is properly cited.
Journal of Endocrinology and Metabolism is published by Elmer Press Inc.